

 Popular Countries
 24/7 Support
Published
Bora Bora is one of French Polynesia’s most recognisable island destinations, known for its turquoise lagoon, overwater bungalows, Mount Otemanu, marine activities and luxury resort stays. Because Bora Bora is part of French Polynesia, most official tourism statistics are published at the French Polynesia level rather than for Bora Bora alone.
How many tourists visit Bora Bora and French Polynesia each year?
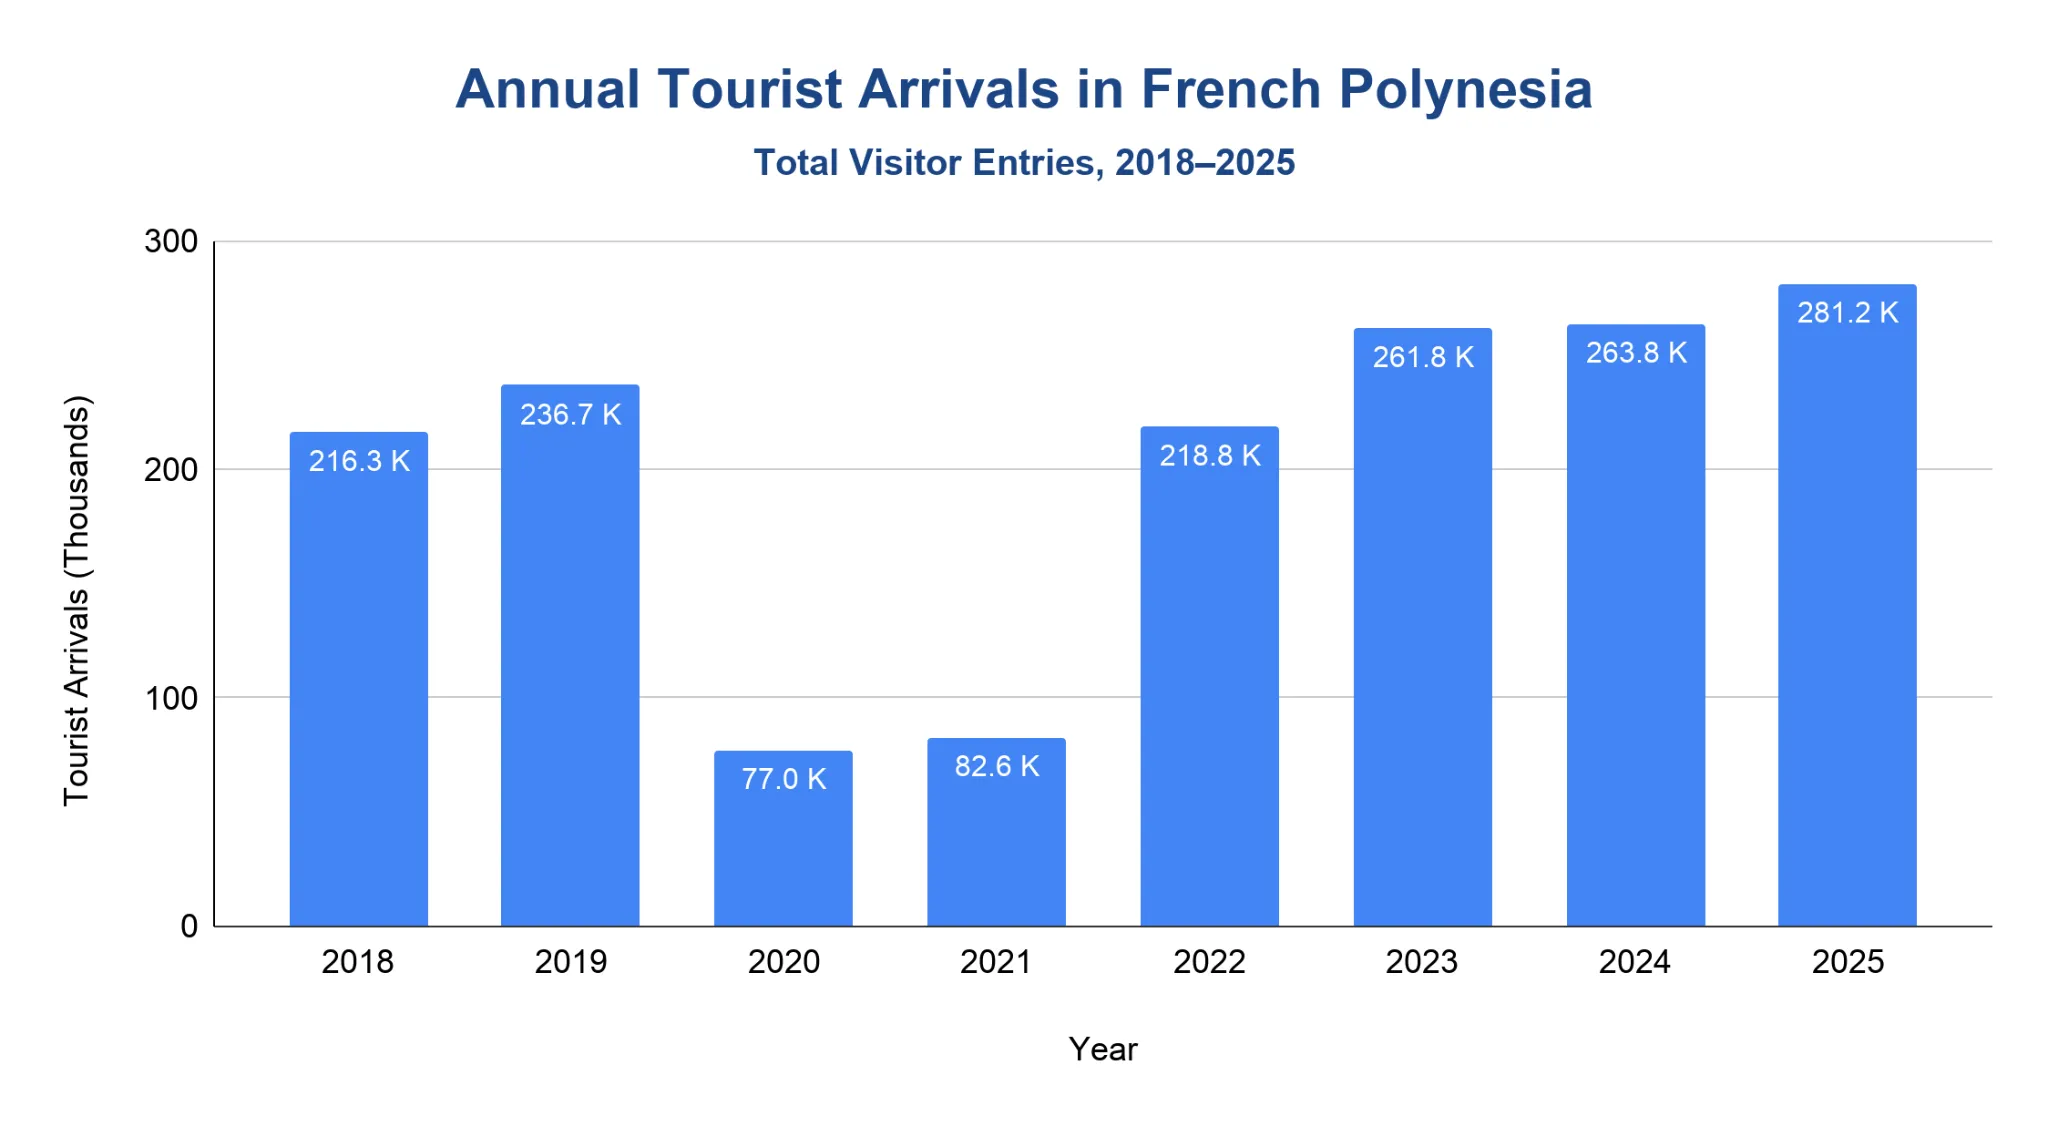
French Polynesia welcomed 281,227 tourists in 2025, up 6.6% from 263,766 tourists in 2024.
- From 2014 to 2025, French Polynesia averaged 199,494 tourists per year.
- Tourist arrivals rose from 180,602 tourists in 2014 to 236,650 tourists in 2019, the main pre-pandemic benchmark.
- Arrivals fell to 77,017 tourists in 2020 and 82,550 tourists in 2021 during the pandemic period.
- Recovery accelerated from 218,750 tourists in 2022 to 261,813 tourists in 2023, 263,766 tourists in 2024 and 281,227 tourists in 2025.
- The 2025 total was 18.8% higher than 2019, calculated from the full official annual values.
- In daily terms, 2025 averaged about 770 tourists per day, or about 962 total visitors per day including excursionists.
Note: Tourists are visitors who spend at least one night in French Polynesia, either in land-based accommodation or on an intra-Polynesian cruise. Total visitors also include excursionists from transpacific cruise ships.
How much do tourists spend in Bora Bora and French Polynesia?
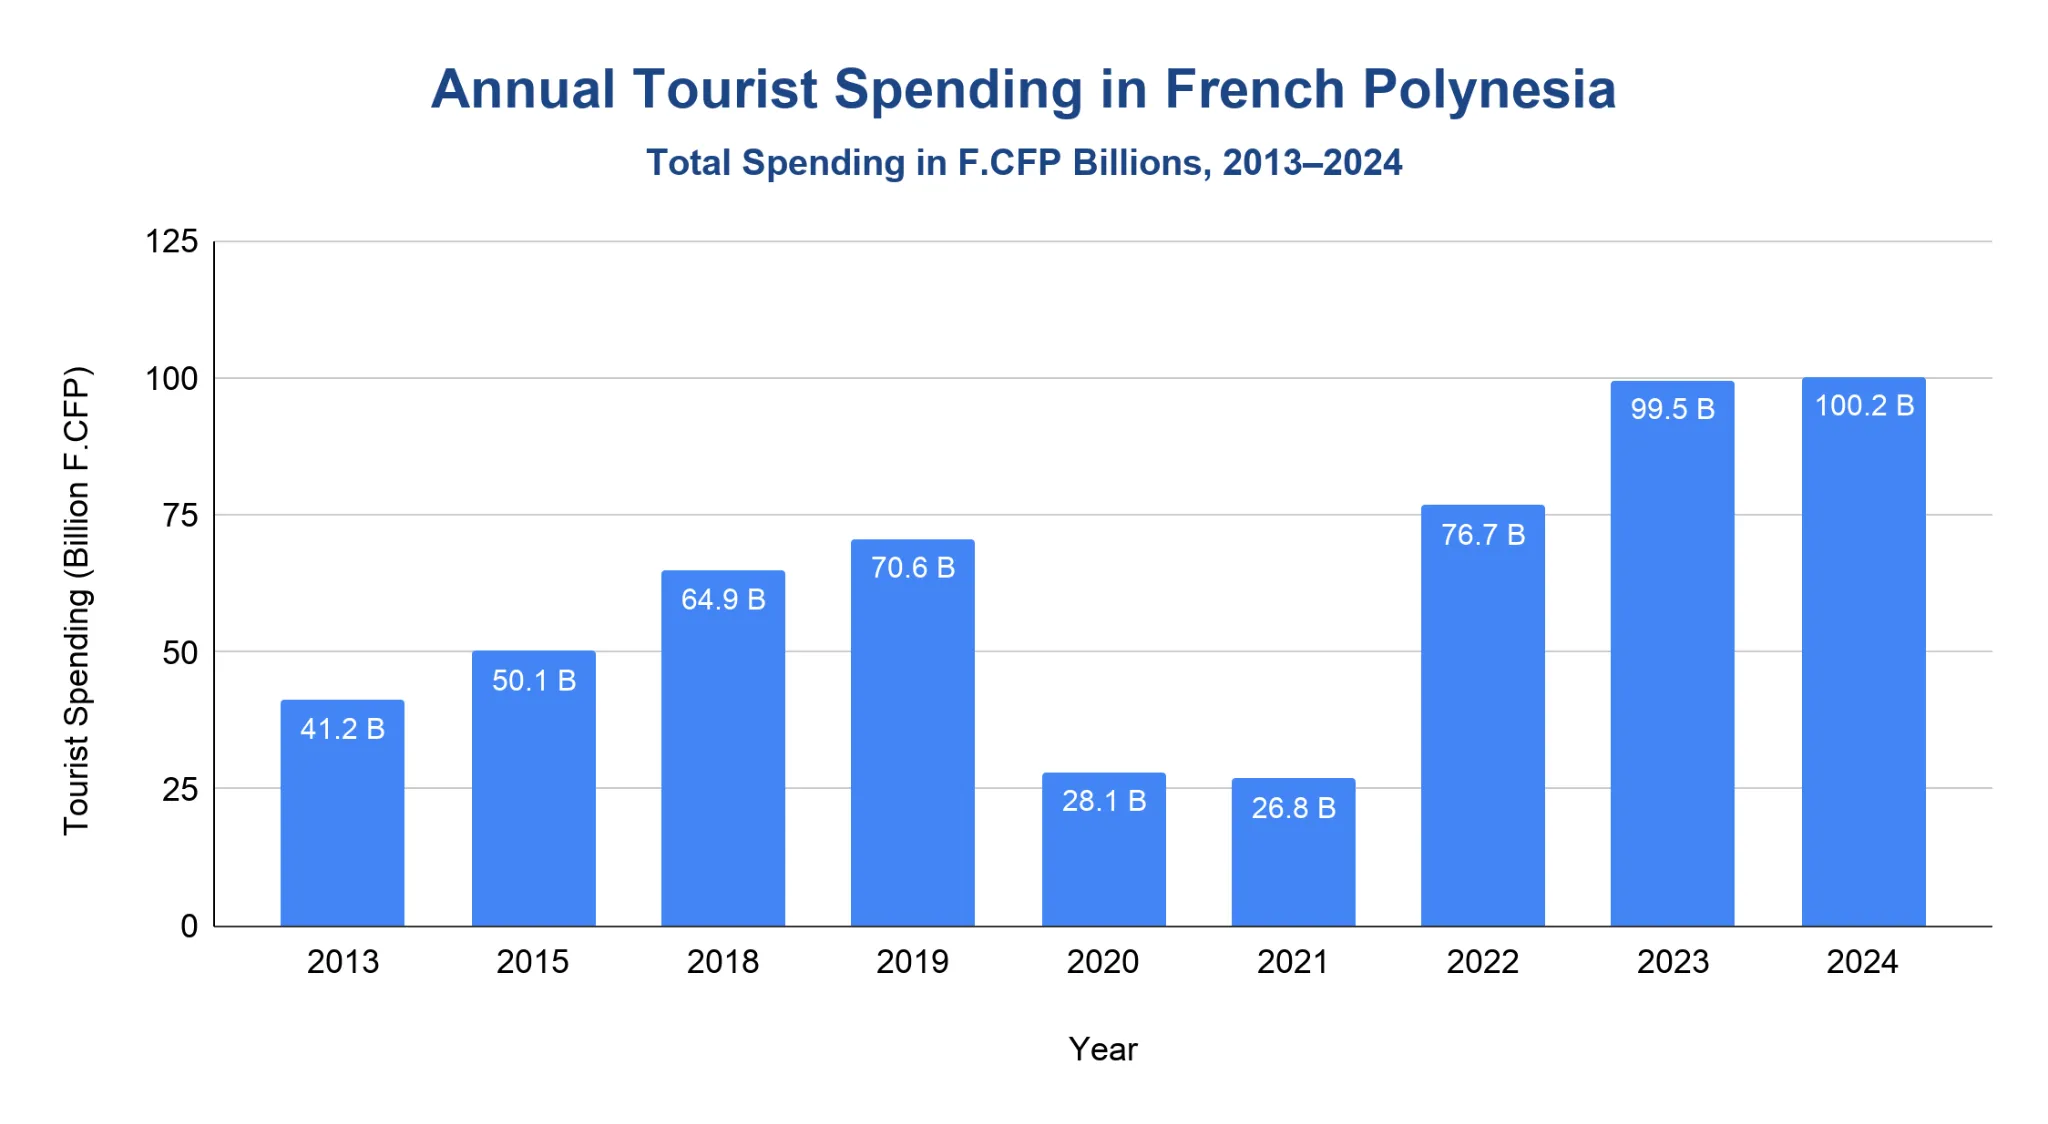
Tourism spending in French Polynesia reached 100.19 billion F.CFP in 2024, up 0.7% from 99.53 billion F.CFP in 2023.
- Tourist spending increased from 41.17 billion F.CFP in 2013 to 50.12 billion F.CFP in 2015, 64.92 billion F.CFP in 2018 and 70.62 billion F.CFP in 2019 and 100.19 billion F.CFP in 2024.
- Spending fell sharply during the pandemic, dropping by 60.2% from 70.62 billion F.CFP in 2019 to 28.12 billion F.CFP in 2020.
- Spending declined slightly again to 26.84 billion F.CFP in 2021, before rebounding to 76.7 billion F.CFP in 2022.
- Tourist spending rose by 29.8% from 76.7 billion F.CFP in 2022 to 99.53 billion F.CFP in 2023.
- The 2024 total was 41.9% higher than 2019, calculated from the full official annual values.
- In 2023, North American tourists generated 50.6 billion F.CFP, while tourists from metropolitan France generated 26.8 billion F.CFP.
- Tourist spending in 2023 was nearly five times the value of French Polynesia’s local product exports.
Note: Tourist spending figures are for French Polynesia.
Which countries visit Bora Bora and French Polynesia the most?
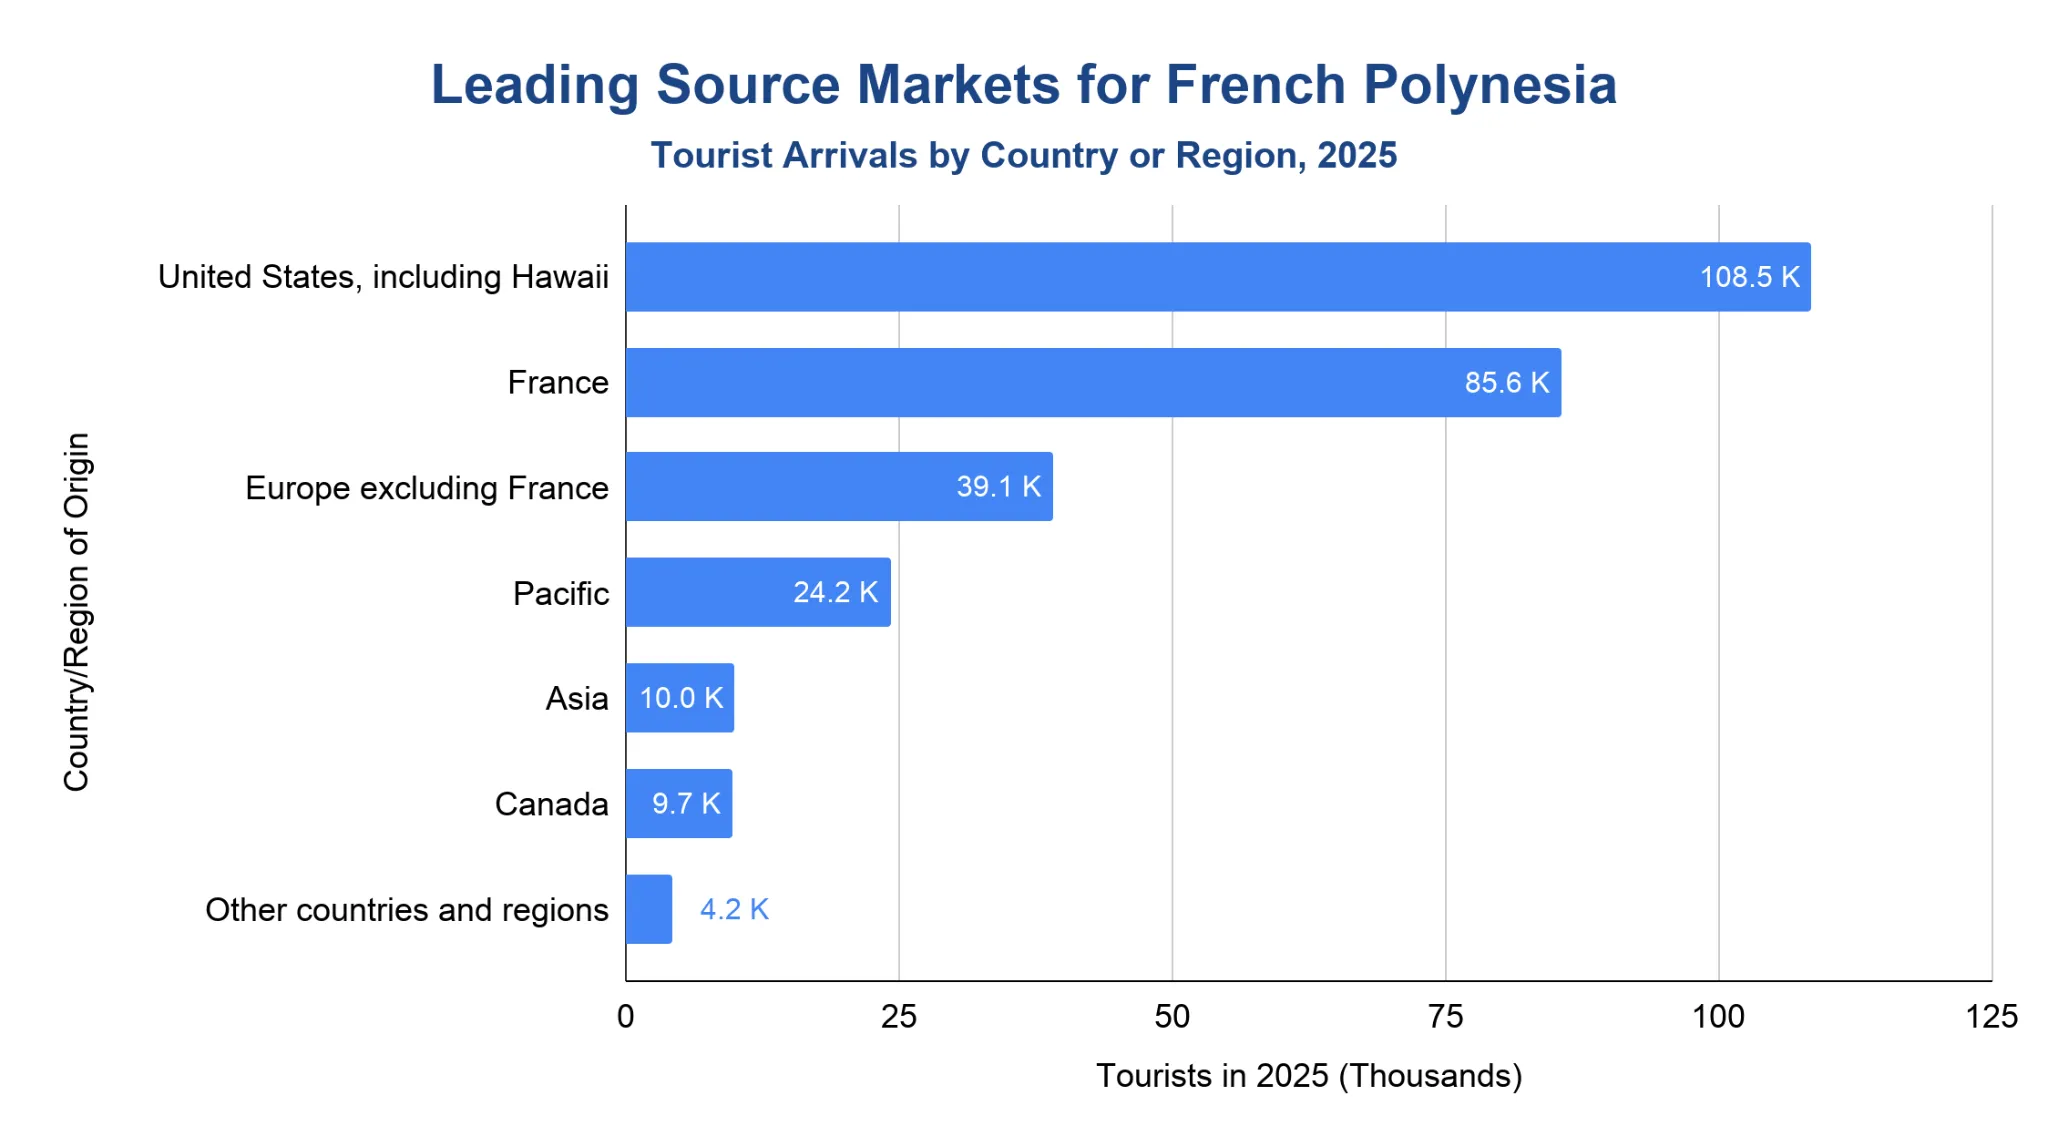
The United States, including Hawaii, was French Polynesia’s largest individual source market in 2025, with 108,500 tourists.
- The United States, including Hawaii, accounted for 108,500 tourists in 2025.
- France was the second-largest source market, with 85,600 tourists.
- Europe excluding France contributed 39,100 tourists.
- The Pacific region supplied 24,200 tourists, while Asia supplied 10,000 tourists.
- Canada contributed 9,700 tourists in 2025.
When is the most popular time to visit Bora Bora and French Polynesia?
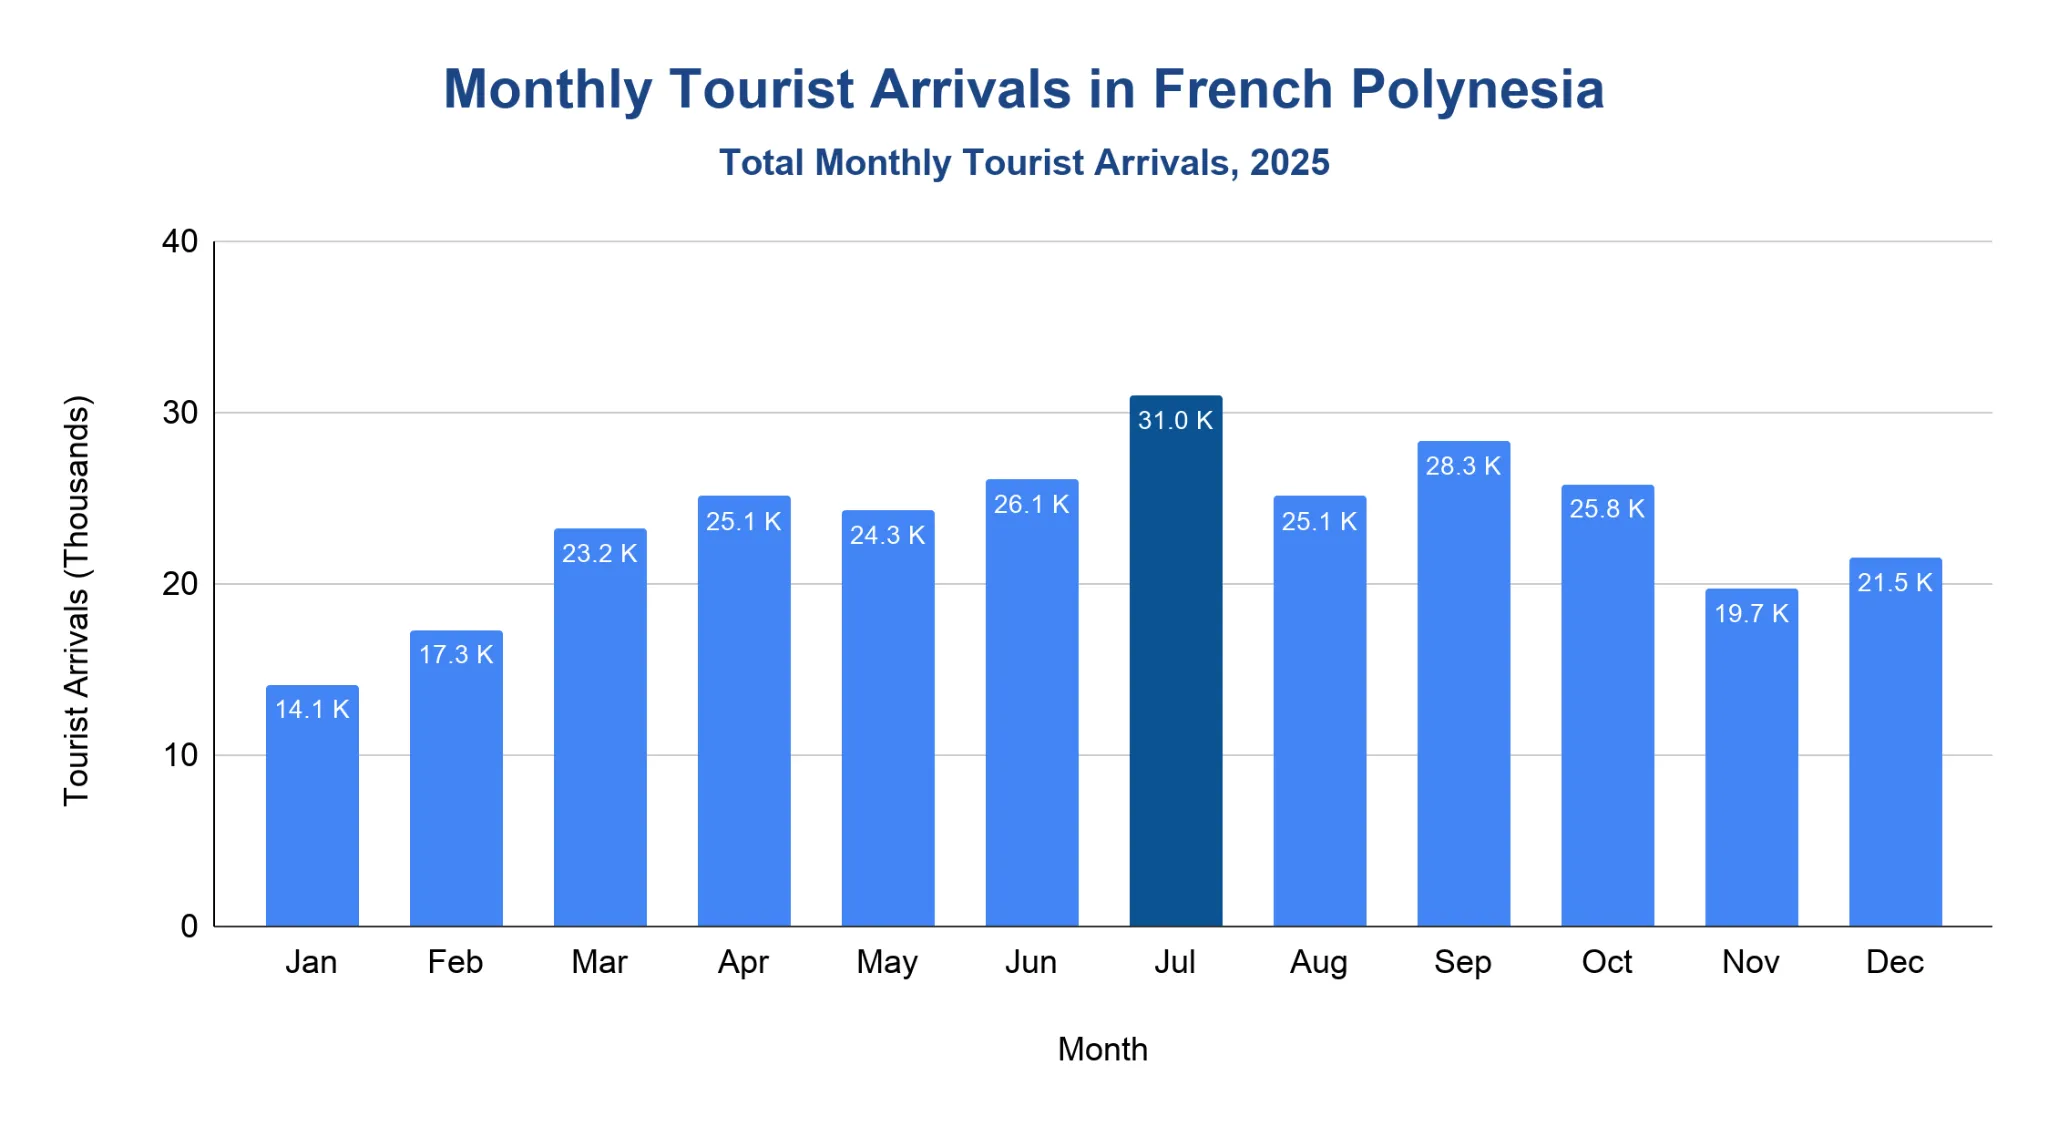
French Polynesia’s 2025 monthly data shows stronger tourist volumes in the middle of the year and September, with July 2025 recording 30,990 tourists.
- July 2025 recorded 30,990 tourists, the highest month of the year.
- September 2025 reached 28,274 tourists, up 20% from September 2024.
- June 2025 recorded 26,137 tourists.
- August 2025 recorded 25,076 tourists, up 7.5% year over year.
- January 2025 was lower, with 14,105 tourists.
Note: Monthly values are rounded to one decimal place in thousands.
Cruise tourism in Bora Bora and French Polynesia
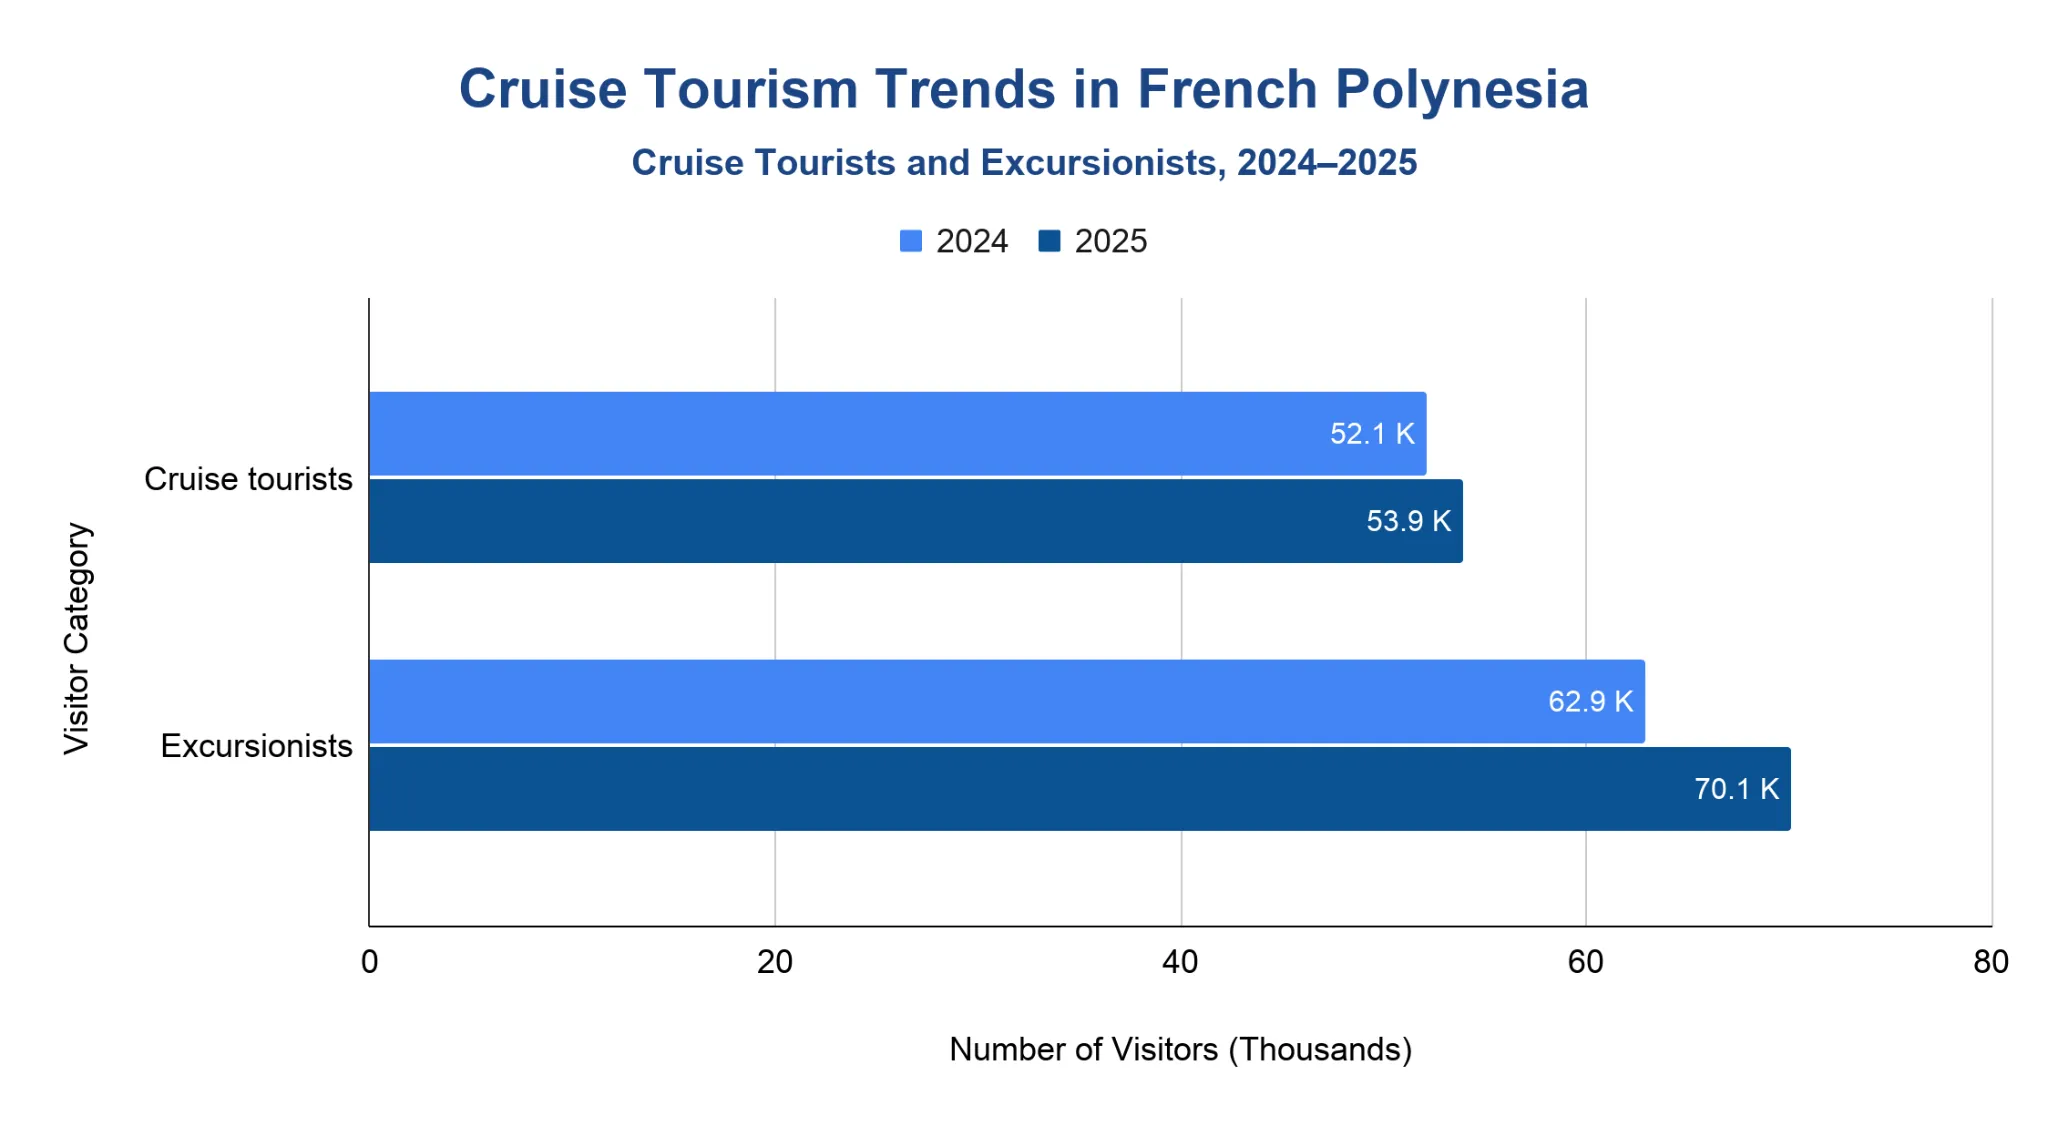
Cruise tourism remained an important part of French Polynesia’s visitor economy in 2025, with 53,941 cruise tourists and 70,062 excursionists.
- Cruise tourists increased from 52,111 in 2024 to 53,941 in 2025.
- Excursionists from transpacific cruise ships rose from 62,866 in 2024 to 70,062 in 2025.
- Cruise tourists represented 19.2% of all tourists in 2025.
- Total visitors, including excursionists, reached 351,289 in 2025.
Note: Cruise tourists are counted as tourists when they spend at least one night in French Polynesia in floating accommodation. Excursionists are visitors without an overnight stay in land-based accommodation or an intra-Polynesian cruise.
Tourist Accommodation and Length of Stay in French Polynesia
French Polynesia recorded 4.6 million tourist nights in 2025, with an average stay of 16.5 days.
- Land-based accommodation accounted for 227,286 tourists in 2025.
- Floating accommodation, including cruises, accounted for 53,941 tourists in 2025.
- Paid accommodation was used by 251,446 tourists in 2025, while 29,781 tourists used non-paid accommodation.
- International hotels recorded a 67.6% room occupancy rate in 2024.
- Average room revenue was 71,910 F.CFP per rented room in 2024.
Related Travel Statistics
- Disneyland Paris Tourism Statistics
- Eiffel Tower Tourism Statistics
- France Tourism Statistics
- French Polynesia Tourism Statistics
- Louvre Museum Tourism Statistics
- New Caledonia Tourism Statistics
- Notre Dame Cathedral Tourism Statistics
- Paris Tourism Statistics
Tourism Employment in French Polynesia
Tourism supported 14,022 direct jobs in June 2025, equal to 18.5% of jobs in French Polynesia.
- Tourism remains one of French Polynesia’s most important employment sectors.
- Direct tourism employment reached 14,022 jobs in June 2025.
- Tourism accounted for 18.5% of jobs in French Polynesia in 2025.
Why do people visit Bora Bora?
Bora Bora’s appeal is built around its lagoon, volcanic scenery, luxury accommodation and marine activities.
- The lagoon is central to Bora Bora’s image, with swimming, snorkeling, diving and boat excursions among the island’s major visitor activities.
- Overwater bungalows are a signature accommodation style associated with Bora Bora and the wider Islands of Tahiti.
- Mount Otemanu rises 727 meters and is the highest peak on Bora Bora.
- Matira Beach is one of the island’s best-known beach areas.
- Lagoon tours, snorkeling, diving and cultural experiences help connect visitors with Bora Bora’s natural and Polynesian setting.
References
- ISPF Tourism Statistics and Annual Tourism Reports (2014–2025) · ispf.pf
- Tourism Dashboard Data for Arrivals and Economic Impact (2013–2025) · plantourismedurablepf.org
- Tourist Spending in French Polynesia (2023) · ispf.pf
- Tahiti Tourism Key Statistics and Market Data (2024–2025) · tahititourisme.org
- Bora Bora Attractions and Visitor Activities · tahititourisme.com
- Mount Otemanu Visitor Information · tahititourisme.pf

