

 Popular Countries
 24/7 Support
Published
Cape Town is a globally recognised destination, attracting millions of visitors each year and playing a crucial role in the local economy.
How many people visit Cape Town each year?
Around 2.4 million tourists visit Cape Town each year, making it one of Africa’s most visited cities.1
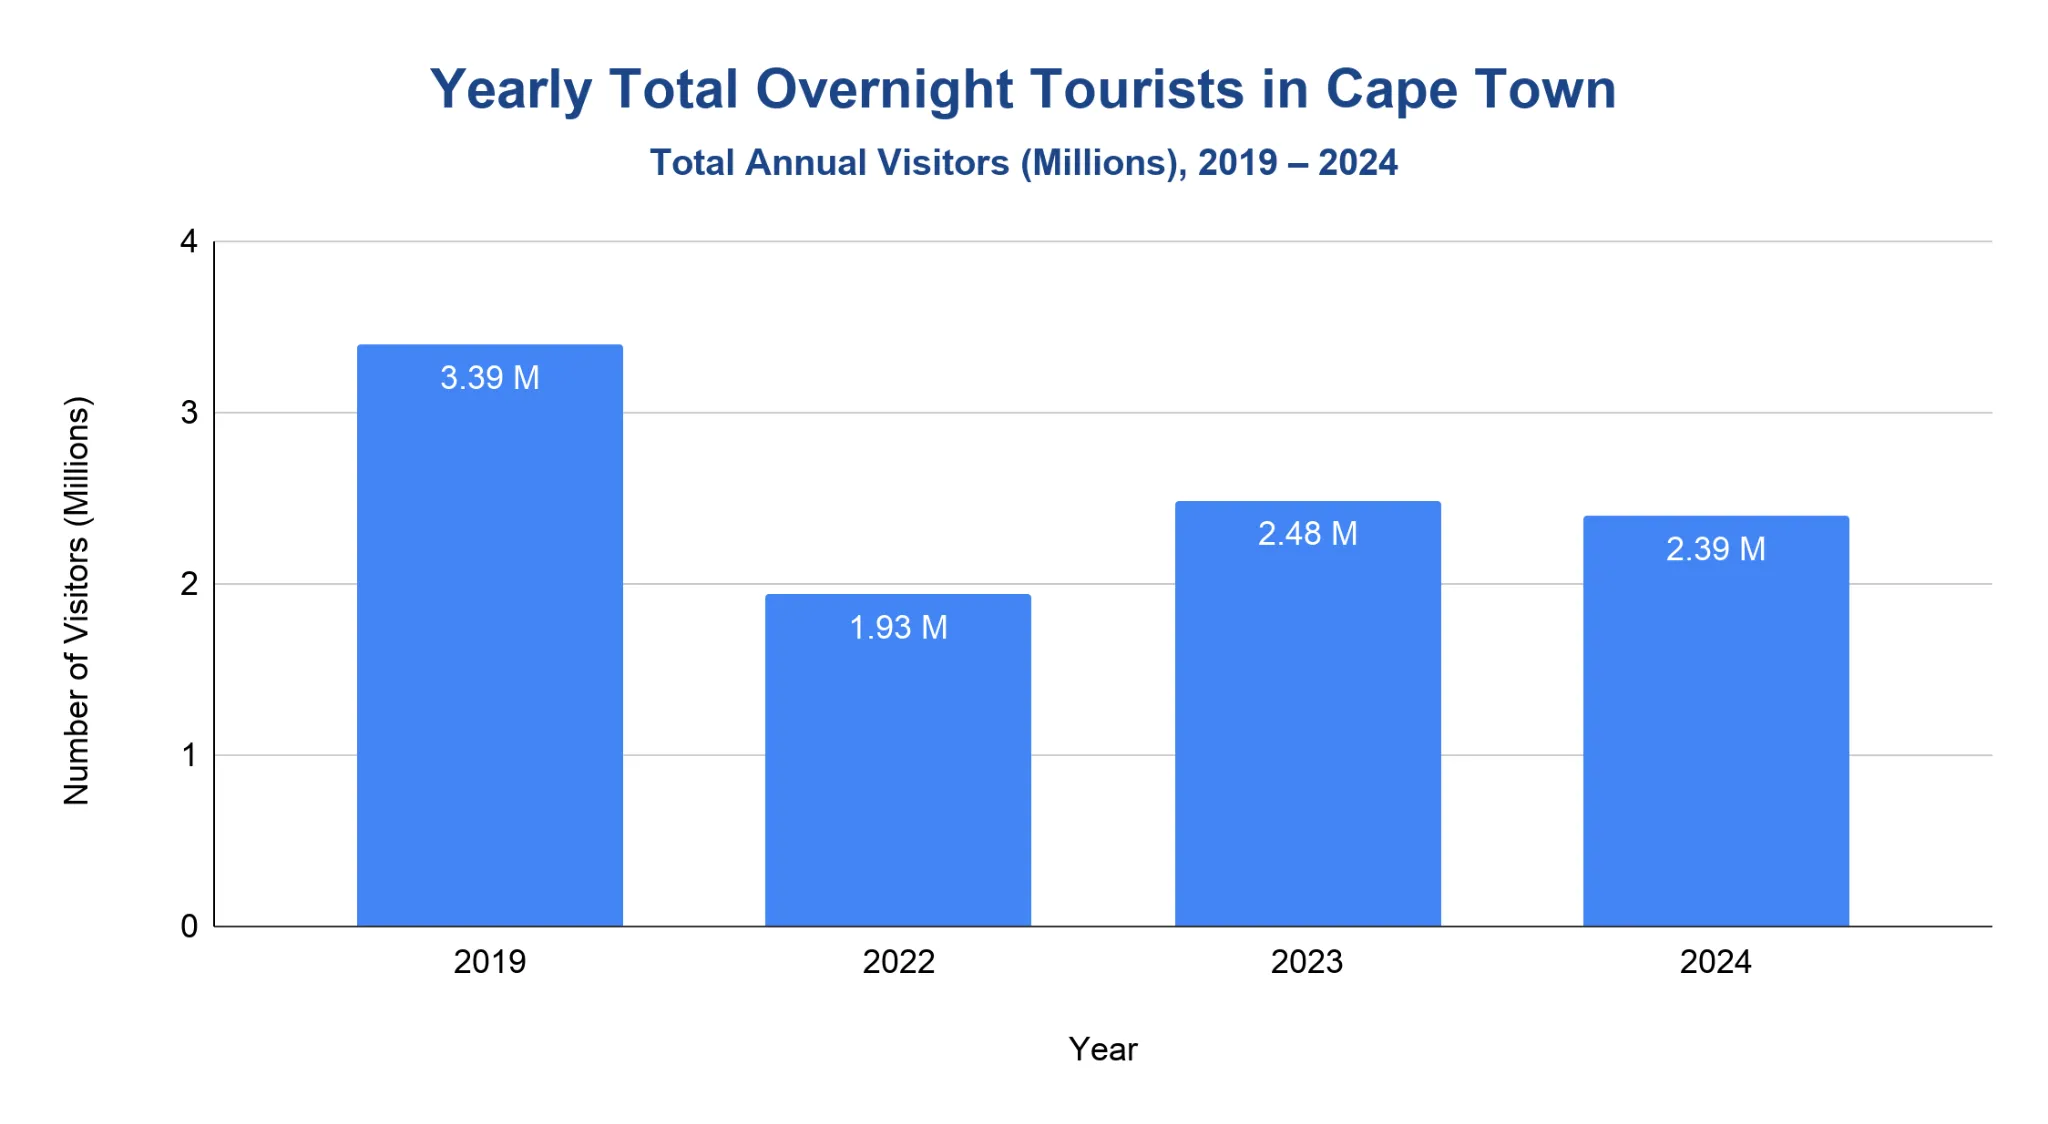
- Approximately 3.39 million overnight tourists visited Cape Town in 2019, including 1.94 million international visitors (57.2%) and 1.45 million domestic tourists (42.8%).2
- Overnight tourists in 2022 totalled 1.93 million, reflecting a 43.1% decline from 2019 due to ongoing pandemic recovery.3
- Total overnight tourists in 2023 reached 2.48 million visitors, approaching pre-pandemic levels based on official figures.4
- By 2024, Cape Town welcomed 2.39 million overnight tourists, compared with 2.48 million in 2023 (-3.6%).1
How many people visited Cape Town in 2024?
How much do visitors spend in Cape Town each year?
Tourism is a major economic driver for Cape Town, generating billions in revenue annually.
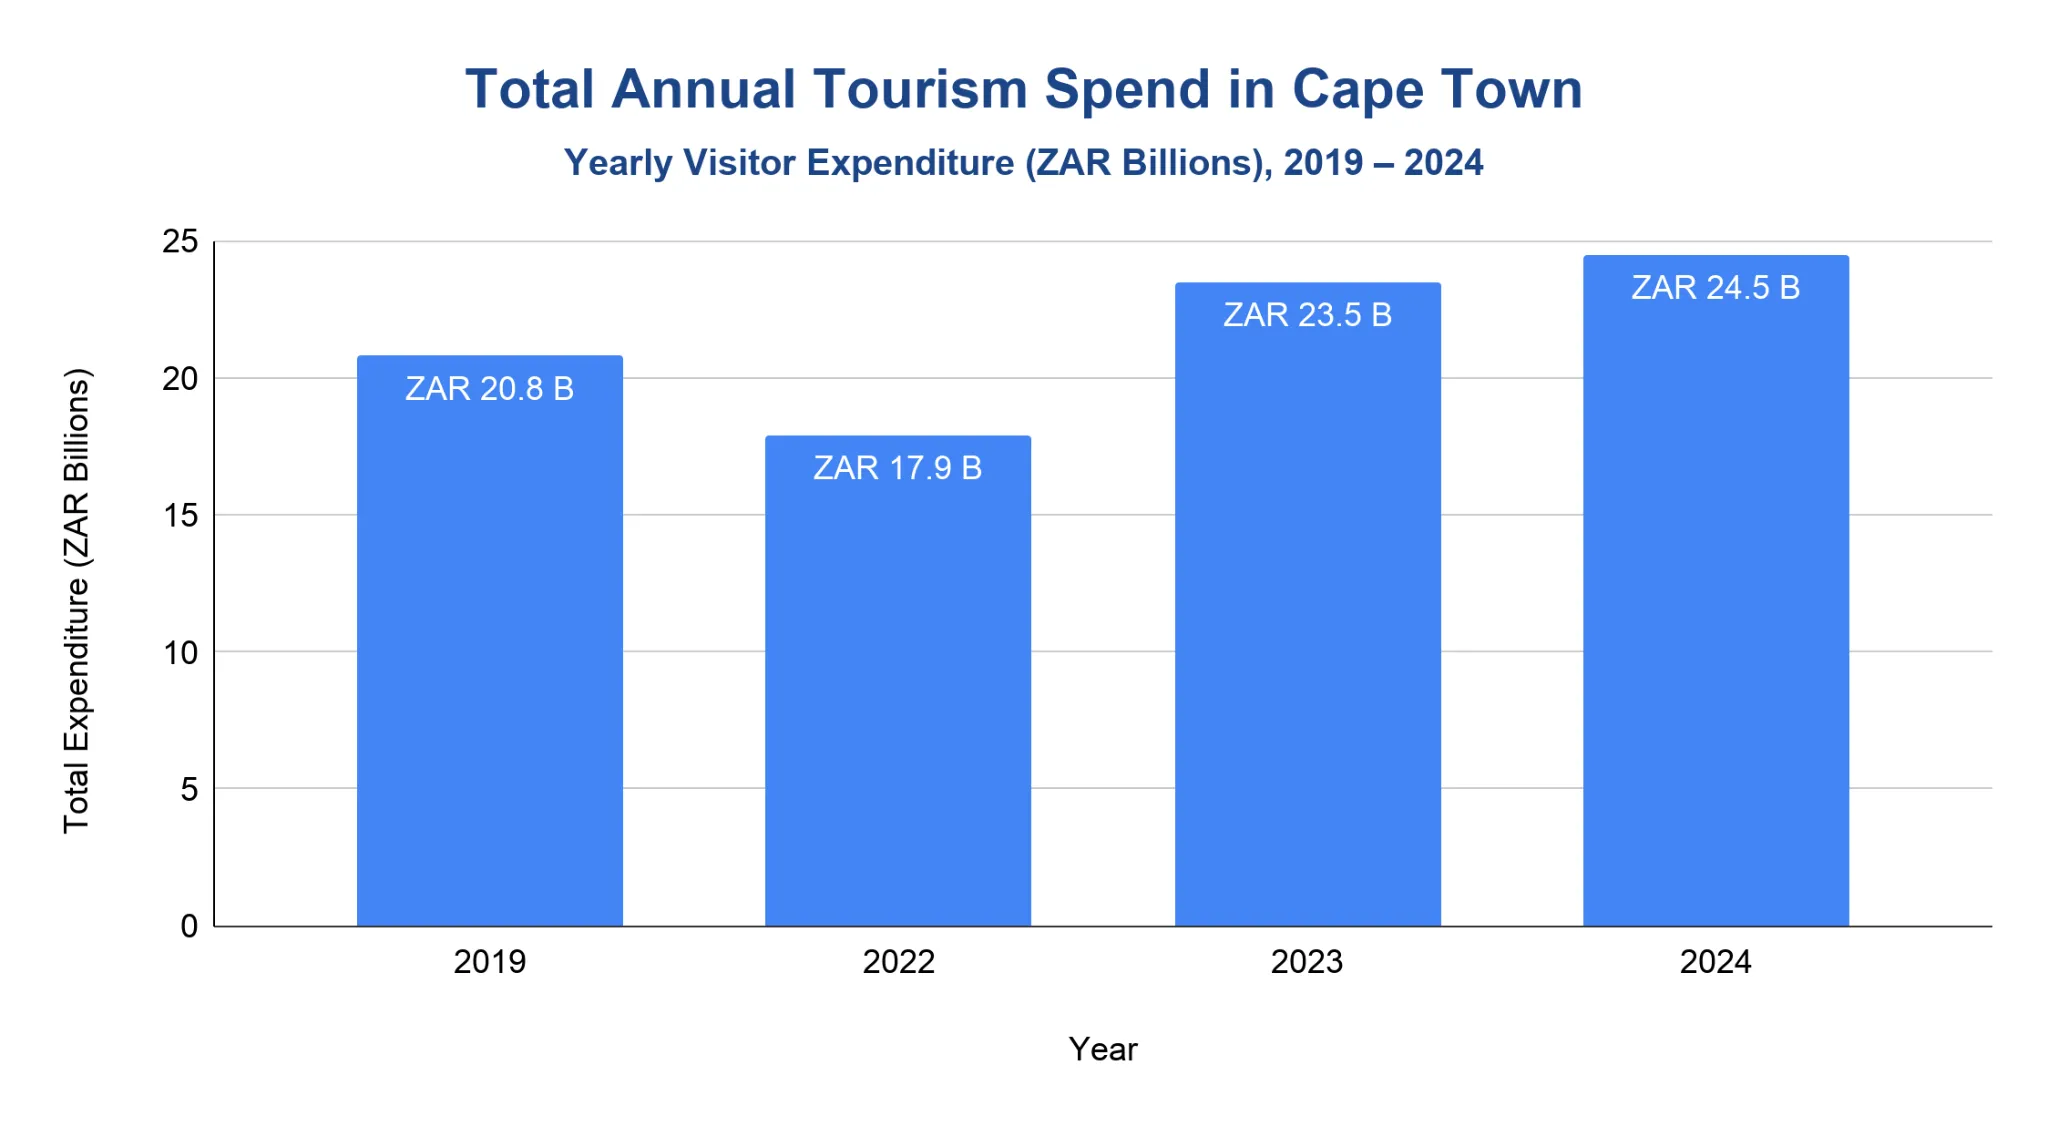
- Total visitor spending reached ZAR 20.8 billion in 2019, with international tourists contributing ZAR 17.5 billion and domestic tourists ZAR 3.3 billion.5
- Spending rebounded to ZAR 17.9 billion in 2022, showing a 220% recovery from pandemic lows.5
- Tourist spending was ZAR 23.5 billion in 2023, reflecting increased visitor numbers and higher average expenditure per trip.5
- International tourists spent an average of ZAR 14,800 per trip or ZAR 1,243 per day in 2022, compared to ZAR 9,000 per trip or ZAR 942 per day in 2019.5
- Domestic tourists spent an average of ZAR 5,080 per trip in 2022, more than double the ZAR 2,280 per trip recorded in 2019.5
- By 2024, visitor spending in Cape Town reached ZAR 24.5 billion, compared with ZAR 23.5 billion in 2023 (+4.3%).5
Which countries visit Cape Town the most?
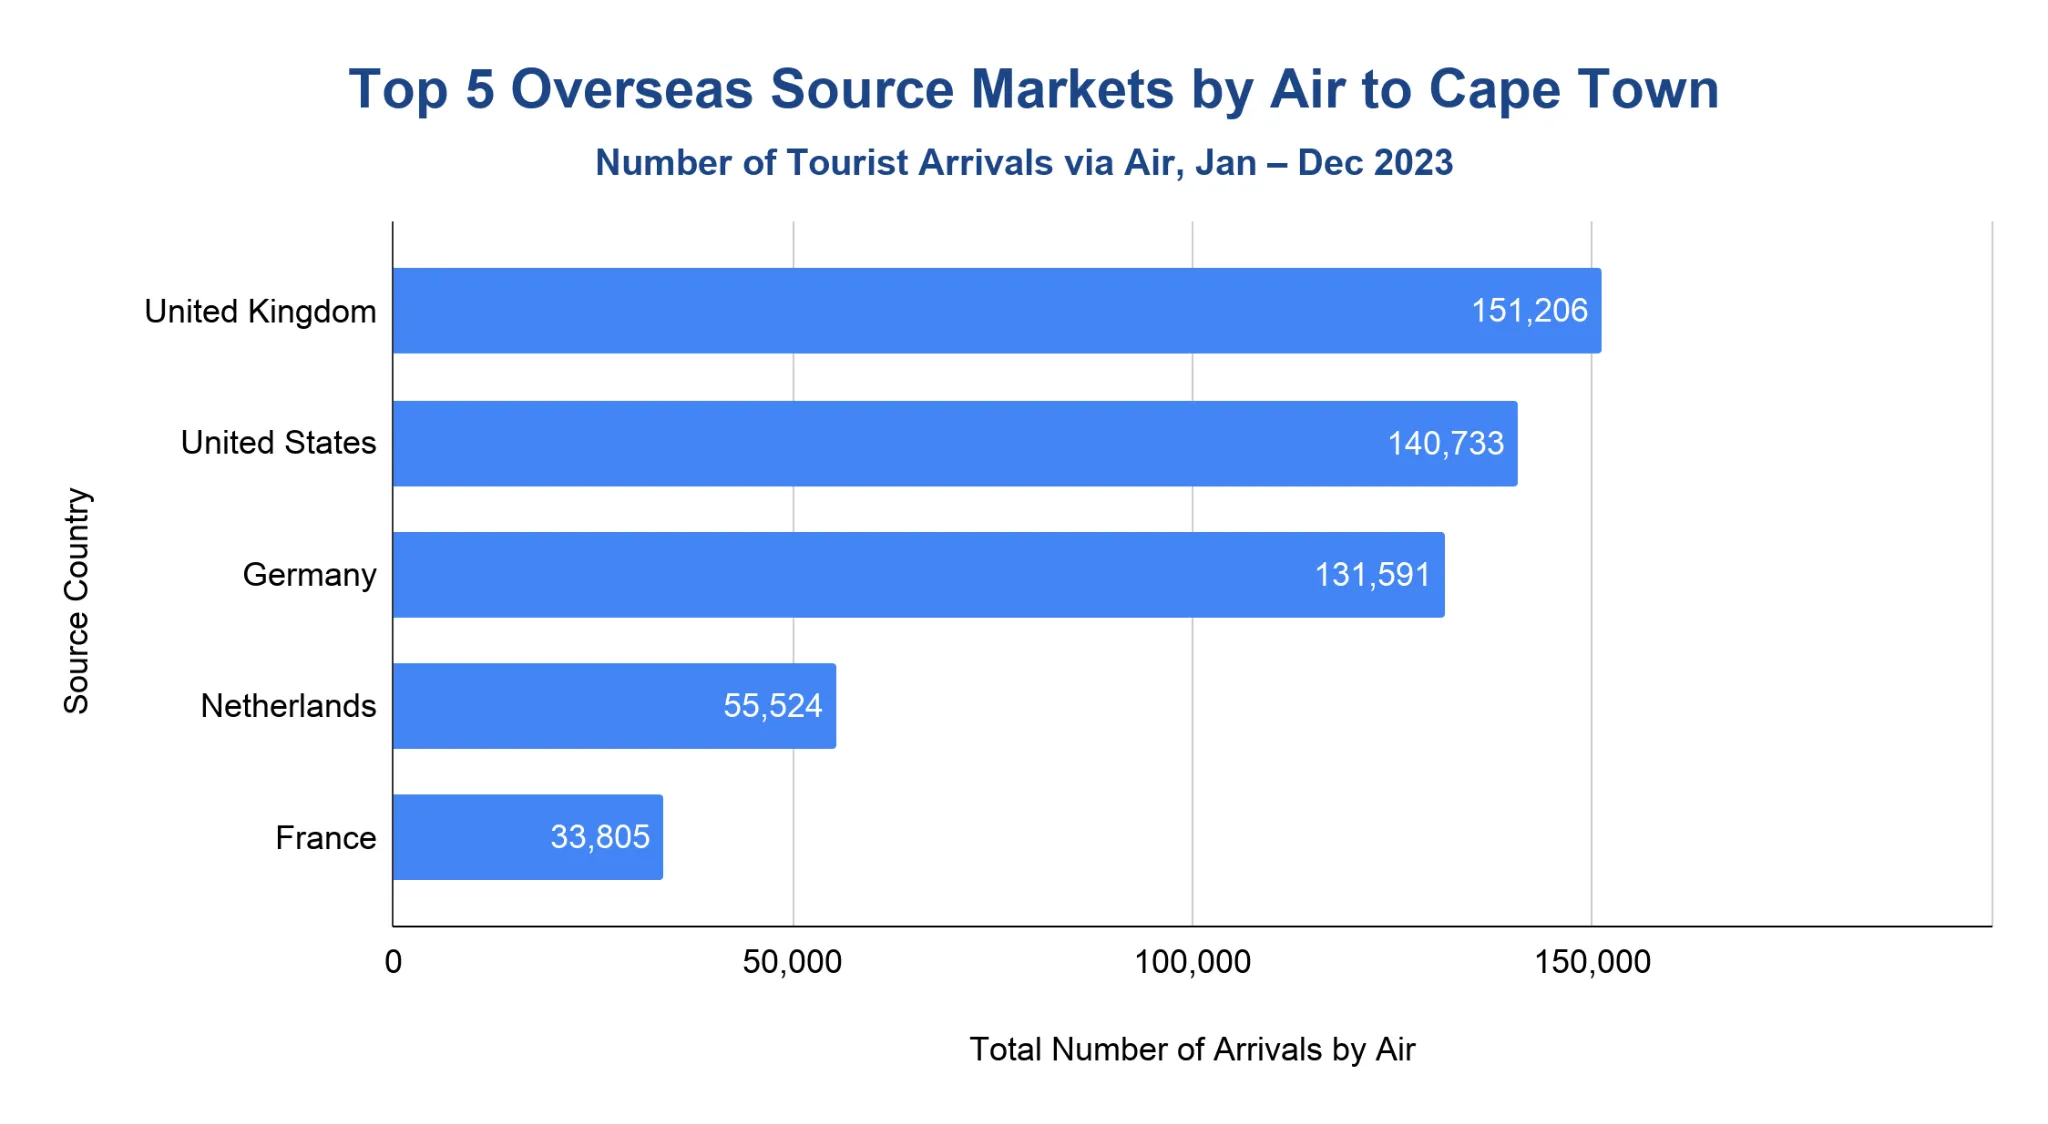
The United Kingdom consistently ranks as Cape Town’s largest overseas source market, contributing approximately 19% of overseas tourist arrivals via air in 2023.6
- The United States accounted for approximately 17% of overseas tourist arrivals, followed by Germany, which made up approximately 16% of overseas tourist arrivals.6
- The Netherlands and France complete the top five, with approximately 7% and 4% of visitors, respectively.6
- The United Kingdom led with 151,206 tourist arrivals via air in 2023, ahead of the United States (140,733) and Germany (131,591).6
Note: The figures above use Cape Town’s 2023 tourist arrivals via air*, with 816,500 overseas tourist arrivals as the denominator for the percentage shares.*
Cape Town Tourism Statistics: International vs. Domestic Visitors
Cape Town sees a mix of domestic and international tourism, with the balance shifting post-pandemic.
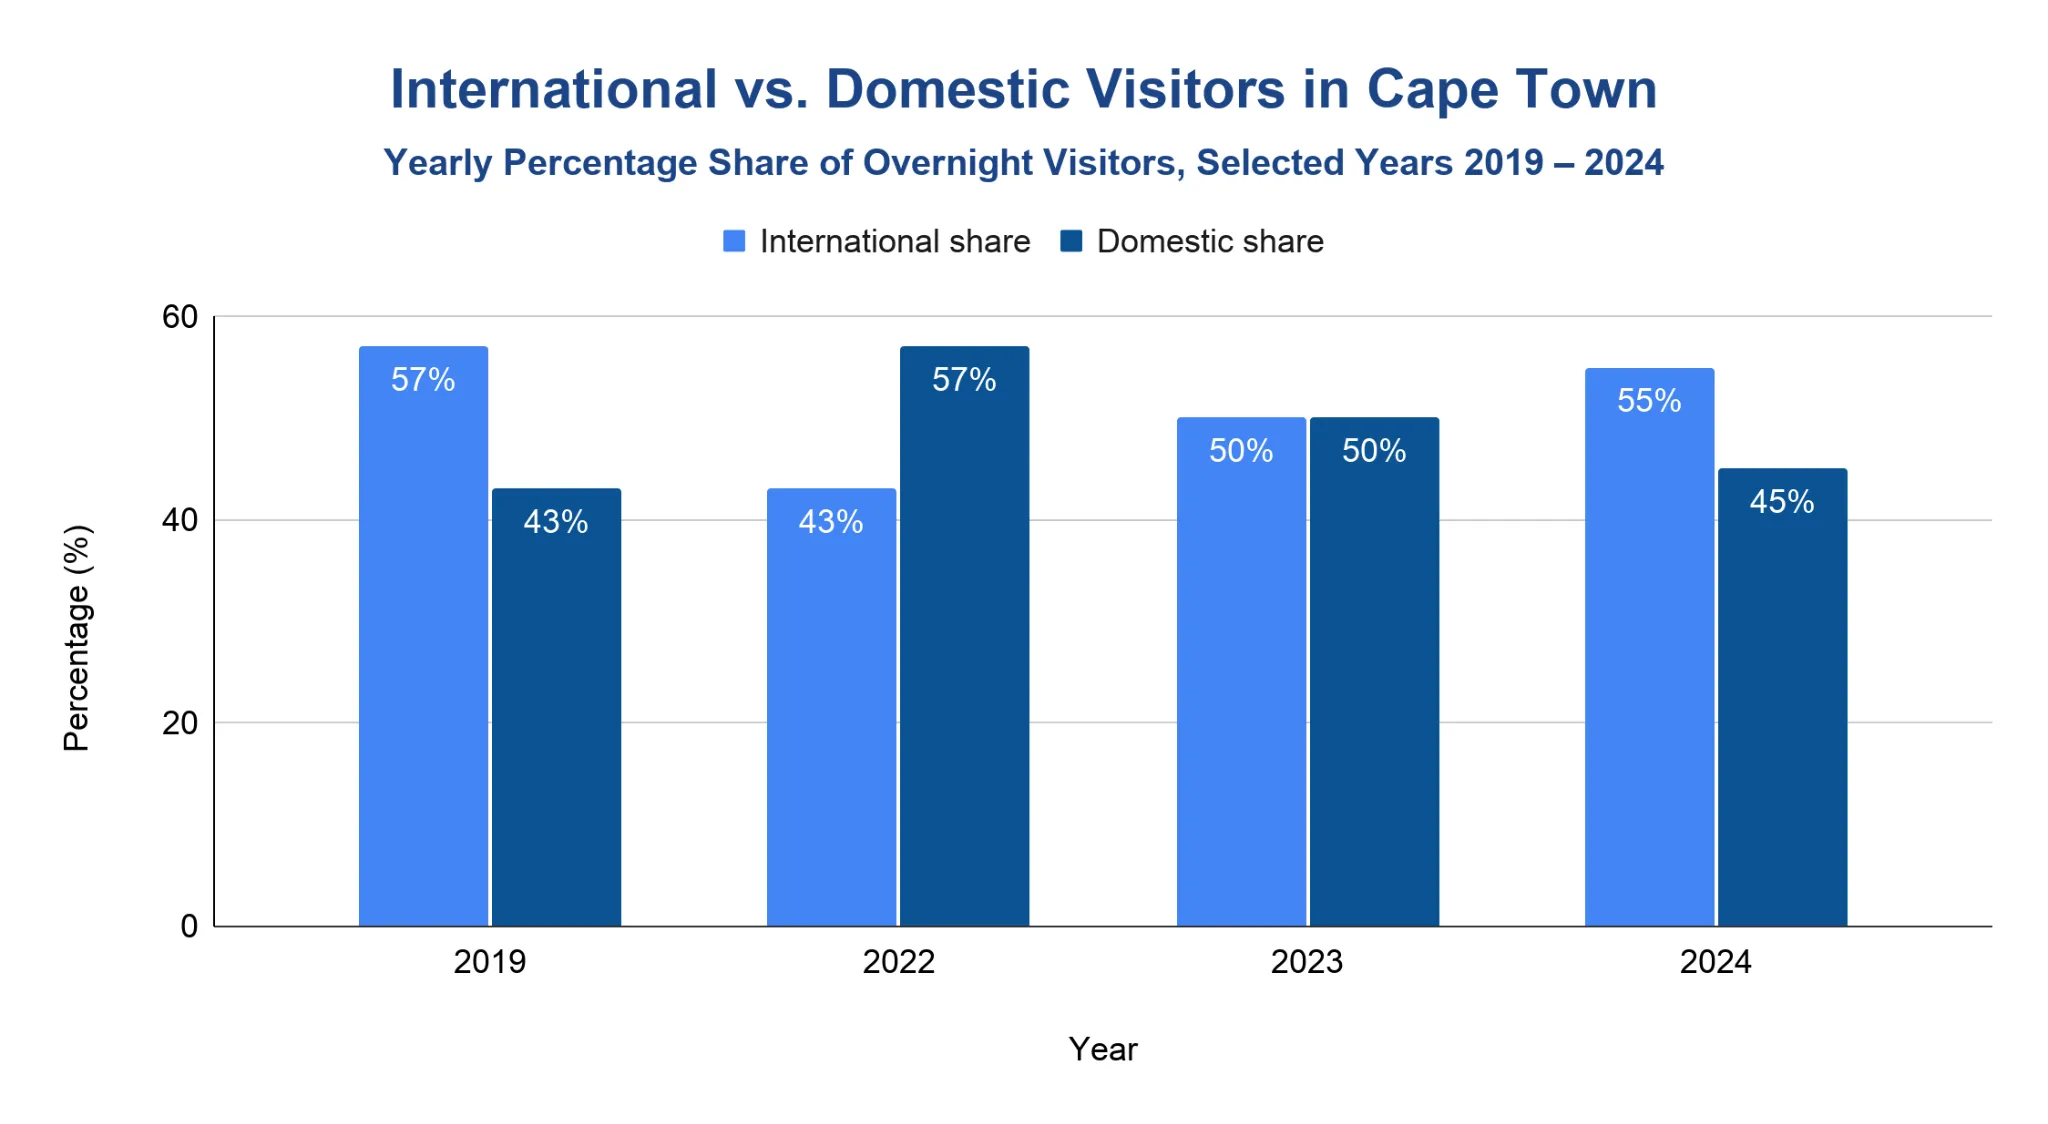
- The proportion of international visitors was 57.2%, while domestic visitors comprised 42.8% in 2019.2
- In 2022, the split reversed, with 43% international and 57% domestic visitors due to slow international recovery.3
- By 2024, the balance had shifted to 55% international and 45% domestic visitors, compared with 50% international and 50% domestic visitors in 2023.1
When is the best time to visit Cape Town?
Cape Town experiences peak tourism in the summer months, specifically December and January, with 160,537 international arrivals in December 2024.1
- April and September represent shoulder seasons, offering moderate tourist numbers and favourable weather conditions.
- June to August is the low season due to winter weather, although overnight stays remain relatively steady through the year.
- The latest airport signal shows that December remained a peak month, with international arrivals rising 11% year on year (YoY) in December 2025.
How popular is Cape Town as a tourist destination?
Cape Town remains one of the continent’s most decorated urban destinations, with the city recognised as Africa’s Leading City Destination in 2025 by the World Travel Awards.7
Why do people visit Cape Town?
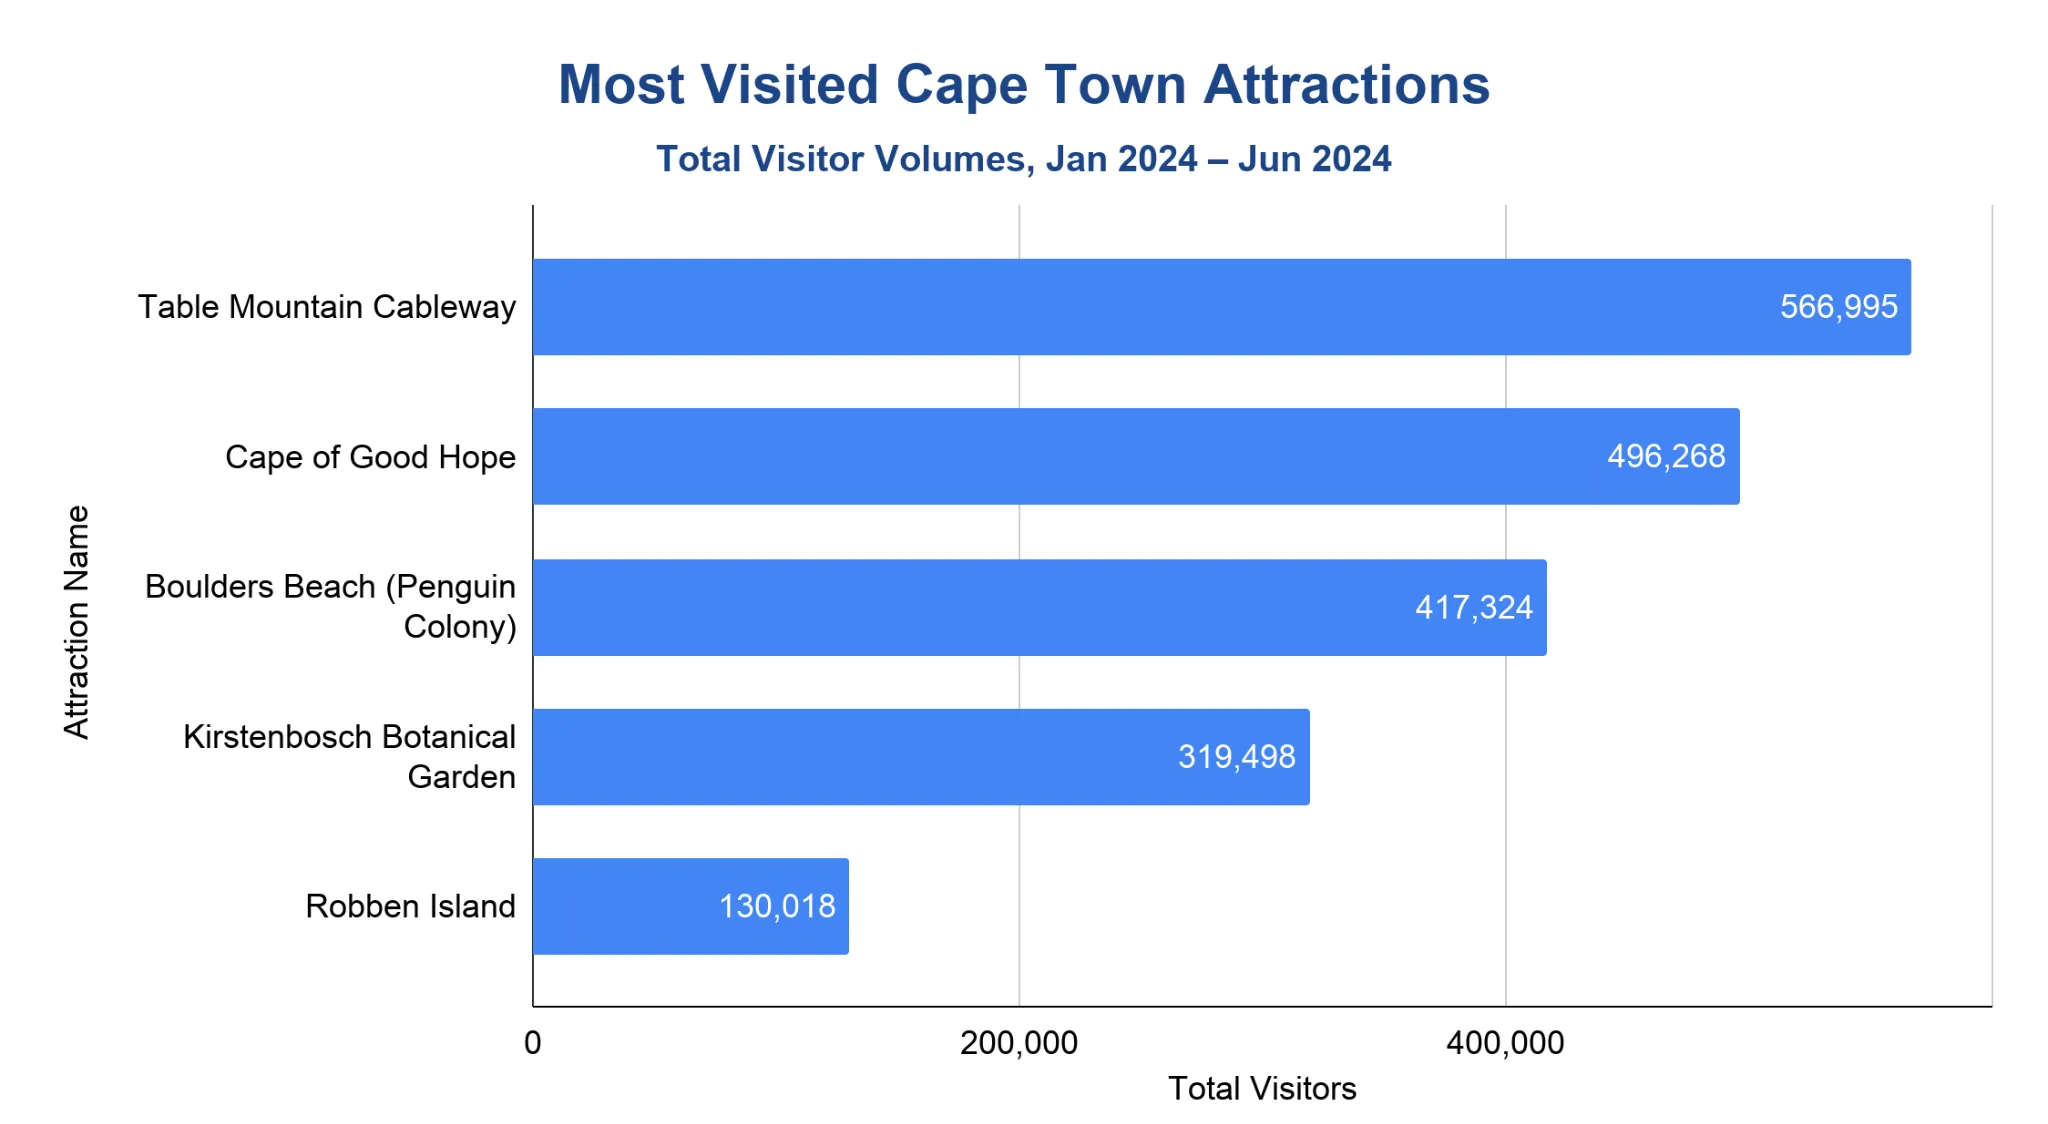
Visitors are drawn to Cape Town’s mix of iconic nature, wildlife, botanical and heritage attractions. From January to June 2024, the city’s leading attractions recorded strong visitor volumes.
- Table Mountain Cableway welcomed 566,995 visitors.10
- Cape of Good Hope recorded 496,268 visitors.10
- Boulders Beach (Penguin Colony) saw 417,324 visitors.10
- Kirstenbosch Botanical Garden had 319,498 visitors.10
- Robben Island was visited by 130,018 people.10
- Across these five tracked attractions, visits reached 1,930,103 in the first half of 2024, compared with 1,636,916 in 2023 (+17.9%).10
- Separately, the V&A Waterfront attracts approximately 24 million visits per year, making it one of Africa’s most visited destinations.11
Outbound Tourism: How many Capetonians travel abroad?
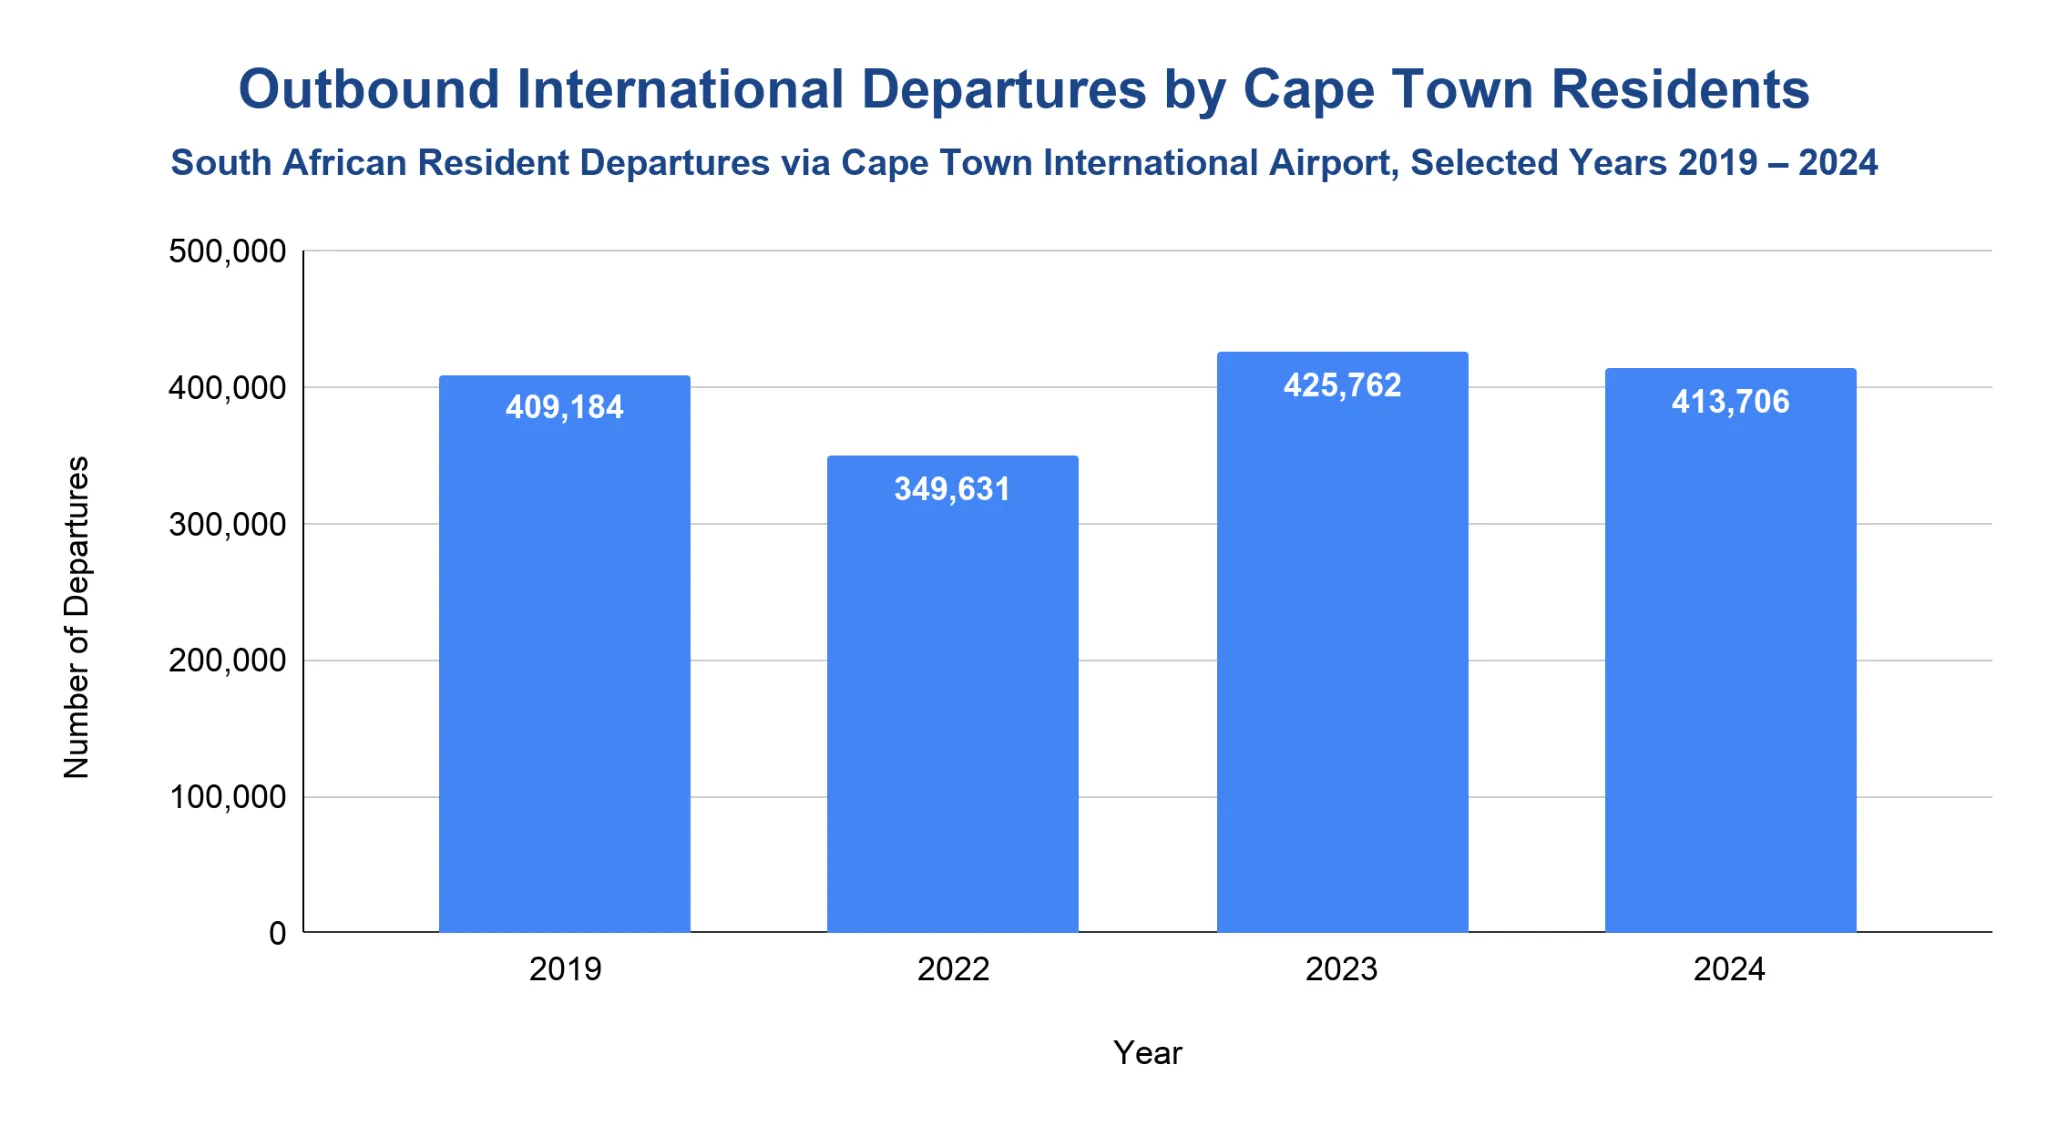
Many Cape Town residents travel internationally, particularly during peak holiday seasons, although official statistics measure South African residents departing through Cape Town International Airport.
- Approximately 409,184 South African resident international departures were recorded via Cape Town International Airport in 2019.2
- In 2022, 349,631 South African residents departed internationally from Cape Town.3
- Outbound travel exceeded pre-pandemic levels, with 425,762 international departures in 2023.4
- By 2024, Cape Town International Airport recorded 413,706 South African resident departures, compared with 425,762 in 2023 (-2.8%).1
Other Key Facts
- Tourism contributes about 6.1% of Cape Town’s Gross Value Added (GVA).5
- A total of 106,706 jobs are supported directly by the tourism industry.5
- Cape Town hotels had an average 67.5% occupancy rate in Q4 2024, compared with 74.2% in Q4 2023.12
- Cape Town and the Western Cape’s 2024/25 cruise season welcomed 127,000 passengers and contributed ZAR 1.79 billion to the regional economy.13
- Cruise economic impact increased to ZAR 1.79 billion in 2024/25, compared with ZAR 1.32 billion in 2023/24 (+35.6%).13
References
- Tourism and migration annual reports (2024) · statssa.gov.za ↑ b c d e f g h
- Tourism and migration annual reports (2019) · statssa.gov.za ↑ b c
- Tourism and migration annual reports (2022) · statssa.gov.za ↑ b c
- Tourism and migration annual reports (2023) · statssa.gov.za ↑ b
- Economic value of tourism in Cape Town (2014–2024) · research.capetown.travel ↑ b c d e f g h
- Overseas source markets and air arrivals (2023) · wesgro.co.za ↑ b c d
- Destination award (2025) · worldtravelawards.com ↑
- Telegraph Travel award coverage (2025) · capetown.travel ↑
- Time Out city ranking (2024–2026) · timeout.com ↑
- Visitor trends and attraction visits (Jan–Jun 2024) · wesgro.co.za ↑ b c d e f
- Annual visitor volumes · waterfront.co.za ↑
- Accommodation performance and forecast (Q4 2023 – Q4 2024) · research.capetown.travel ↑
- Cruise passenger and economic impact update (2024/25) · wesgro.co.za ↑ b

