Published Oct 11, 2024 · Updated Jul 23, 2026
The global automotive industry is constantly evolving, driven by technological advancements, consumer demands, and economic factors.
Below we explore the latest automotive market trends and statistics, insights into global car sales, key market players and emerging consumer preferences.
How many cars were sold worldwide in 2024?
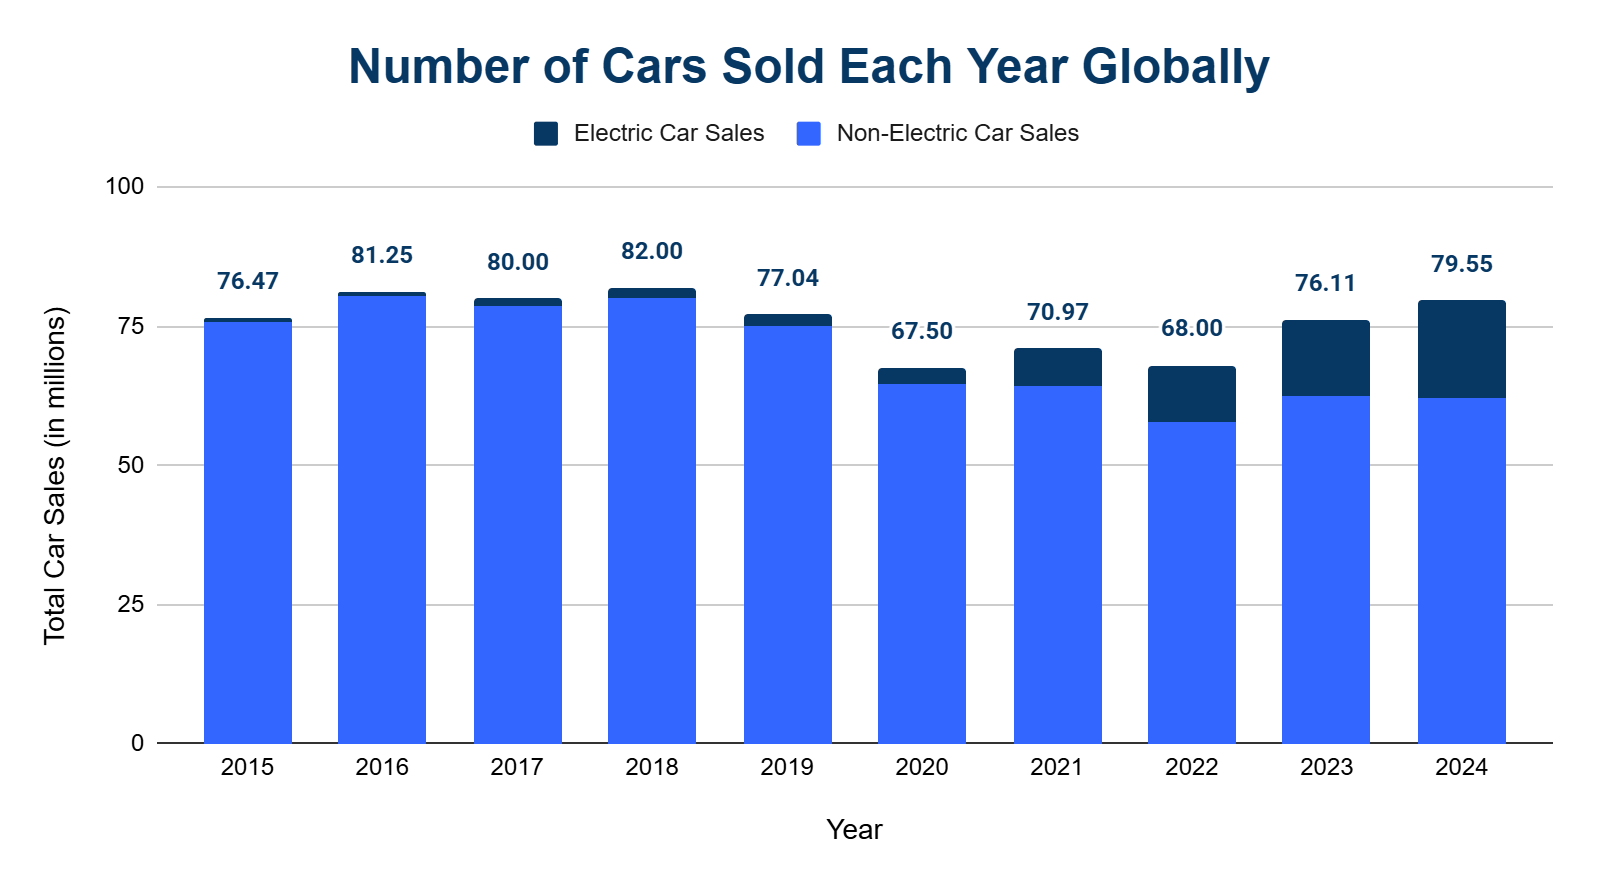
Over 79.55 million total cars were sold globally in 2024, including both electric and non-electric vehicles.
- This represented an approximate growth of 4.5% compared to 2023 when 76.11 million passenger cars were sold.
- Despite this rebound, global car sales in 2024 were still 3% lower than the peak year of 2018, when 82 million vehicles were sold.
How much of the global car market is made up of EVs?
Electric Vehicle (EV) Sales accounted for about 22% of all new car sales globally in 2024, up from around 2.7% in 2019.
- Over 17.5 million EVs were sold worldwide in 2024, an increase from 13.7 million in 2023.
| Annual Global Car Sales (2010-2024) | ||||
|---|---|---|---|---|
| Year | Electric Cars Sold | Non-Electric Cars Sold | Total Cars Sold | % of EV Sales |
| 2010 | 7,450 | 62,075,883 | 62,083,333 | 0.01% |
| 2011 | 49,000 | 67,074,288 | 67,123,288 | 0.07% |
| 2012 | 118,000 | 65,437,556 | 65,555,556 | 0.18% |
| 2013 | 201,000 | 69,109,345 | 69,310,345 | 0.29% |
| 2014 | 330,000 | 74,670,000 | 75,000,000 | 0.44% |
| 2015 | 520,000 | 75,950,588 | 76,470,588 | 0.68% |
| 2016 | 780,000 | 80,470,000 | 81,250,000 | 0.96% |
| 2017 | 1,200,000 | 78,800,000 | 80,000,000 | 1.50% |
| 2018 | 2,050,000 | 79,950,000 | 82,000,000 | 2.50% |
| 2019 | 2,080,000 | 74,957,037 | 77,037,037 | 2.70% |
| 2020 | 2,970,000 | 64,530,000 | 67,500,000 | 4.40% |
| 2021 | 6,600,000 | 64,367,742 | 70,967,742 | 9.30% |
| 2022 | 10,200,000 | 57,800,000 | 68,000,000 | 15.00% |
| 2023 | 13,700,000 | 62,411,111 | 76,111,111 | 18.00% |
| 2024 | 17,500,000 | 62,045,455 | 79,545,455 | 22.00% |
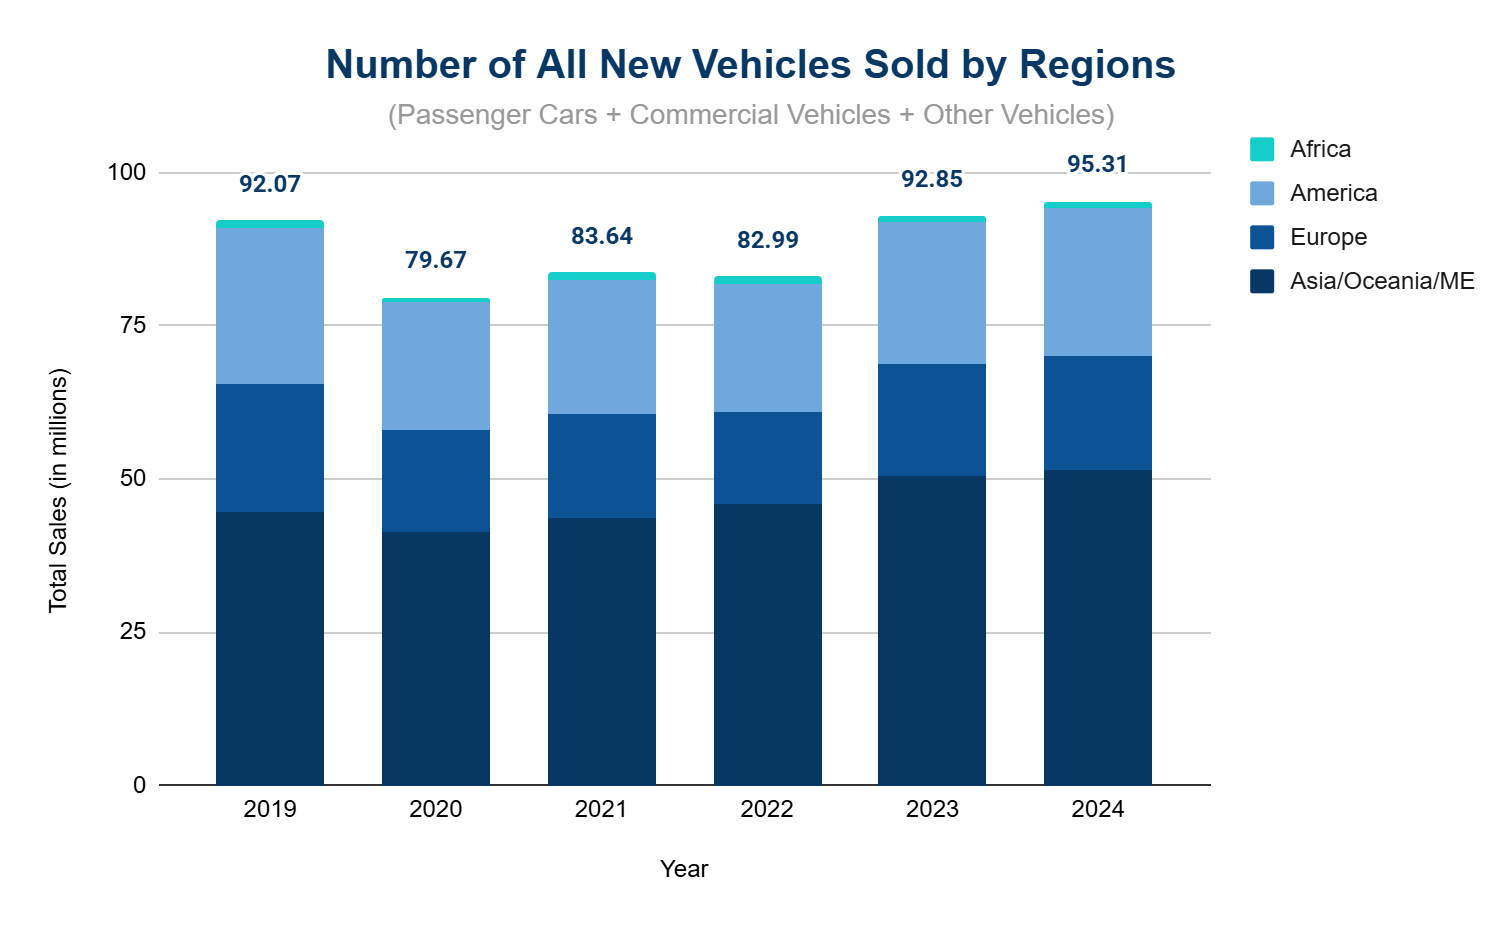
Regional Breakdown of Global Car Sales
- America: In 2024, total car sales in the Americas reached 24.15 million units. The U.S. was the largest car market in the region, contributing over 16.34 million units. Canada followed with 1.91 million car sales, and Mexico recorded 1.56 million units.
- Europe: The car market remained stable in Europe, with Germany, France, and the United Kingdom accounting for the majority of sales. The total number of car sales in Europe reached nearly 18.7 million units in 2024, with electric vehicles (EVs) capturing an increasingly larger market share.
- Asia/ Oceania/ Middle East: China retained its position as the world's largest car market in the Asia-Pacific region, with sales exceeding 31.44 million units in 2024. Other key contributors included India (5.23 million car sales), Japan (4.42 million car sales) and South Korea (1.63 million car sales).
- Africa: Though smaller in comparison to other regions, this area saw total car sales of approximately 1.05 million units in 2024.
| Annual Global Car Sales by Leading Countries (2019-2024) | ||||||
|---|---|---|---|---|---|---|
| Country | 2019 | 2020 | 2021 | 2022 | 2023 | 2024 |
| China | 25,796,931 | 25,311,069 | 26,314,263 | 26,863,745 | 30,093,698 | 31,436,193 |
| The United States | 17,488,154 | 14,881,356 | 15,408,565 | 14,230,324 | 16,009,268 | 16,340,472 |
| India | 3,816,858 | 2,938,575 | 3,759,398 | 4,725,840 | 5,080,361 | 5,226,784 |
| Japan | 5,195,216 | 4,598,615 | 4,448,340 | 4,201,320 | 4,779,086 | 4,421,494 |
| Germany | 4,017,059 | 3,266,759 | 2,973,319 | 2,963,748 | 3,204,298 | 3,192,031 |
| Brazil | 2,787,850 | 2,058,437 | 2,119,851 | 2,104,461 | 2,308,689 | 2,634,904 |
| United Kingdom | 2,736,559 | 1,964,660 | 2,049,005 | 1,943,572 | 2,307,438 | 2,368,574 |
| France | 2,755,728 | 2,100,030 | 2,142,284 | 1,926,554 | 2,208,501 | 2,155,052 |
| Canada | 1,976,440 | 1,586,474 | 1,704,850 | 1,562,965 | 1,762,238 | 1,906,866 |
| Russia | 1,778,841 | 1,631,163 | 1,741,965 | 808,604 | 1,317,438 | 1,833,852 |
| Italy | 2,132,630 | 1,564,756 | 1,669,855 | 1,505,052 | 1,797,977 | 1,793,038 |
| South Korea | 1,795,134 | 1,905,972 | 1,734,581 | 1,683,657 | 1,749,729 | 1,632,751 |
| Mexico | 1,360,008 | 977,650 | 1,046,732 | 1,134,443 | 1,416,429 | 1,555,115 |
| Turkey | 491,947 | 796,150 | 772,850 | 831,220 | 1,284,046 | 1,285,789 |
| Australia | 1,062,867 | 916,968 | 1,049,831 | 1,081,429 | 1,218,450 | 1,222,785 |
Which country had the highest car sales in 2024?
China had the highest car sales in 2024, leading the global market with over 31.44 million units sold, an increase of 4.4% from 2023.
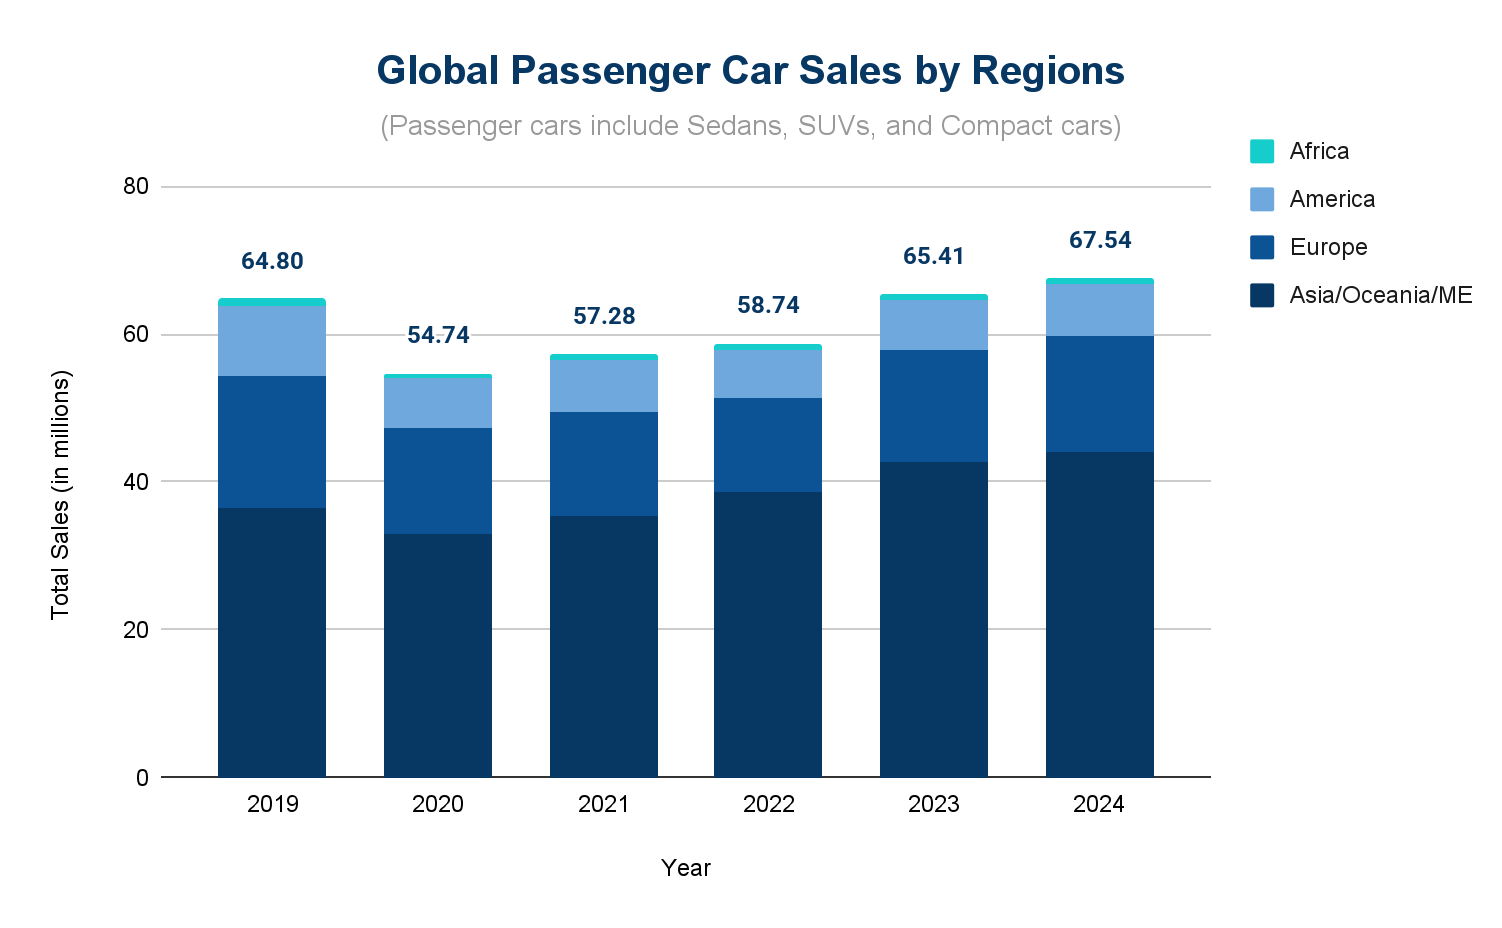
How do Passenger Car sales perform each year?
Passenger vehicles, including sedans, SUVs, and compact cars, continued to lead global car sales in 2024.
- In 2024, global passenger car sales accounted for 67.54 million, a 3.3% increase from 65.41 million in 2023.
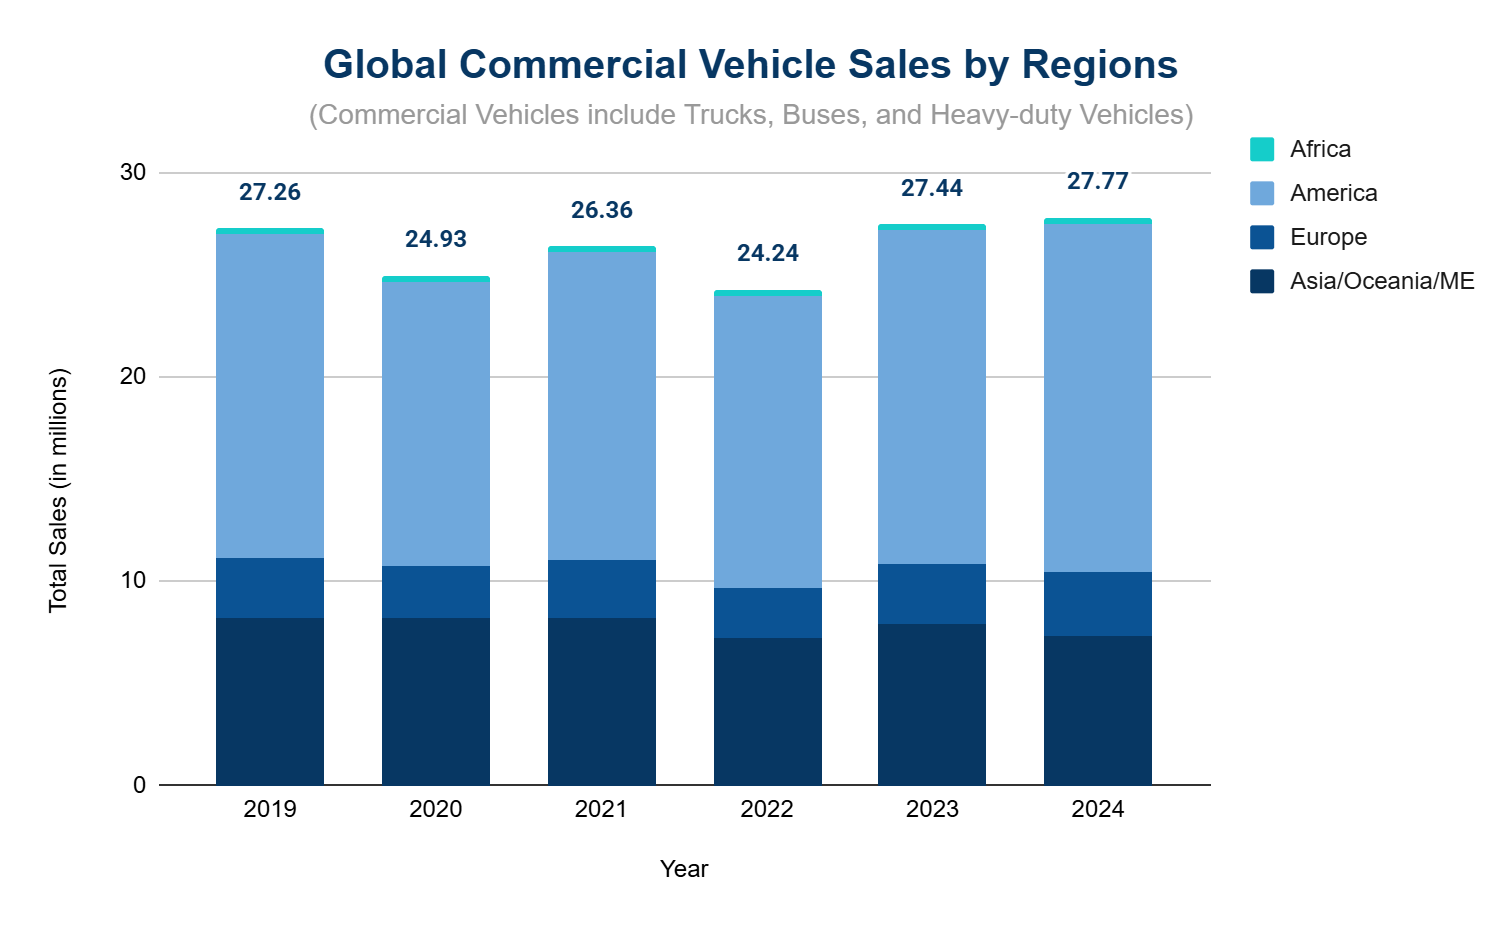
How do commercial vehicle sales perform each year?
Around 27.77 million commercial vehicles were sold worldwide in 2024, reflecting a 1.2% increase from 2023, when sales reached 27.44 million units.
- Commercial vehicles, including trucks, buses, and vans, make up a smaller portion of the global market.
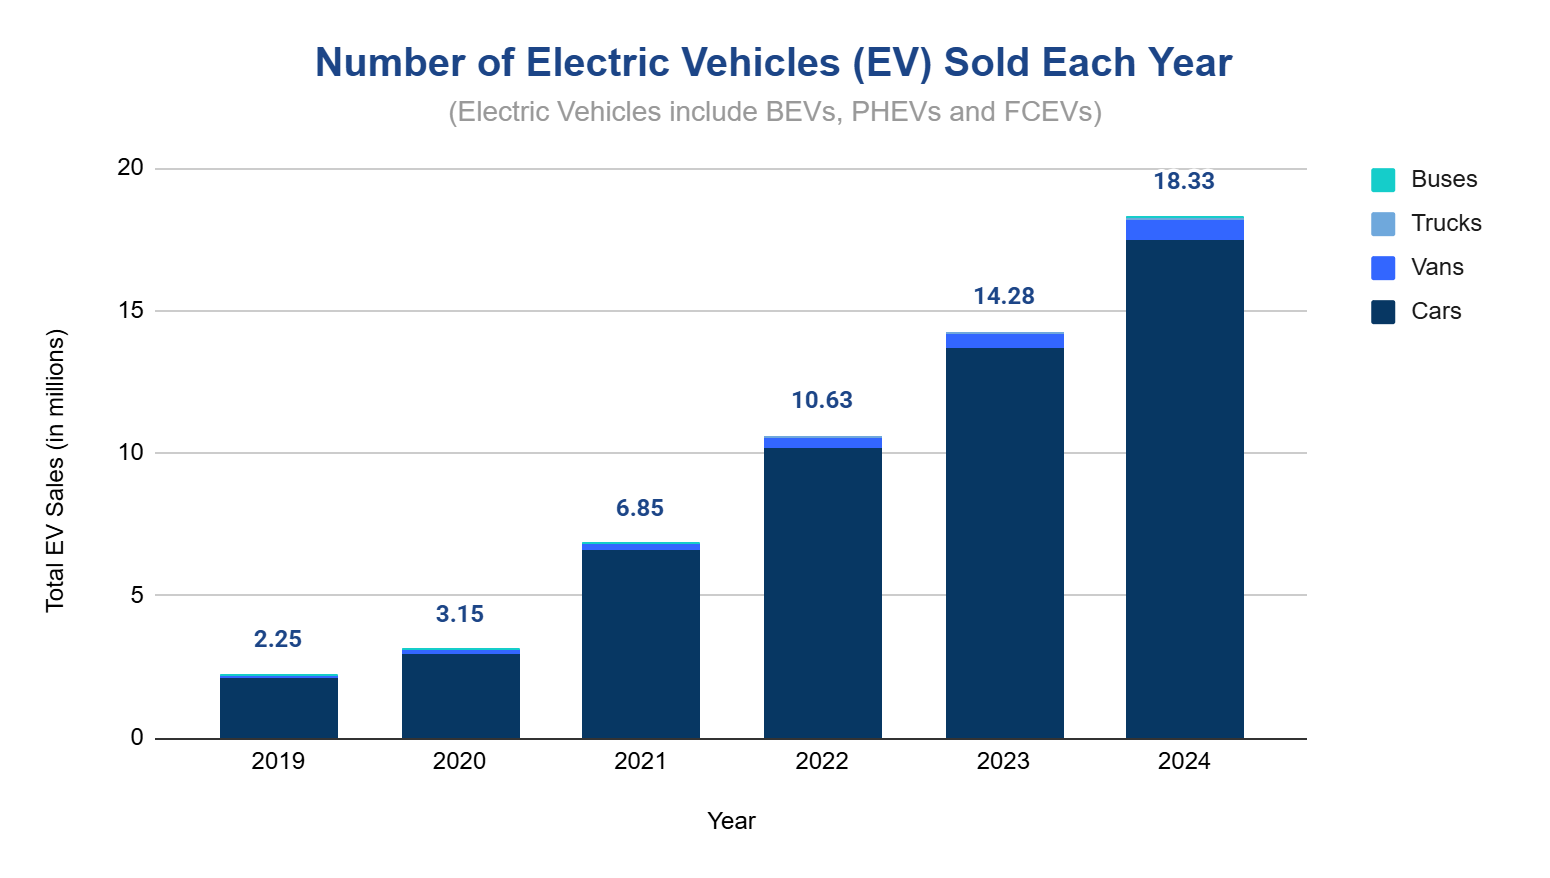
How many electric vehicles (EVs) are sold each year?
Over 18.33 million Electric vehicles were sold globally in 2024, among them 17.51 million were electric cars.
- The electric car market has experienced rapid growth, with its market share rising from 18% in 2023 to 22% in 2024, representing a 27.7% year-over-year increase in sales.
What are the top-selling car manufacturers globally?
- Toyota still led global car sales in 2024, selling approximately 7.56 million vehicles, accounting for 11.25% of the total market.
- Volkswagen (VW) followed with sales of 4.08 million vehicles, representing 6.07% of the global market.
- Tesla and BYD both had a strong presence in the electric vehicle (EV) market and ranked among the top 15 global automakers in 2024.
BYD saw a decline of 14.55% compared to 2023, while Tesla recorded a decrease of 19.43% from the previous year.
Other key players include Ford, General Motors, and Hyundai, each contributing to global sales with both traditional internal combustion engine (ICE) vehicles and electric models.
| Top Selling Car Brand in 2024 | ||
|---|---|---|
| Brand | Total | Market Share |
| Toyota | 7,563,115 | 11.25% |
| Volkswagen | 4,081,492 | 6.07% |
| Ford | 3,417,664 | 5.09% |
| Hyundai | 3,203,427 | 4.77% |
| Suzuki | 2,860,453 | 4.26% |
| Nissan | 2,648,003 | 3.94% |
| Kia | 2,481,926 | 3.69% |
| Wuling | 2,408,959 | 3.58% |
| Chevrolet | 2,329,731 | 3.47% |
| BYD | 2,290,333 | 3.41% |
| Mercedes-Benz | 1,778,701 | 2.65% |
| BMW | 1,726,326 | 2.57% |
| Tesla | 1,414,336 | 2.10% |
| Audi | 1,292,007 | 1.92% |
| Renault | 1,286,542 | 1.91% |
- Explore more about the top car brands driving global sales year after year.
What are the most popular car models worldwide?
- The Toyota RAV4/Wildlander became the most popular car model worldwide in 2024, selling 1.187 million units, an increase of 10.3% from the previous year. It rose from 2nd place in 2023 to 1st in 2024.
- The Tesla Model Y dropped to 2nd position from 1st, selling 1.185 million units. This represented a 3.1% drop from the previous year.
- The Toyota Corolla Cross/Frontlander climbed from 5th to 3rd place with a 20.1% increase in sales to 859,000 units.
- The Honda CR-V/Breeze, despite selling 854,000 units (an increase from 846,100 in 2023), dropped from 3rd to 4th place as other models saw higher growth.
- The Toyota Corolla/Levin sedan dropped from 4th to 5th place, with a 13.2% decrease in sales to 697,000 units.
| Top Selling Car Models in 2024 | ||||
|---|---|---|---|---|
| Rank in 2023 | Rank in 2024 | Car Models | 2024 Sales | vs 2023 Sales |
| 2 | 1 | Toyota RAV4/Wildlander | 1,187,000 | +10.3% |
| 1 | 2 | Tesla Model Y | 1,185,000 | -3.1% |
| 5 | 3 | Toyota Corolla Cross/Frontlander | 859,000 | +20.1% |
| 3 | 4 | Honda CR-V/Breeze | 854,000 | +0.9% |
| 4 | 5 | Toyota Corolla/Levin sedan | 697,000 | -13.2% |
| 8 | 6 | Toyota Hilux | 617,000 | +2% |
| 7 | 7 | Ford F-150 | 595,000 | -4.5% |
| 6 | 8 | Toyota Camry | 593,000 | -9% |
| 10 | 9 | Tesla Model 3 | 560,000 | +10.1% |
| 12 | 10 | BYD Qin | 502,000 | +6.1% |
Related Statistics
In recent years, global car sales have shown steady growth, with electric vehicles and SUVs seeing increased demand. New technologies, such as autonomous driving and connected cars, are expected to influence future sales, along with stricter environmental regulations driving EV adoption, which now makes up 22% of new car sales.
For more insights on these developments, explore Automotive Industry Trends and Statistics.
Sources
- Number of new cars sold – World, by type (Our World in Data) · ourworldindata.org · background
- Global Sales Statistics — All Vehicles, Passenger Cars, Commercial Vehicles (OICA) · oica.net · background
- Global EV Outlook 2024 (IEA) · iea.org · background
- Car Sales by Countries and by Brands (ChinaMobil) · chinamobil.ru · background
- The World’s Top 500 Best-Selling Cars in 2023 (Fiat Group World) · fiatgroupworld.com · background