

 Popular Countries
 24/7 Support
Published
Tokyo Disneyland is a popular theme park offering thrilling rides, shows, and parades with a unique Disney experience. It attracts visitors for family fun, exclusive merchandise, and special events.
How many people visit Tokyo Disneyland each year?
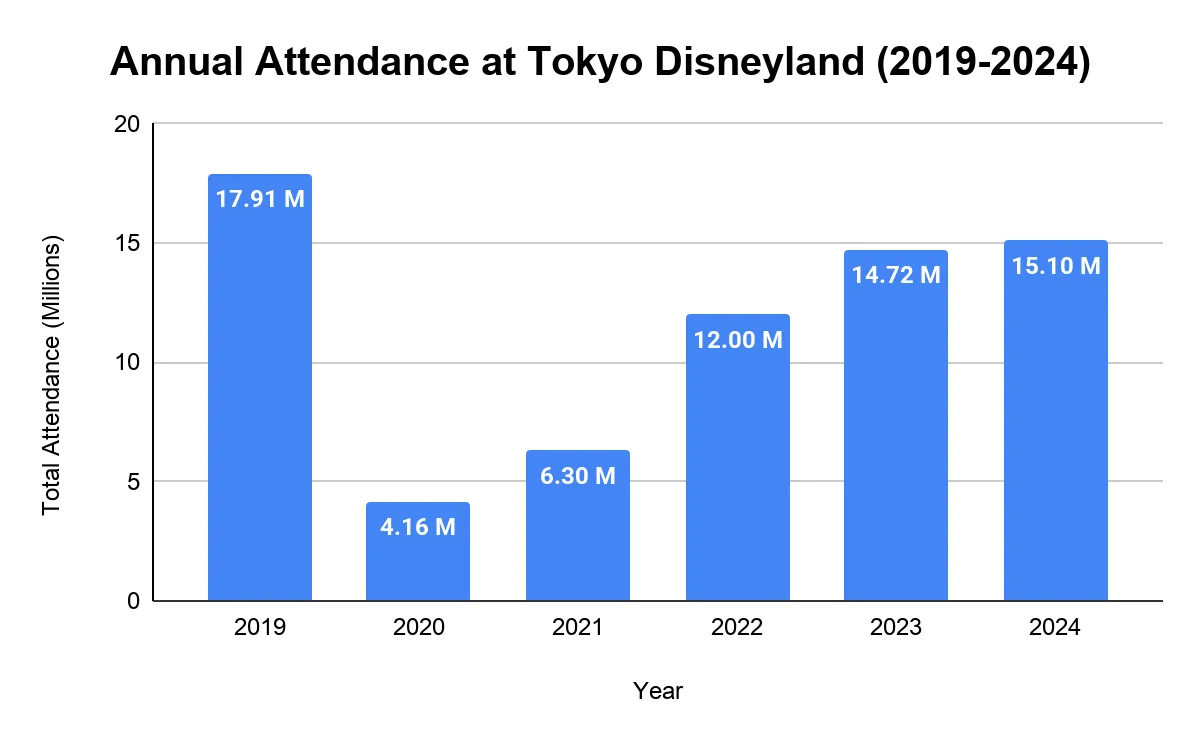
Tokyo Disneyland records over 15 million people in attendance each year.
- Tokyo Disneyland achieved a record attendance of approximately 17.9 million visitors in 2019, marking its highest point before the pandemic.
- However, attendance plummeted to around 4.16 million in 2020 due to pandemic restrictions.
- Recovery began in 2021, with visitor numbers rising to about 6.3 million, followed by further growth to roughly 12 million in 2022.
- Total attendance further rose to 14.72 million in 2023.
- In 2024, the park welcomed 15.10 million attendees, a 2.6% increase from the previous year.
How many people visited Tokyo Disneyland in 2024?
- Tokyo Disneyland welcomed around 15.10 million visitors in 2024, highlighting continued recovery from the COVID-19 pandemic.
- This marks a 2.6% increase in attendance compared to the previous year.
How many people visited Tokyo Disneyland in 2023?
- Tokyo Disneyland drew approximately 14.72 million visitors in 2023, representing a 22.7% increase compared to the previous year.
- However, this figure remains below the pre-pandemic peak of around 17.9 million visitors in 2019.
How many people visit Tokyo Disneyland per day?
- Before the pandemic, Tokyo Disneyland saw approximately 49,041 visitors per day in 2019.
- However, due to travel restrictions, attendance dropped drastically to around 11,397 visitors per day in 2020.
- During the recovery phase, the park welcomed about 17,260 visitors in 2021, followed by 32,877 in 2022, and 40,340 in 2023 per day, reflecting a steady rebound.
- In 2024, the estimated per day visitor averaged nearly 41,381.
How much do visitors spend at Tokyo Disneyland?
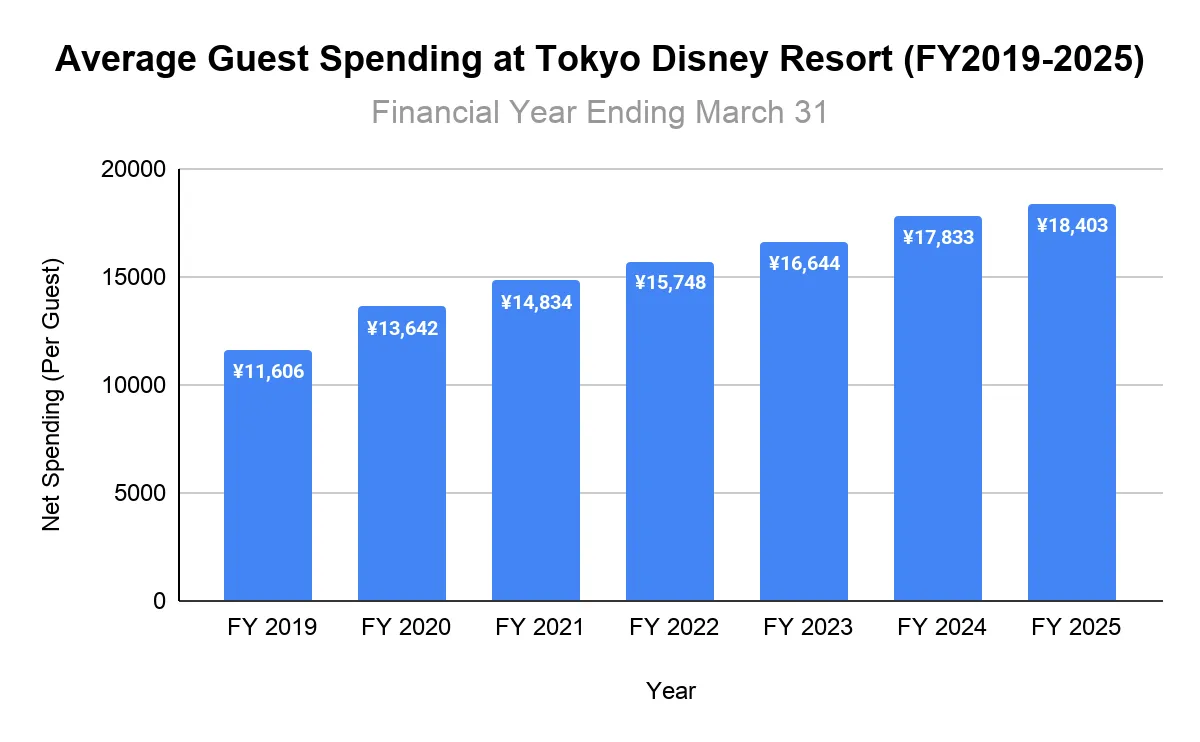
The closest available official measure for visitor spending is Oriental Land Co.’s net sales per guest for Tokyo Disney Resort, which includes Tokyo Disneyland and Tokyo DisneySea combined. Based on this data, visitors spent an average of around ¥18.4 thousand per visit in 2025. This total includes spending on attractions and shows or ticket receipts, merchandise, food, and beverages.
- Before the pandemic, spending per guest stood at approximately ¥11,606 in 2019.
- In 2020, despite pandemic-related restrictions and much lower attendance, average spending per visitor increased to around ¥13,642.
- As the resort began to recover, visitor spending continued to rise, reaching approximately ¥14,834 in 2021 and ¥15,748 in 2022.
- The average expenditure per guest increased further to about ¥16,644 in 2023.
- Spending continued to grow in 2024, reaching approximately ¥17,833 per guest.
- By 2025, average net sales per guest rose again to around ¥18,403, showing a continued upward trend in visitor spending at Tokyo Disney Resort.
Why do people visit Tokyo Disneyland?
- People visit Tokyo Disneyland mainly for entertainment. The main draw for most is the chance to enjoy the park’s attractions, including exciting rides, engaging shows, and parades.
- Many families come to spend time together, particularly during vacations or on special occasions.
- International tourists are often attracted to the unique Disney-themed cultural experience offered in Tokyo.
- Some visitors focus on purchasing exclusive Disney merchandise and indulging in themed food and drinks.
- Special events, like seasonal parades, holiday decorations, and limited-time attractions, also attract those seeking a one-of-a-kind experience.
How popular is Tokyo Disneyland as a tourist destination?
- 4th most visited theme park: In 2024, Tokyo Disneyland welcomed around 15.1 million visitors, making it the fourth most visited theme park in the world.
- 2nd most visited theme park in Asia-Pacific: Tokyo Disneyland remained one of the strongest theme park destinations in the Asia-Pacific region, ranking behind Universal Studios Japan among the region’s highest-attendance parks.
- 2nd most popular Disney Park on social media: Tokyo Disneyland is also highly visible online, ranking as the second most Instagrammable Disney Park globally, with about 13.7 million Instagram posts using Tokyo Disneyland-related hashtags1.
When is the best time to visit Tokyo Disneyland?
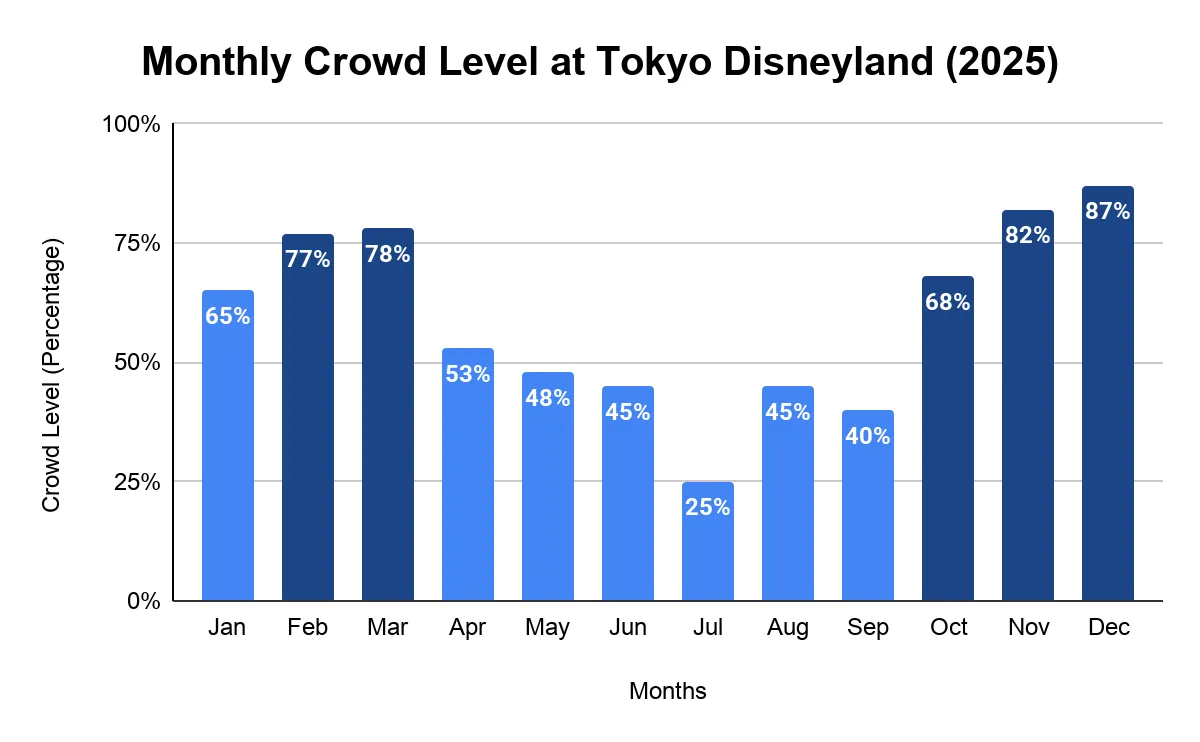
The average monthly crowd levels at Tokyo Disneyland vary throughout the year. The least crowded months included July and September in 2025, while the busiest months were November and December.
- December: 87%.
- November: 82%.
- March: 78%.
- February: 77%.
- October: 68%.
What are the busiest days at Tokyo Disneyland?
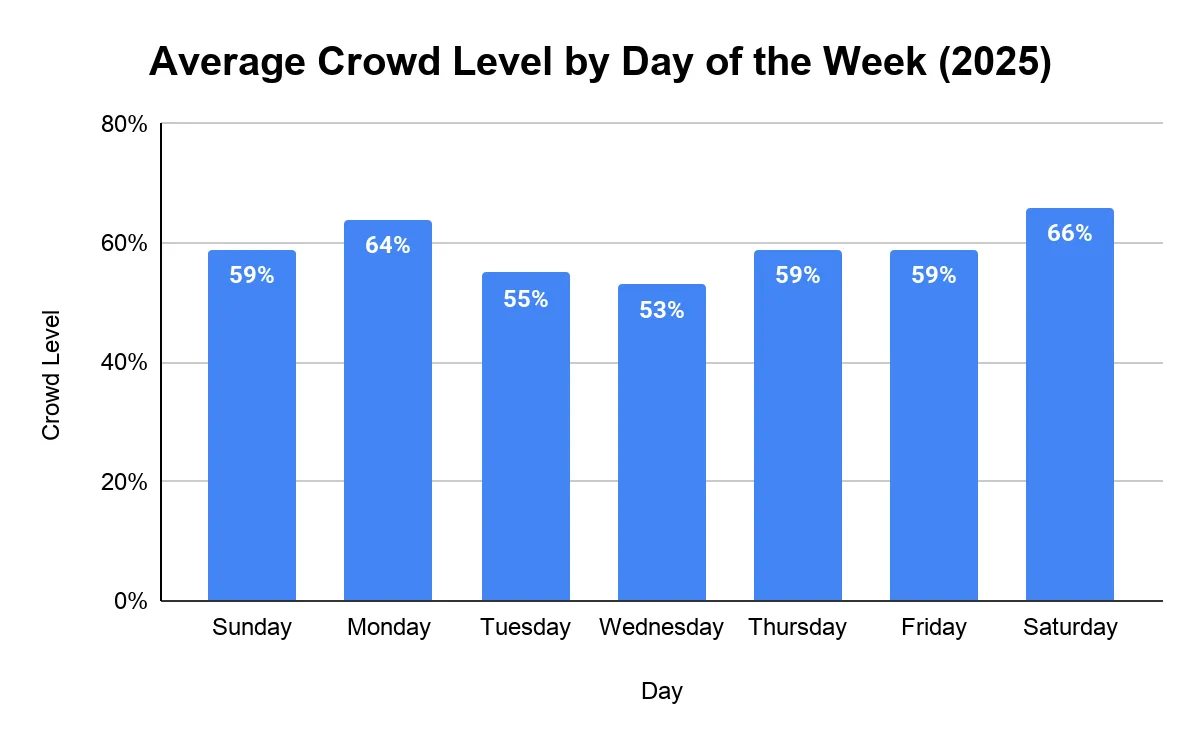
Tokyo Disneyland was busiest on Saturday and Monday in 2025, while Wednesday and Tuesday were comparatively quieter days to visit.
- In 2025, Saturday was the busiest day of the week at Tokyo Disneyland, with a 66% crowd level.
- Monday recorded the second-highest average crowd level, reaching 64%.
- Sunday had an average crowd level of 59%, making it one of the busier days of the week.
- Wednesday was the least crowded day of the week, with an average crowd level of 53%.
What are the top things to do in Tokyo Disneyland?
- Pooh’s Honey Hunt: This innovative dark ride features a trackless system, offering guests a one-of-a-kind adventure through the enchanting world of Winnie the Pooh. With captivating storytelling and impressive animatronics, it stands out as a must-experience attraction.
- Enchanted Tale of Beauty and the Beast: This recent attraction invites guests into the enchanting world of Beauty and the Beast, combining stunning visuals with an engaging ride system. Highlighted by remarkable animatronics and a magical ambiance, it offers an unforgettable experience.
- Splash Mountain: This classic log flume ride blends immersive storytelling with exhilarating drops, inspired by the film Song of the South. The ride concludes with a dramatic five-story drop, making it a favorite among thrill-seekers.
- Big Thunder Mountain: This high-speed mine-train ride takes guests through a rugged Western landscape filled with sharp turns, sudden drops, and fast-paced movement. It is a strong option for visitors who want an exciting thrill ride at Tokyo Disneyland.
- Pirates of the Caribbean: This iconic boat ride immerses guests into the adventurous world of swashbuckling pirates, featuring intricate scenes and lifelike animatronics. Its immersive atmosphere and captivating soundtrack create an enjoyable experience for all ages.
Related Travel Statistics
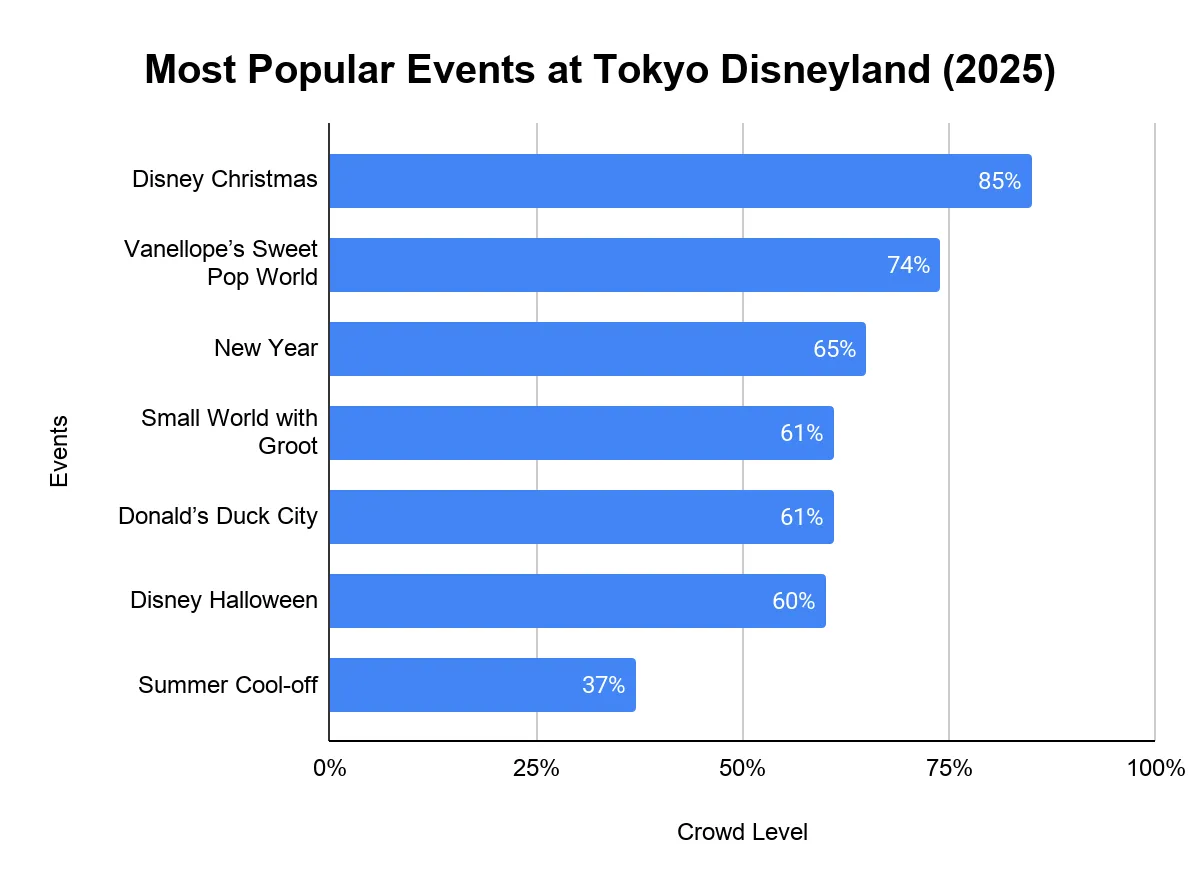
What were the most popular events at Tokyo Disneyland in 2025?
In 2025, Disney Christmas was the most popular event at Tokyo Disneyland, with an average crowd level of 85%.
- Disney Pal-Palooza Vanellope’s Sweet Pop World recorded the second-highest crowd level, reaching 74%.
- New Year’s was also one of the busiest event periods, with an average crowd level of 65%.
- It’s a Small World with Groot attracted a crowd of 61%, making it one of the more popular special offerings in 2025.
- Donald’s Quacky Duck! Duck! Duck City! also recorded a 61% crowd level, placing it alongside “It’s a Small World with Groot” among the year’s mid-to-high crowd events.
References
- Most 'Instagrammable' Disney Parks · ittn.ie ↑
- AECOM Theme Index and Museum Index Reports – 2006 to 2022 · aecom.com
- TEA Global Experience Index — Annual Attendance at Tokyo Disneyland (2024–2025) · Themed Entertainment Association
- Oriental Land Co. Fact Book 2026 — Financial Data for Tokyo Disney Resort · olc.co.jp
- MouseNotifier — Global Theme Parks: Attendance and Ranking Report, 2024 · mousenotifier.com
- Queue-Times — Tokyo Disneyland Crowd Level Statistics · queue-times.com

