

 Popular Countries
 24/7 Support
Published Sep 9, 2026
Situated in Hebron, Kentucky, Cincinnati/Northern Kentucky International Airport (CVG) serves Greater Cincinnati as both a fast-growing passenger gateway and a leading cargo center. After its Delta hub era ended, CVG transformed into a major freight hub, while reviving passenger traffic through low-cost carriers and new routes.
How many passengers use Cincinnati/Northern Kentucky International Airport each year?
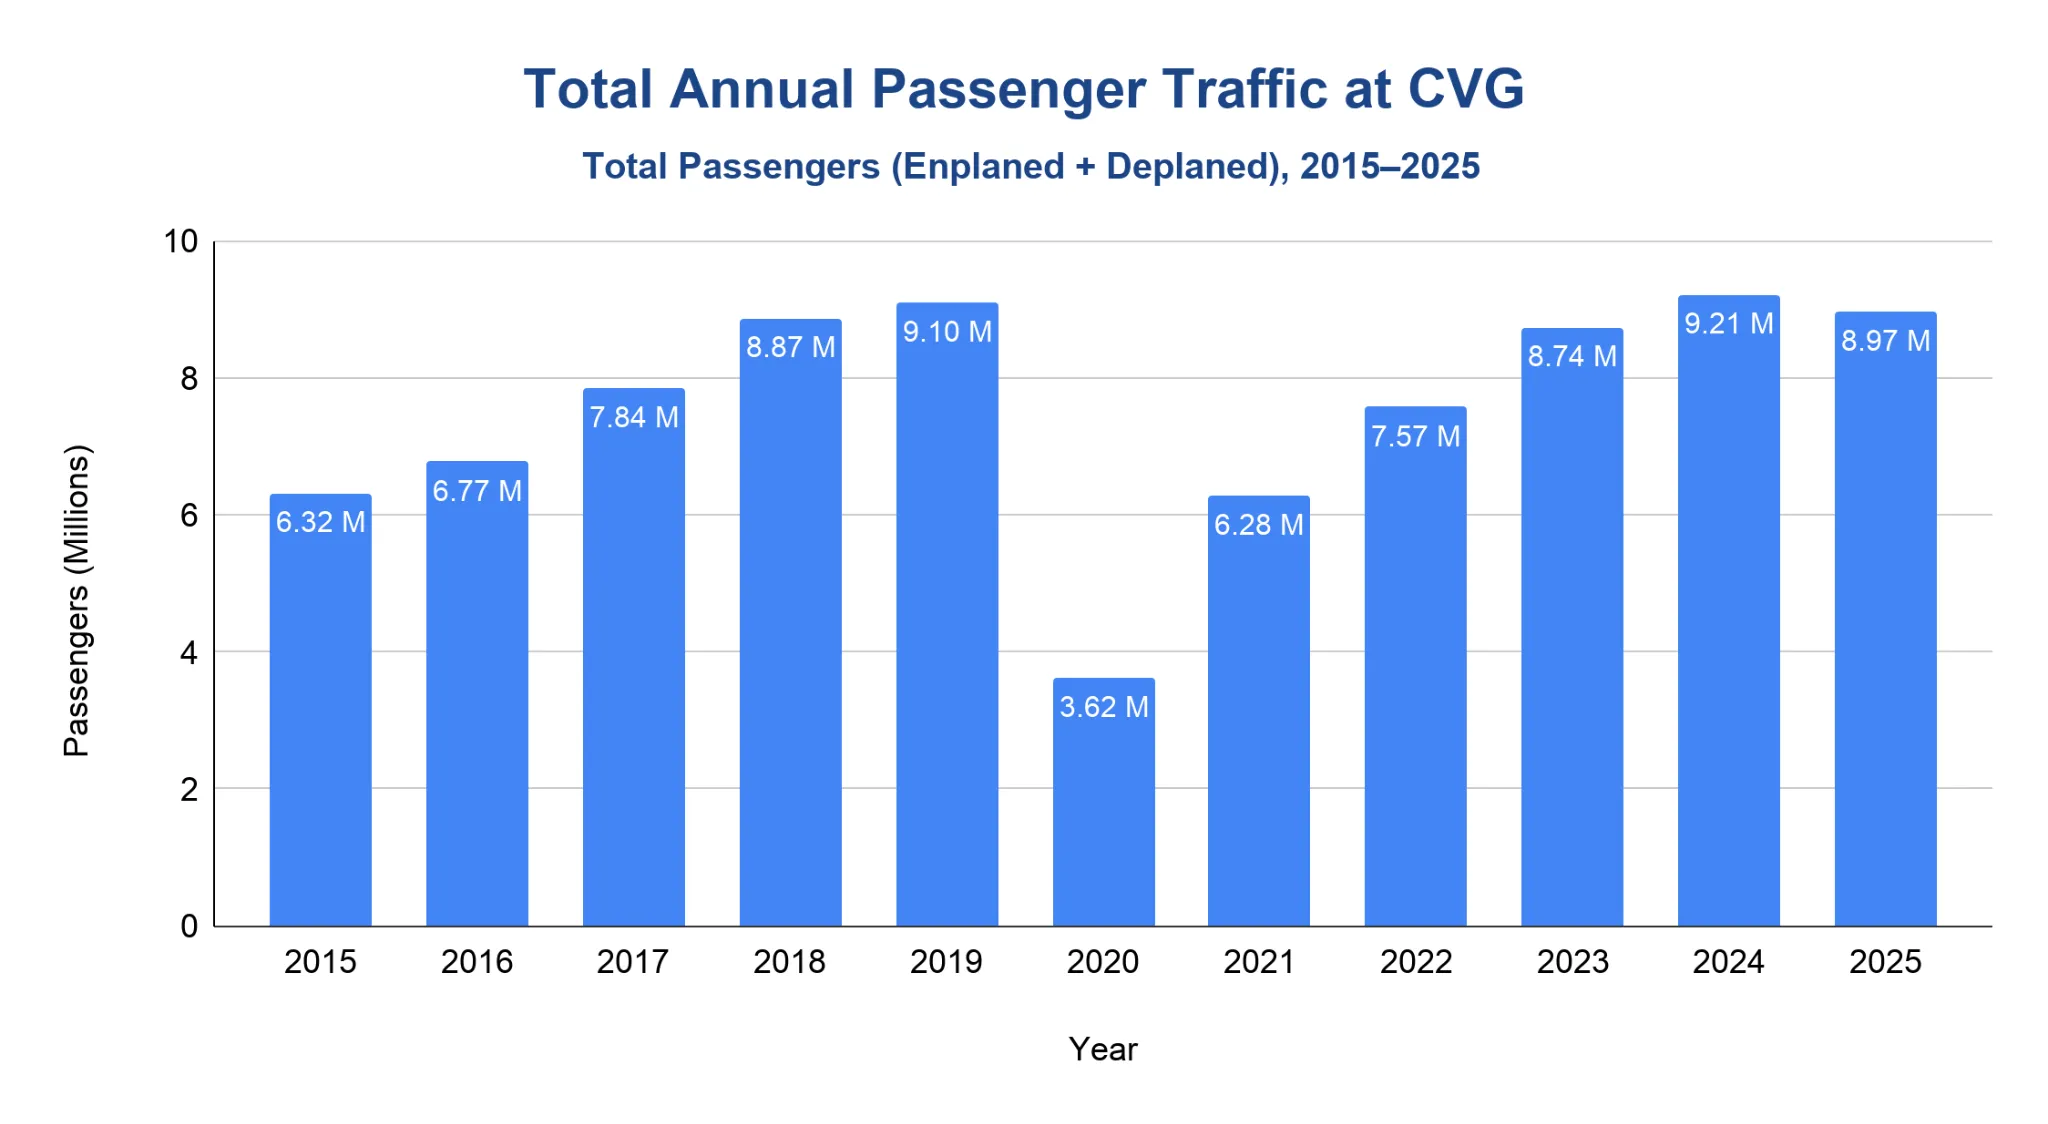
CVG handled 8.97 million total passengers in 2025, down 2.62% from 2024.
- Passenger traffic grew from 6.32 million in 2015 to 8.87 million in 2018, adding more than 2.5 million annual passengers before the final pre-pandemic year.
- CVG reached 9.1 million total passengers in 2019, then fell to 3.62 million in 2020 during the pandemic.
- Recovery brought traffic back to 6.28 million in 2021, 7.57 million in 2022 and 8.74 million in 2023.
- The airport reached 9.21 million passengers in 2024, then eased to 8.97 million in 2025.
- As of March 2026, CVG reported 1.99 million total passengers year to date.
Note: Total passengers combine enplaned and deplaned passengers, so this section measures full airport passenger traffic rather than departing passengers only.
Passenger Travel Patterns at Cincinnati/Northern Kentucky International Airport
Originating passengers accounted for 95.5% of CVG enplanements in 2023.
- Originating passenger share rose from 77.6% in 2014 to 93.7% in 2018, showing CVG’s shift toward local passenger demand.
- The pre-pandemic share reached 95.3% in 2019, while total enplanements reached 4.55 million.
- During the pandemic, total enplanements fell to 1.8 million in 2020, but originating passengers still represented 96.6% of the total.
- Post-pandemic enplanements recovered to 3.14 million in 2021, 3.78 million in 2022 and 4.37 million in 2023.
- In 3Q 2024, more than 7 out of 10 domestic passengers originating at CVG traveled nonstop to their destination.
| Year | Enplaned Passengers (000s) | Originating Passengers (000s) | Connecting Passengers (000s) | Originating Share (% Of Total) |
|---|---|---|---|---|
| 2014 | 2,965 | 2,299 | 665 | 77.6% |
| 2015 | 3,160 | 2,670 | 491 | 84.5% |
| 2016 | 3,384 | 3,008 | 376 | 88.9% |
| 2017 | 3,926 | 3,652 | 274 | 93.0% |
| 2018 | 4,401 | 4,122 | 279 | 93.7% |
| 2019 | 4,554 | 4,341 | 213 | 95.3% |
| 2020 | 1,803 | 1,741 | 61 | 96.6% |
| 2021 | 3,140 | 3,052 | 88 | 97.2% |
| 2022 | 3,783 | 3,537 | 245 | 93.5% |
| 2023 | 4,370 | 4,173 | 197 | 95.5% |
Source · Note: This section uses enplaned passengers, which are departing passengers only. Originating passengers are travelers whose itineraries begin at CVG, while connecting passengers are transferring through the airport.
What is the total number of aircraft operations at Cincinnati/Northern Kentucky International Airport?
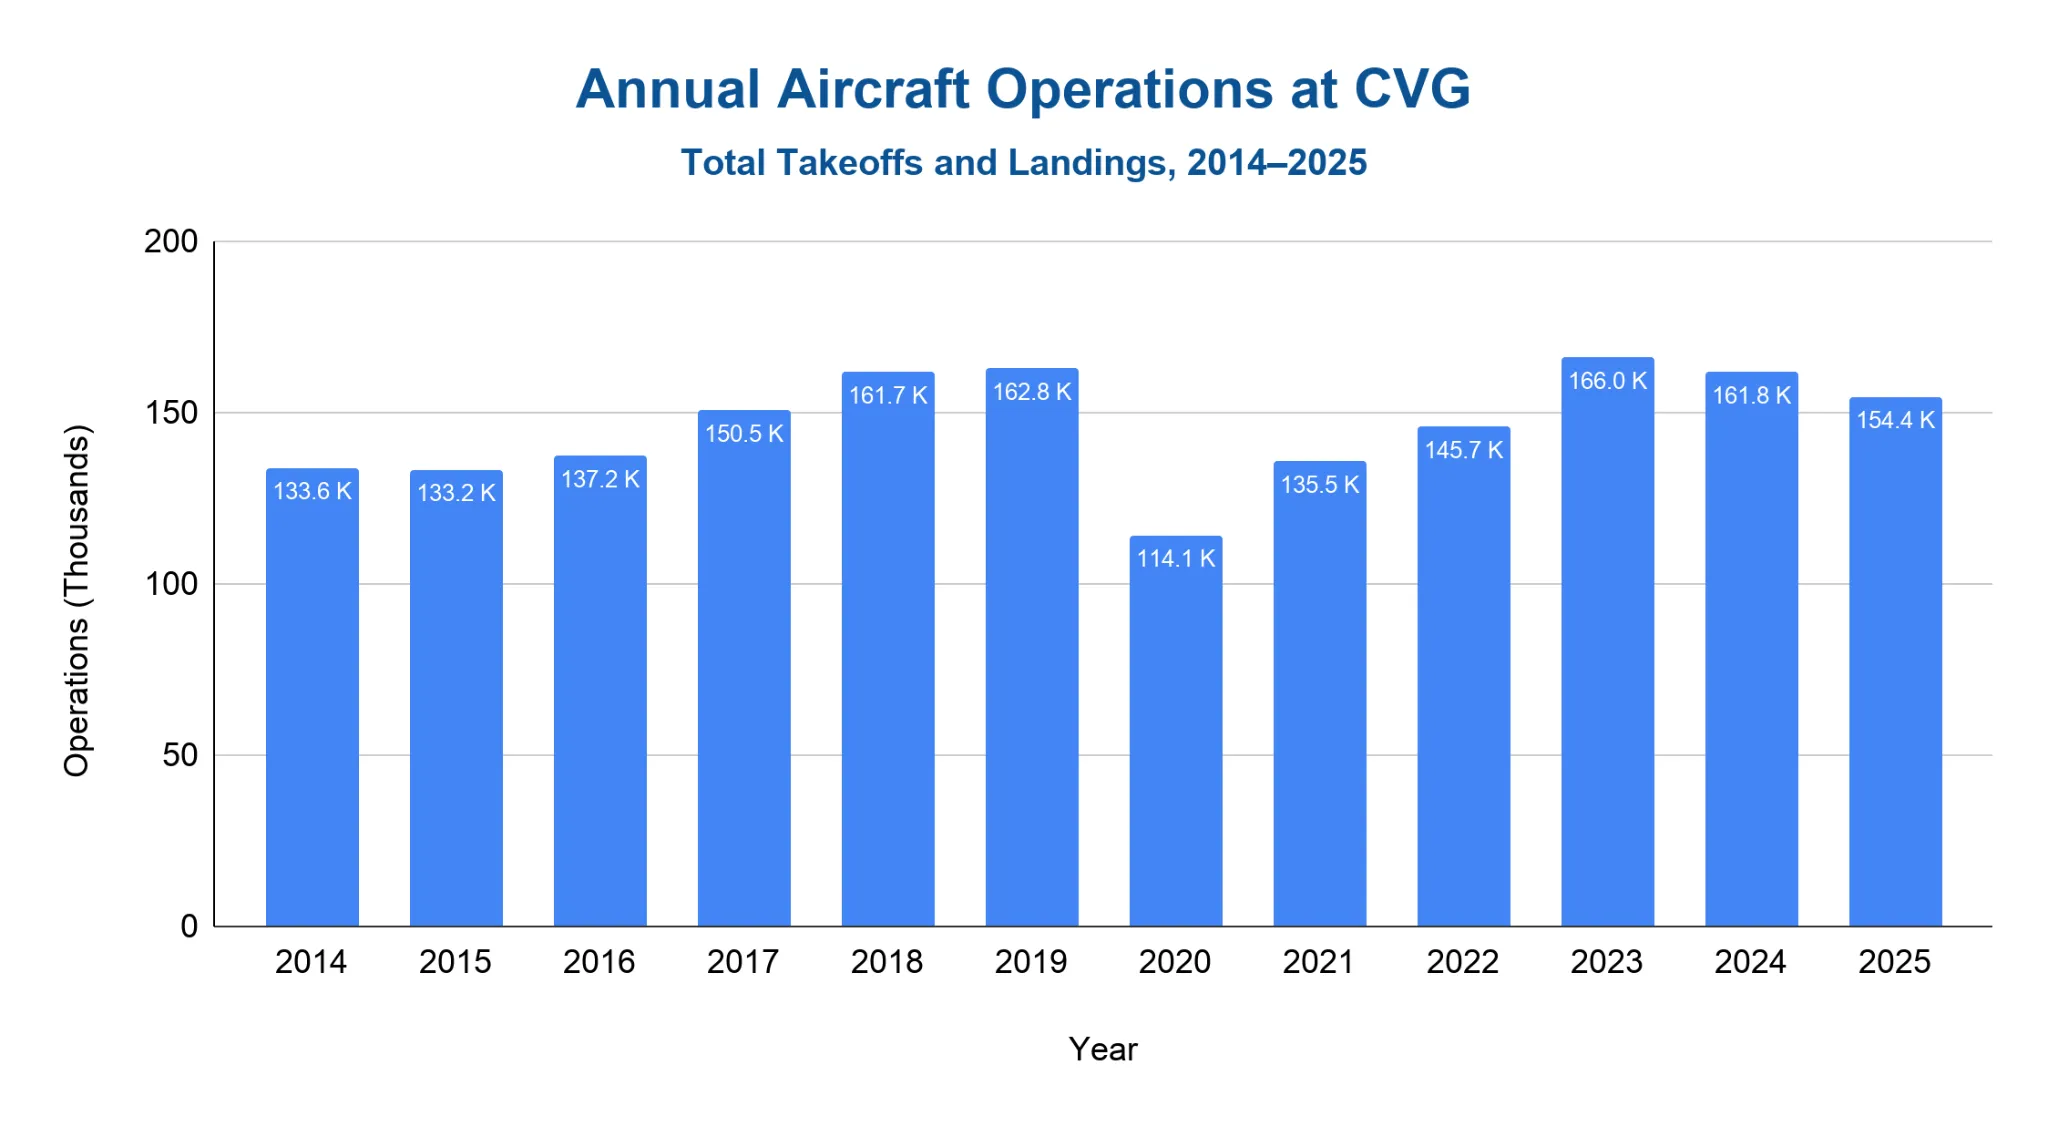
Total aircraft operations reached 154,373 in 2025, down 4.56% from the revised 2024 total.
- Aircraft operations rose from 133,619 in 2014 to 161,744 in 2018.
- Pre-pandemic operations reached 162,816 in 2019, then fell to 114,113 in 2020.
- Activity recovered to 135,480 operations in 2021, 145,667 in 2022 and 166,000 in 2023.
- CVG’s revised airport-statistics total was 161,757 operations in 2024, followed by 154,373 in 2025.
- As of March 2026, CVG reported 35,390 aircraft operations year to date.
Note: Aircraft operations count both takeoffs and landings. The 2014–2023 values come from FAA OPSNET data reproduced in CVG’s official bond statement, while 2024 onward uses CVG’s air traffic statistics.
Which airlines carry the most passengers out of Cincinnati/Northern Kentucky International Airport?
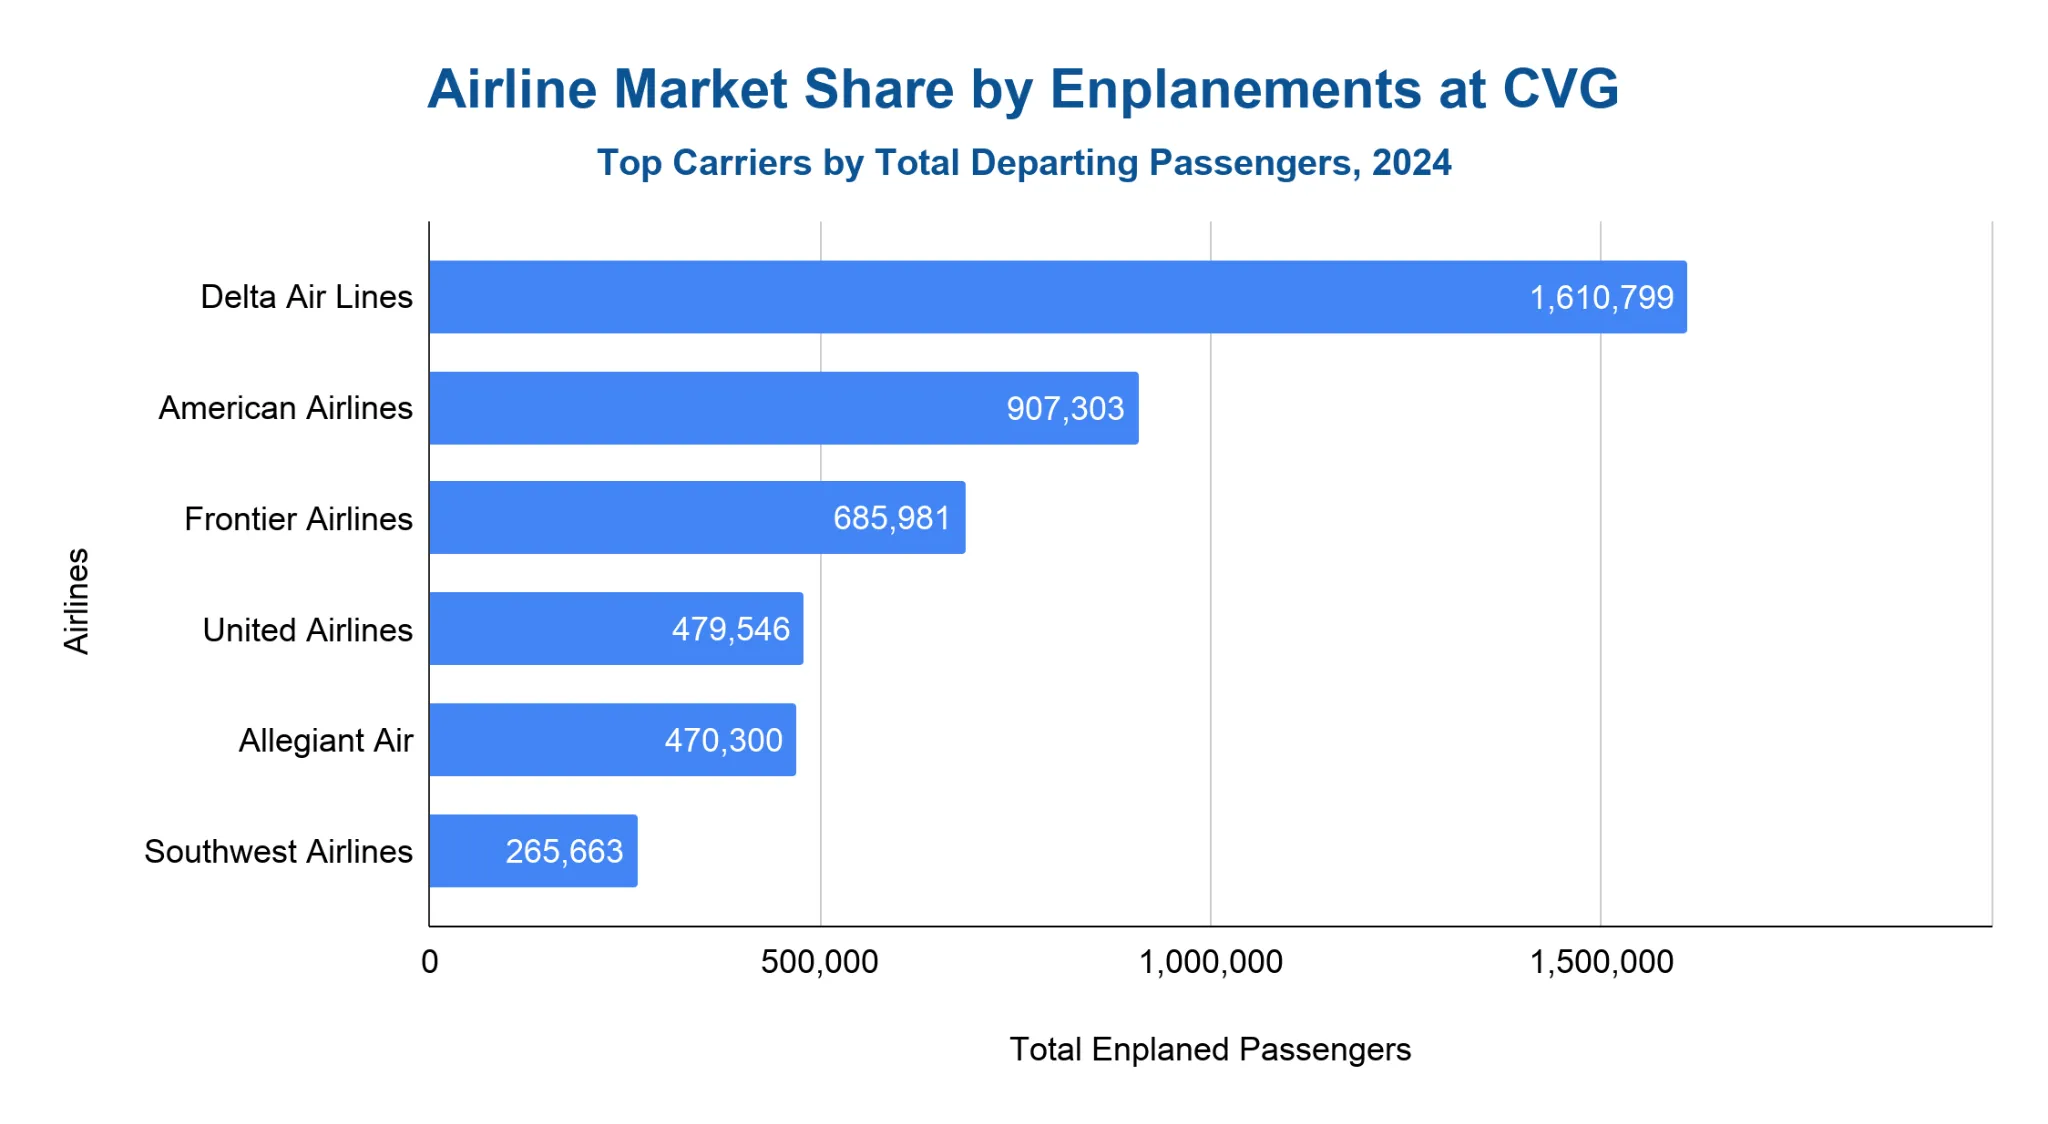
Delta led CVG’s published 2024 carrier enplanements with 1.61 million departing passengers.
- Delta carried 1.61 million enplanements, equal to a calculated 35% enplanement share.
- American enplaned 907,303 passengers, followed by Frontier with 685,981.
- United and Allegiant each exceeded 470,000 enplanements.
- Southwest recorded 265,663 enplanements.
Note: Enplanements are departing passengers only. Delta share is calculated from CVG’s official 2024 total of 4,605,114 enplanements.
How much revenue does Cincinnati/Northern Kentucky International Airport generate annually?
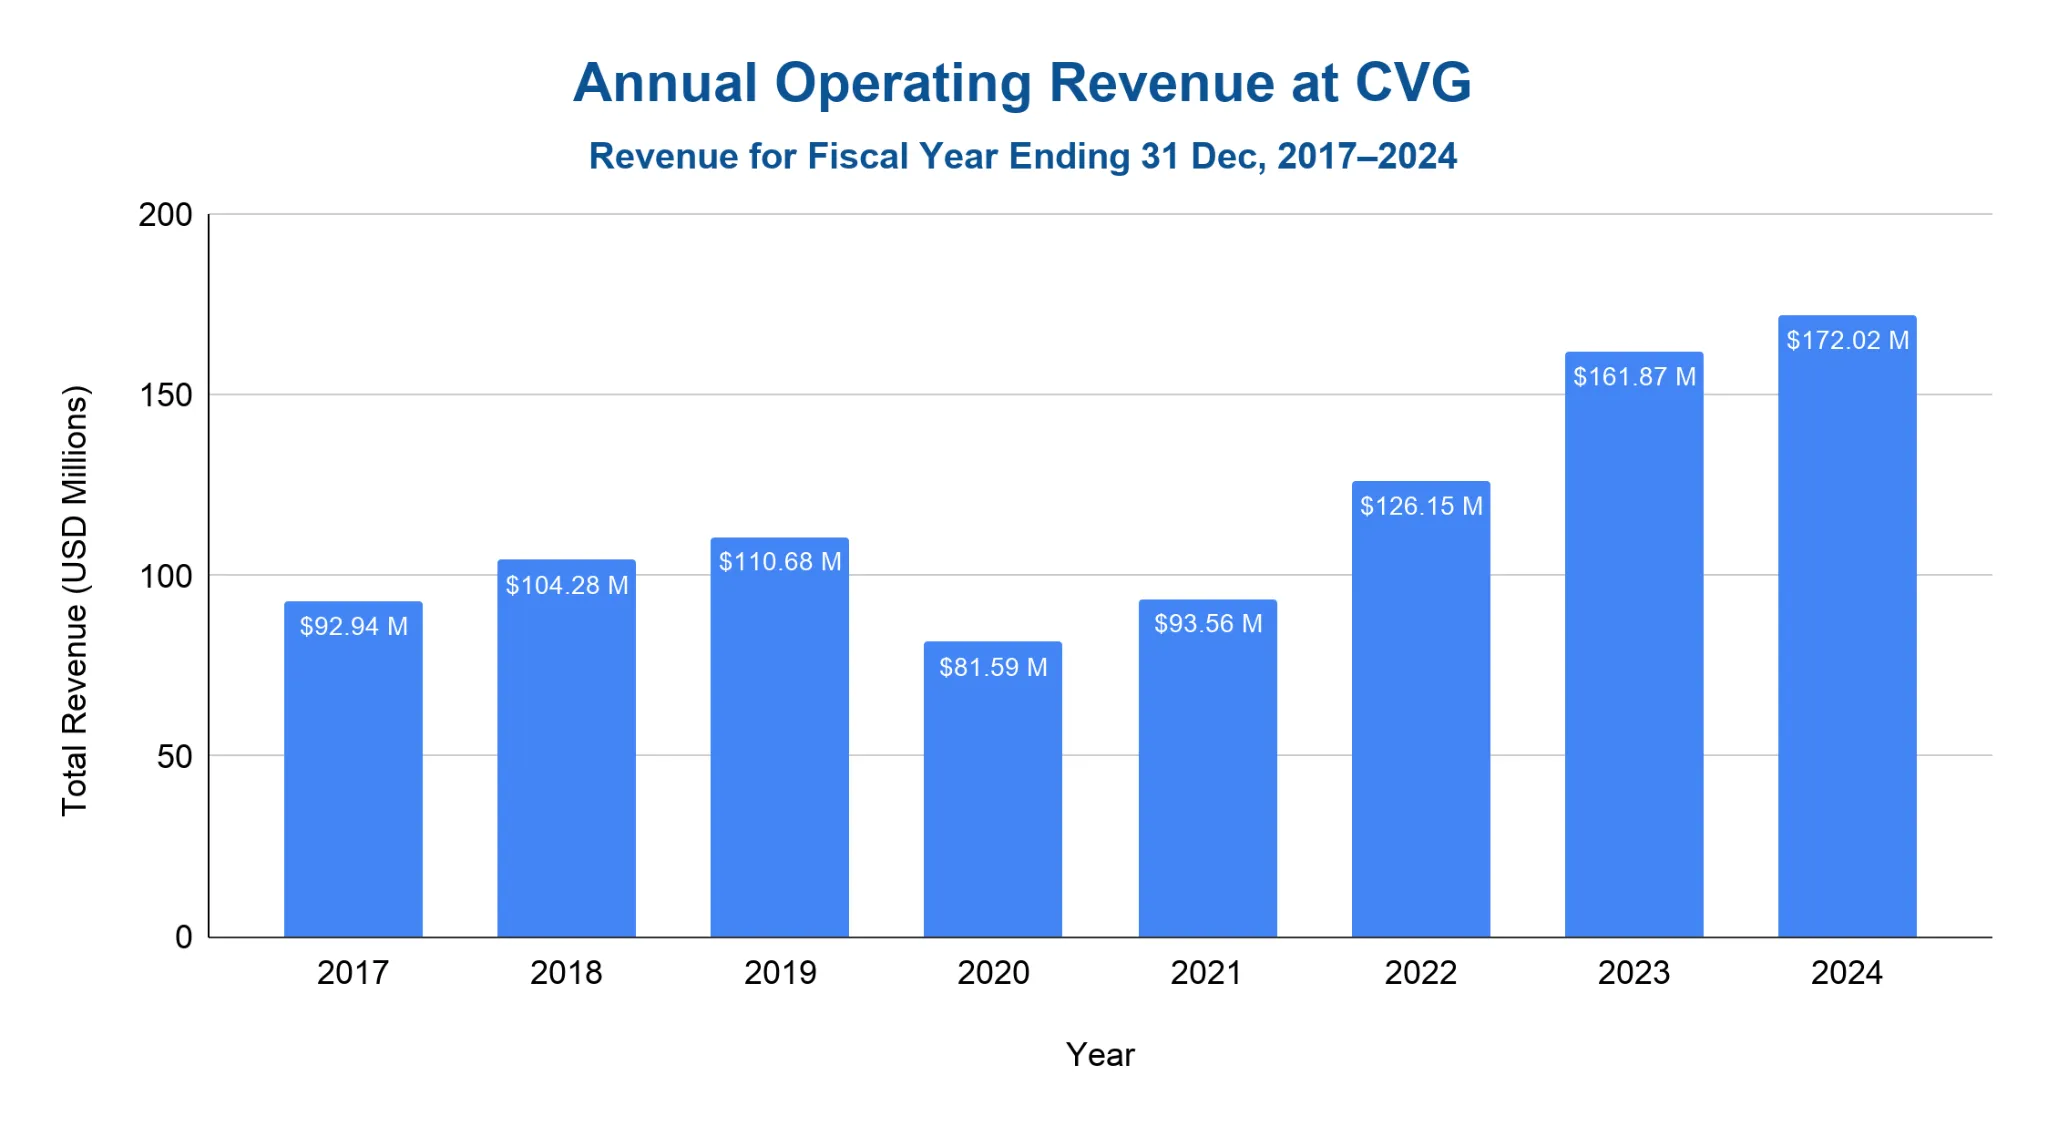
Total operating revenue reached $172.02 million in the year ended December 31, 2024.
- Operating revenue rose from $92.94 million in 2017 to $104.28 million in 2018 and $110.68 million in 2019.
- During the pandemic, operating revenue fell to $81.59 million in 2020.
- Post-pandemic recovery brought operating revenue back to $93.56 million in 2021 and $126.15 million in 2022.
- Revenue increased further to $161.87 million in 2023 and $172.02 million in 2024.
- DHL, Delta and American represented 10.94%, 10.07% and 7.98% of total operating revenues in 2024, respectively.
Note: Figures are reported in the airport’s financial statements in thousands of dollars and are shown here in millions for readability. The 2021 value uses the later restated figure published in subsequent financial statements.
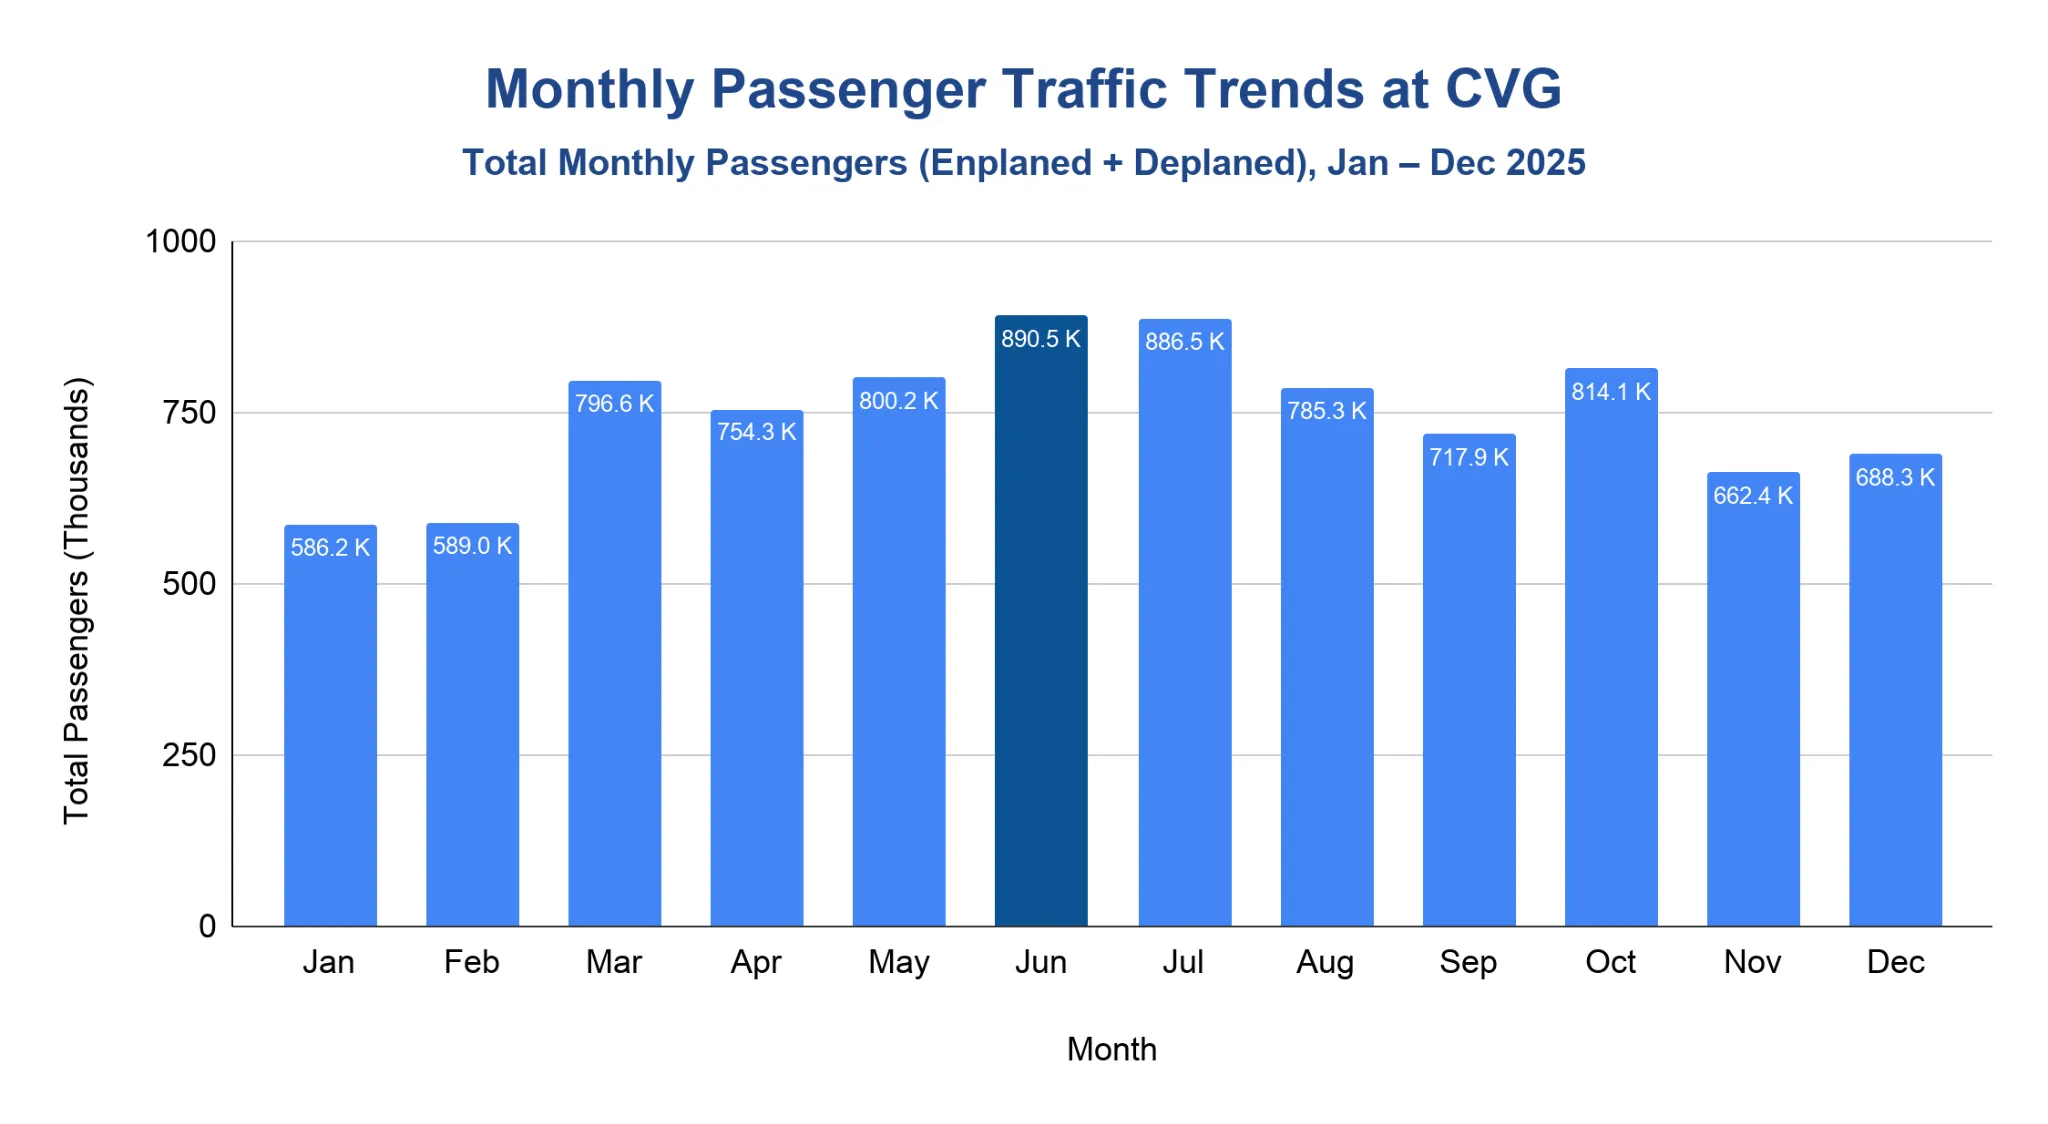
When are the peak travel months at Cincinnati/Northern Kentucky International Airport?
June was CVG’s busiest month in 2025 with 890,475 total passengers.
- July followed closely with 886,453 total passengers.
- October reached 814,055, while May reached 800,161.
- January and February were the slowest months, with 586,227 and 589,015 total passengers.
- Monthly passenger traffic stayed above 660,000 from March through December.
Note: Monthly passenger figures use total passengers, meaning enplaned plus deplaned passengers.
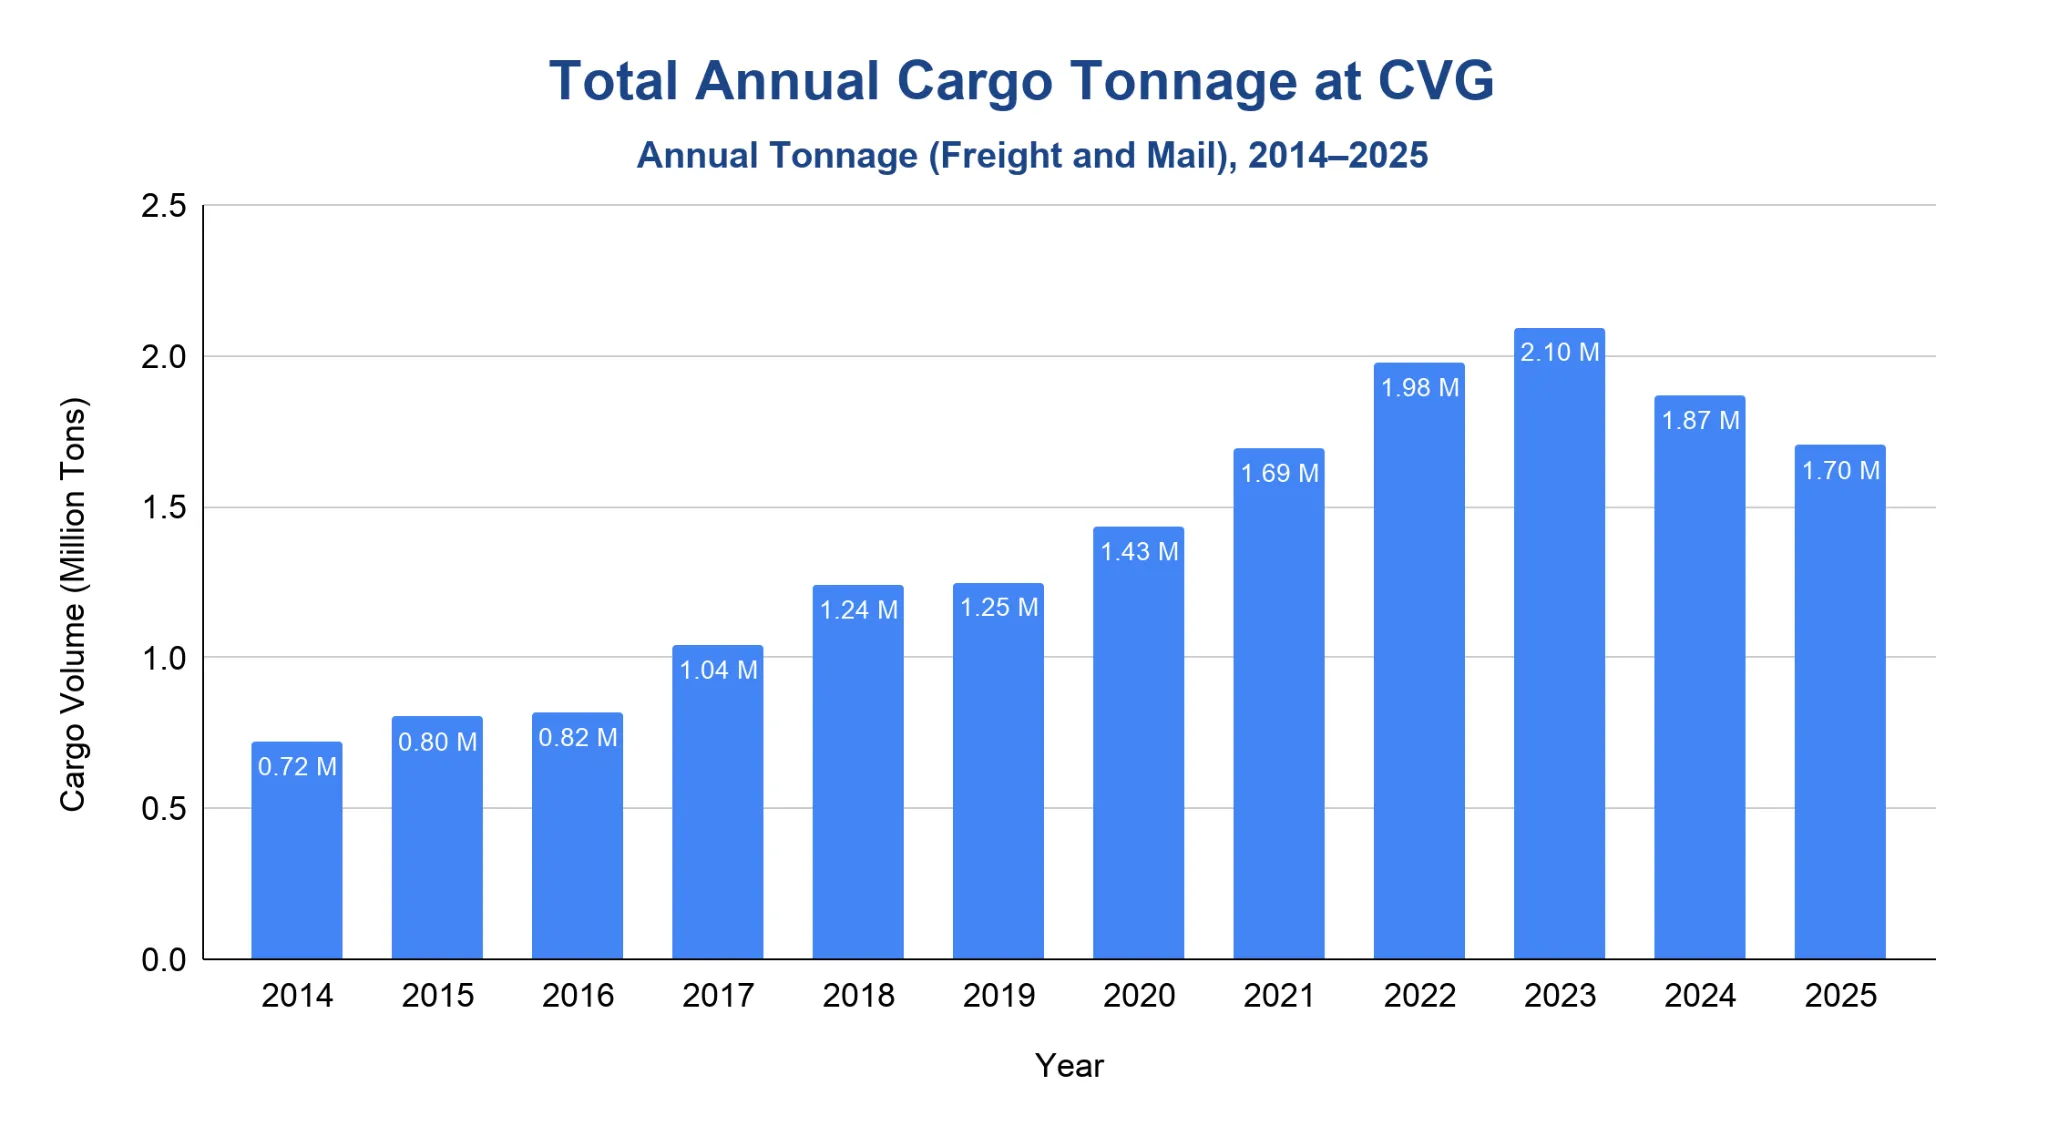
How much cargo moves through Cincinnati/Northern Kentucky International Airport annually?
CVG handled 1.7 million tons of cargo in 2025, an 8.87% decrease from 2024.
- Cargo volume grew from 722,431 tons in 2014 to 1.24 million tons in 2018.
- The airport handled 1.25 million cargo tons in 2019, then increased to 1.43 million tons in 2020.
- Post-pandemic cargo growth continued to 1.69 million tons in 2021, 1.98 million tons in 2022 and 2.10 million tons in 2023.
- Cargo then eased to 1.87 million tons in 2024 and 1.70 million tons in 2025.
- As of March 2026, CVG reported 387,055 total cargo tons year to date.
Major Expansion Projects For Cincinnati/Northern Kentucky International Airport
Elevate CVG moved toward construction in 2025 as a multi-year terminal improvement program.
- Elevate CVG is designed to boost operational efficiency, modernize facilities and improve the customer experience.
- CVG’s Welcome Point project started in August 2023 and finished in spring 2024.
- A new baggage handling system began design and initial demolition in 2024, with construction planned over several phases for 3 years.
- DHL broke ground in October 2024 on a $192 million expansion project, including a 305,000-square-foot maintenance facility.
- Amazon’s south-side development includes a $1.5 billion cargo hub with an 800,000-square-foot sortation building and ramp parking for 35 aircraft.
Note: The Master Plan guides long-range facility planning, while Elevate CVG and tenant cargo projects are active airport-campus development efforts.
Related Travel Statistics
- Boise Airport Statistics
- El Paso International Airport (ELP) Statistics
- Fayetteville Regional Airport Statistics
- Flagstaff Pulliam Airport Statistics
- Houston Hobby Airport Statistics
- Idaho Falls Regional Airport Statistics
- Indianapolis International Airport Statistics
- Missoula Montana Airport (MSO) Statistics
- Norfolk International Airport (ORF) Statistics
- O’Hare International Airport Statistics
- Eppley Airfield (OMA) Statistics
- Chicago Rockford Airport Statistics
Sustainability Initiatives at Cincinnati/Northern Kentucky International Airport
CVG’s published sustainability goals include a 2050 net-zero carbon target and active engagement in ACI Carbon Accreditation.
- CVG is committed to becoming Net Zero Carbon by 2050.
- The airport is engaging in the ACI Carbon Accreditation Program to support carbon reduction and environmental sustainability.
- CVG is pursuing an innovative approach to bringing sustainable aviation fuels to its campus.
- The airport’s sustainability planning includes LED lighting and energy-efficiency projects.
- CVG public parking includes 8 EV charging stations in the Terminal Garage and 4 in ValuPark.
Note: Sustainability measures cover carbon reduction, energy efficiency, fuel innovation and passenger-facing EV infrastructure.
How does Cincinnati/Northern Kentucky International Airport rank nationally and globally?
CVG’s Spring 2025 fact sheet ranks the airport 7th in North America and 20th globally for cargo operations in 2024.
- CVG handled 1.87 million cargo tons in 2024, according to the airport’s Spring 2025 fact sheet.
- The airport is home to the Amazon Air Hub and DHL Express Global Superhub.
- CVG reported $10.5 billion in economic impact on the regional economy.
- The airport supported 56,000+ total jobs in 2024.
- Passenger air service included 55+ nonstop destinations and 14 passenger airlines and tour operators.
Note: The rankings in this section refer to cargo operations, not passenger volume. Passenger-ranking claims should use FAA enplanement rankings when included.

