

 Popular Countries
 24/7 Support
Published Sep 9, 2026
Indianapolis International Airport (IND) is the busiest airport in Indiana and serves as the state’s primary air travel hub. It offers nonstop service to over 50 destinations across North America and select European cities through multiple partner airlines. IND is also FedEx Express’s second-largest hub in the world.
How many passengers pass through Indianapolis International Airport each year?
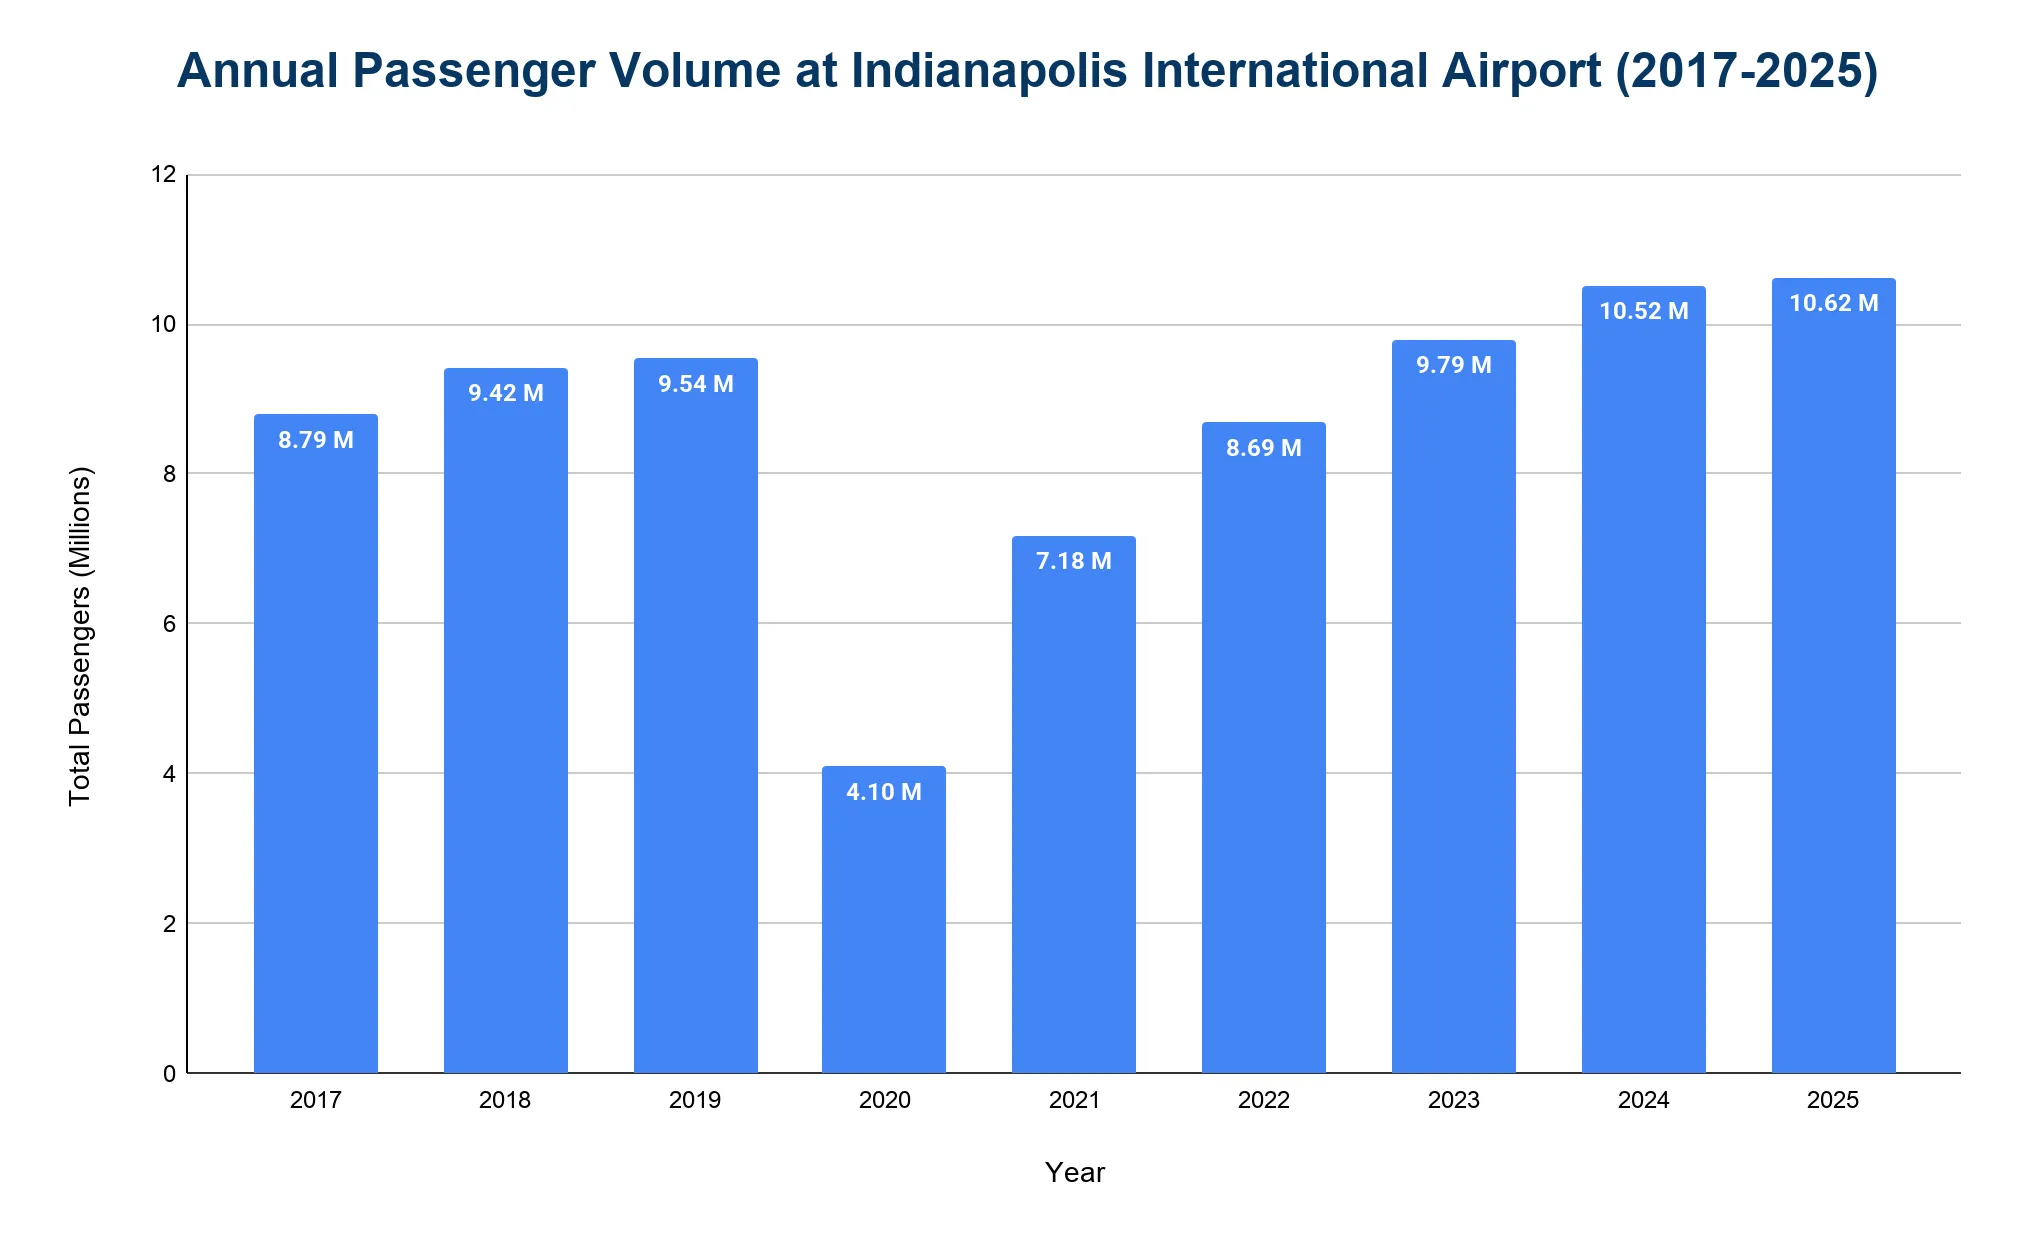
Indianapolis International Airport handles over 10 million passengers annually. It set a new record in 2025, reflecting a strong rebound from earlier pandemic declines.
- The airport served 10.62 million passengers in 2025, a 0.95% increase from the previous year.
- In 2019, passenger volume reached 9.54 million before dropping to 4.1 million in 2020, a 57% decline.
- The airport recovered to 7.18 million in 2021, 8.69 million in 2022 and 9.79 million in 2023.
- In 2024, the airport had 10.52 million passengers, the first time it surpassed the 10 million mark.
What is the total number of aircraft operations at Indianapolis International Airport each year?
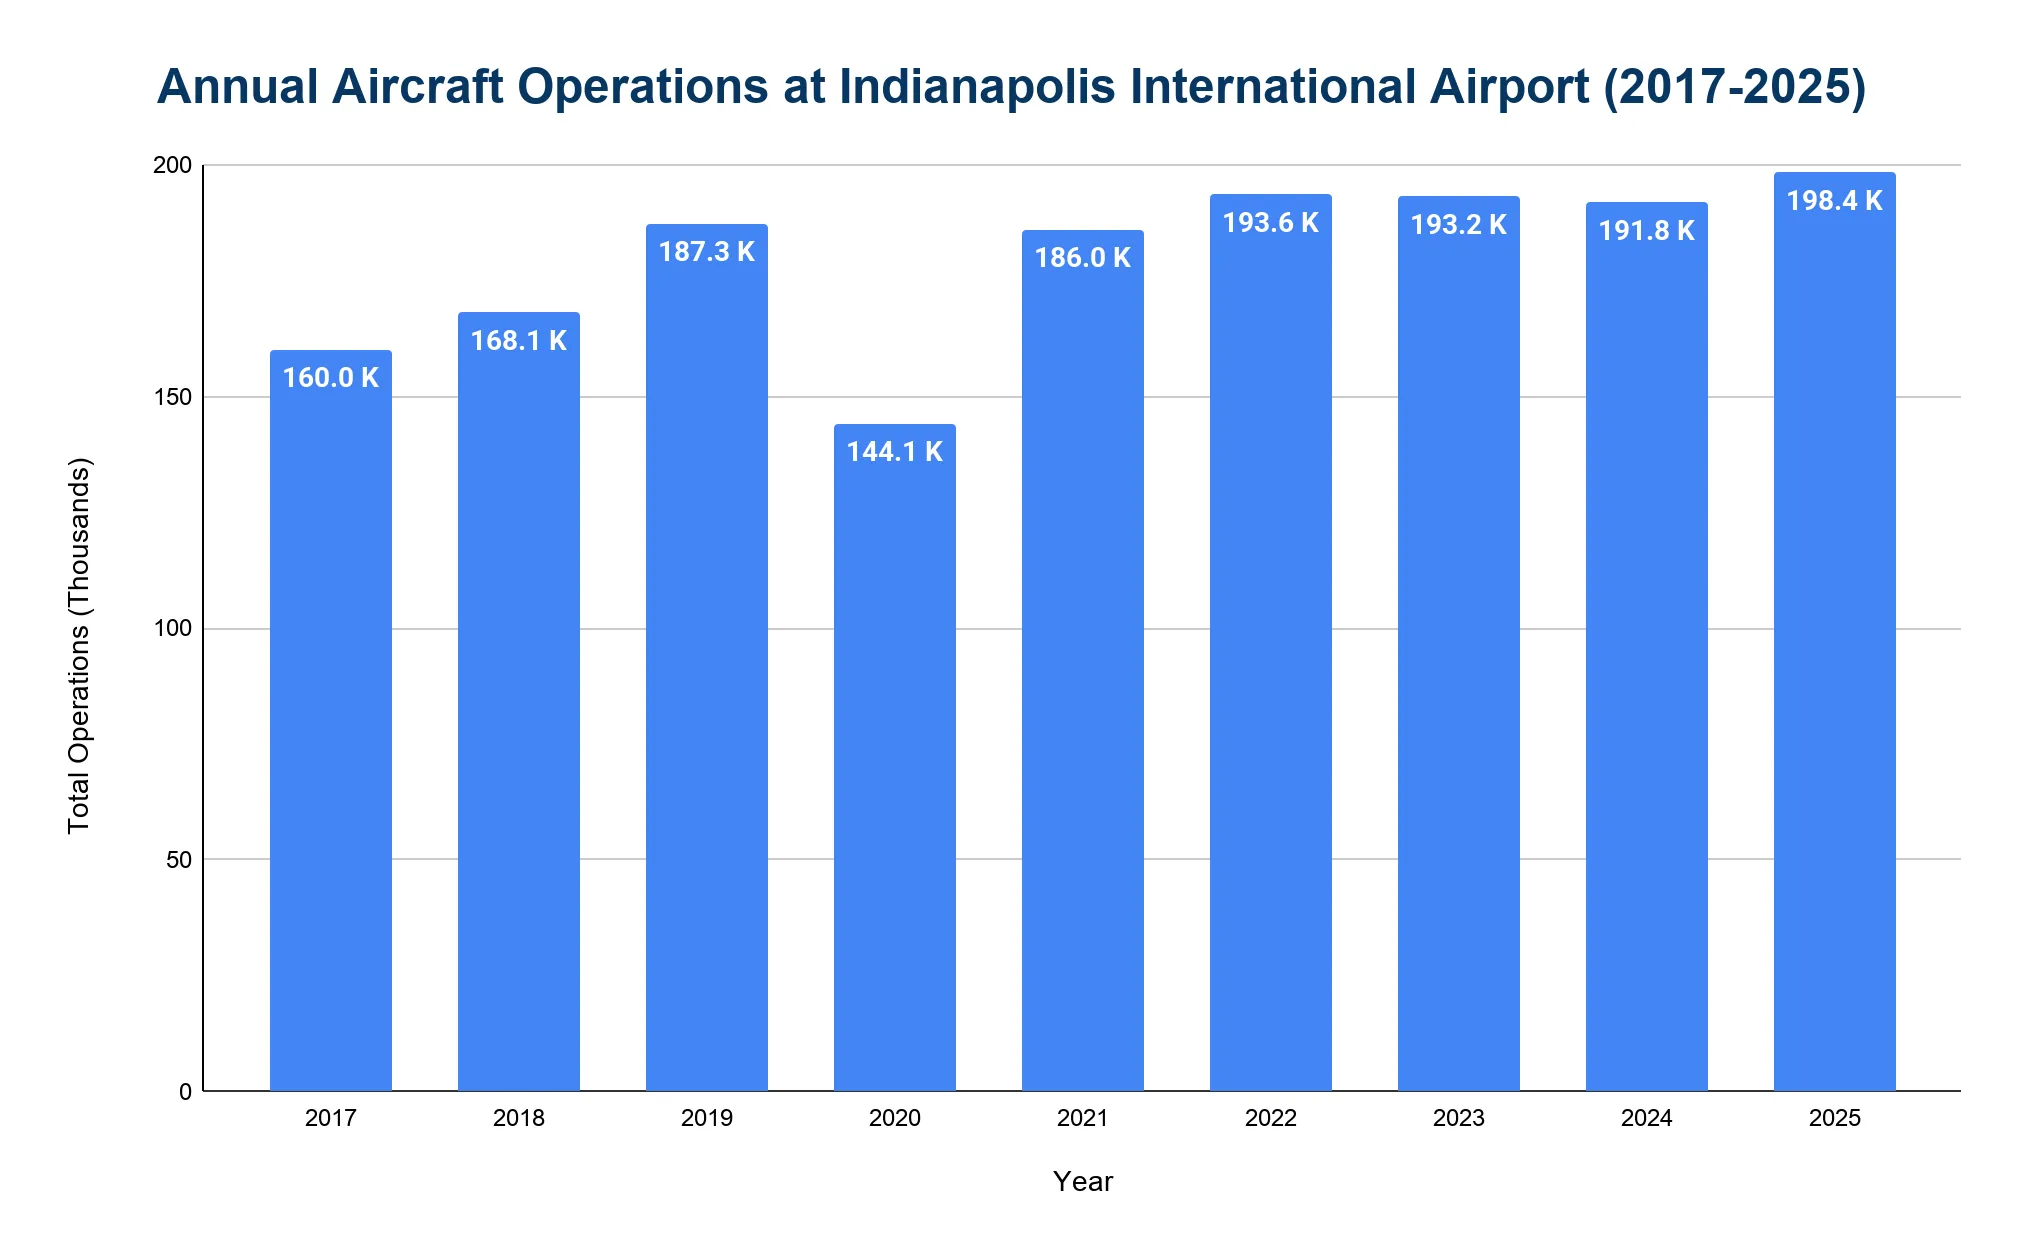
Indianapolis International Airport records more than 190,000 aircraft takeoffs and landings annually.
- In 2025, there were 198,391 aircraft movements, a 3.4% increase from 191,846 movements in 2024.
- In 2019, operations totaled 187,284, reflecting strong pre-pandemic activity.
- Movements dropped to 144,078 in 2020, the lowest point during the pandemic.
- Operations rebounded to 185,970 in 2021, 193,634 in 2022 and 193,220 in 2023 before slightly easing in 2024.
Types of Aircraft Operations
Air carrier flights make up the majority of operations at the airport.
- In 2025, air carrier operations accounted for 132,162 operations.
- Air taxi operations totaled 49,390.
- Civil itinerant flights contributed 15,806 operations, and military itinerant activity added 1,033.
| Aircraft Operation Types at Indianapolis International Airport (2019-2025) | ||||
|---|---|---|---|---|
| Year | Air Carrier | Air Taxi | Civil Itinerant | Military Itinerant |
| 2019 | 125,093 | 47,231 | 14,102 | 858 |
| 2020 | 92,360 | 41,035 | 9,953 | 730 |
| 2021 | 120,606 | 49,683 | 14,871 | 810 |
| 2022 | 128,293 | 47,744 | 16,609 | 988 |
| 2023 | 123,980 | 53,301 | 14,847 | 1,092 |
| 2024 | 125,139 | 50,620 | 14,909 | 1,178 |
| 2025 | 132,162 | 49,390 | 15,806 | 1,033 |
Which airlines dominate at Indianapolis International Airport?
Major carriers and low-cost airlines share IND's operations, with Southwest Airlines holding the largest market share, closely followed by American Airlines.
- In 2025, Southwest Airlines led with 27.8% of annual passenger volume (2.95 million passengers), followed by American Airlines with 24.7% (2.62 million passengers).
- Delta Air Lines held 18.3% (1.95 million passengers) and United Airlines accounted for 13.2% (1.4 million passengers).
- Spirit Airlines represented 5.6% with 592,871 passengers.
- Together, these top five airlines accounted for nearly 90% of passenger traffic at IND.
| Airlines' Market Share at Indianapolis International Airport (2025) | ||
|---|---|---|
| Airlines | Total Passengers | Market Share |
| Southwest | 2,951,421 | 27.8% |
| American | 2,623,011 | 24.7% |
| Delta | 1,945,688 | 18.3% |
| United | 1,396,104 | 13.2% |
| Spirit | 592,871 | 5.6% |
| Allegiant | 546,690 | 5.1% |
| Frontier | 263,434 | 2.5% |
| Alaska | 167,824 | 1.6% |
| Sun Country | 38,472 | 0.4% |
| Aer Lingus | 36,704 | 0.3% |
| Million | 29,996 | 0.3% |
| Air Canada | 21,804 | 0.2% |
| Other | 2,074 | 0.0% |
What are the monthly trends in passenger traffic at Indianapolis International Airport?
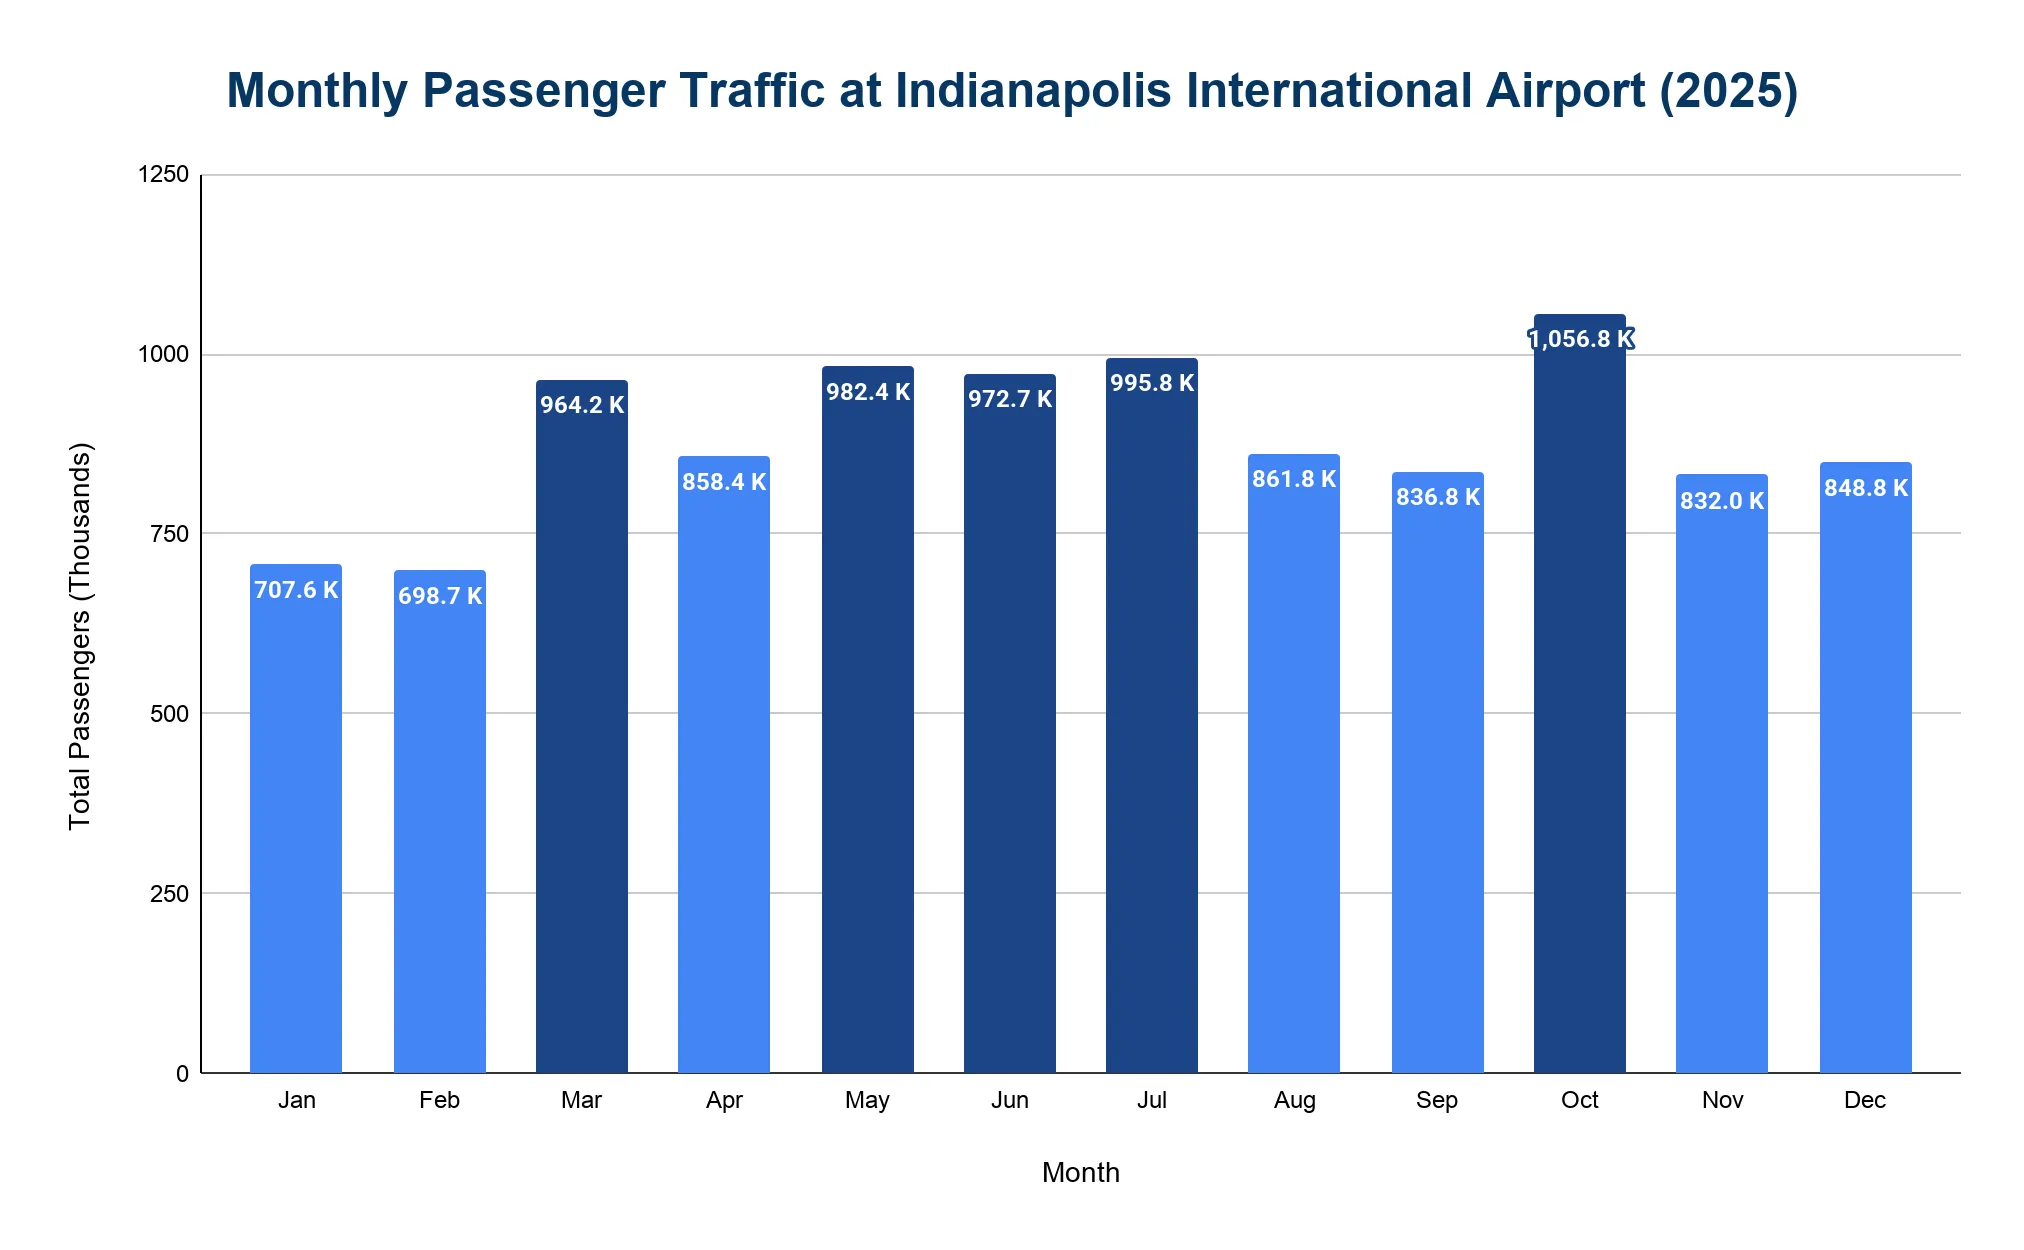
Passenger traffic at IND follows seasonal patterns, with the highest volumes in spring and summer.
- October was the busiest month of 2025 with 1.06 million passengers.
- July and May followed closely with 995,818 and 982,364 passengers.
- June recorded 972,707, while March had 964,216, showing consistent seasonal strength.
- January (707,581) and February (698,716) were the slowest months, reflecting typical post-holiday travel declines.
How many routes are there at Indianapolis International Airport?
- As of 2025, Indianapolis International Airport (IND) had approximately 55–57 nonstop routes/destinations, depending on the season and source reporting.
- Recent route additions have expanded connectivity to leisure and business destinations.
- The network includes major airline hubs and popular destinations, offering both business and leisure connections.
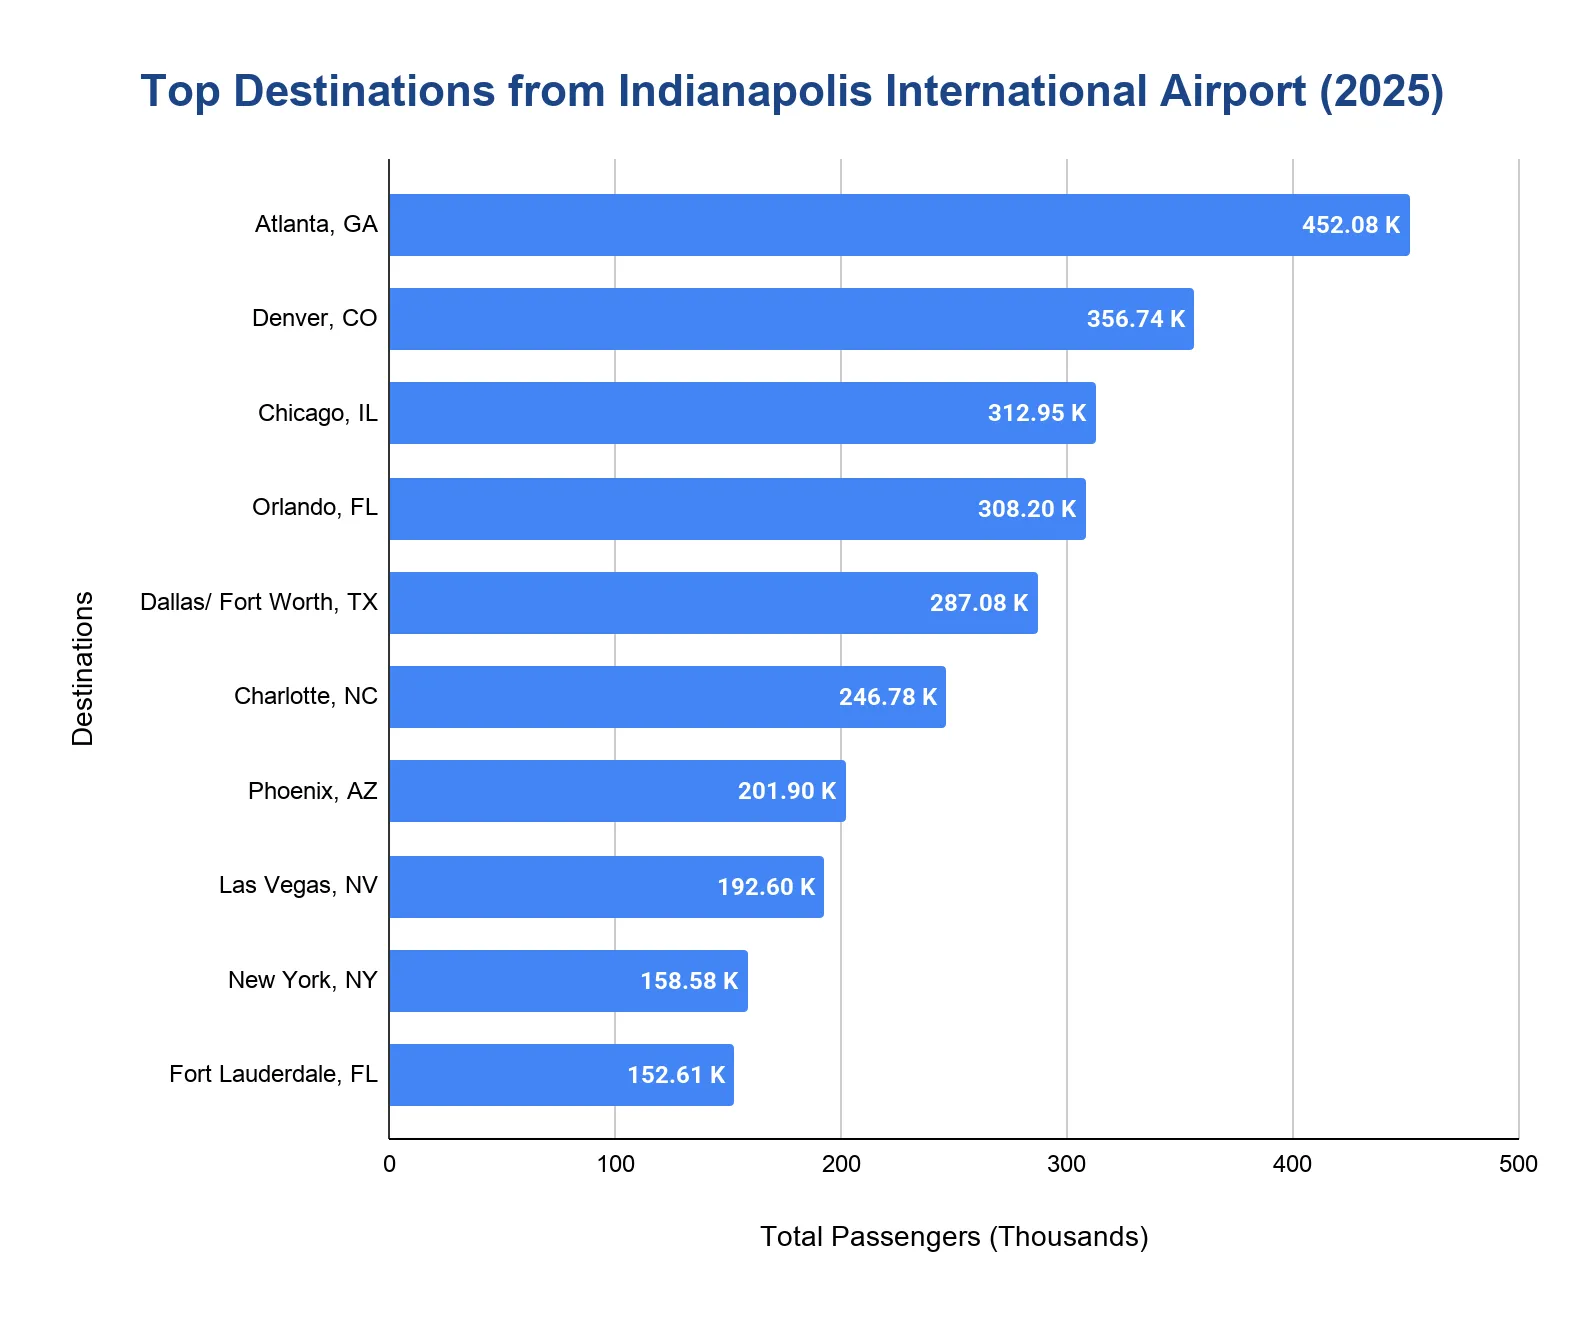
Which destinations are the most popular from Indianapolis International Airport?
- Atlanta (ATL) carried 452,080 passengers in 2025, making it the busiest route.
- Denver (DEN) served 356,740 passengers, maintaining its position as the second-busiest route.
- Chicago (ORD) handled 312,950 passengers, serving as an important hub for business and connecting traffic.
- Orlando (MCO) served 308,200 passengers and Dallas-Fort Worth (DFW) handled 287,080 passengers, completing the top 5 domestic destinations.
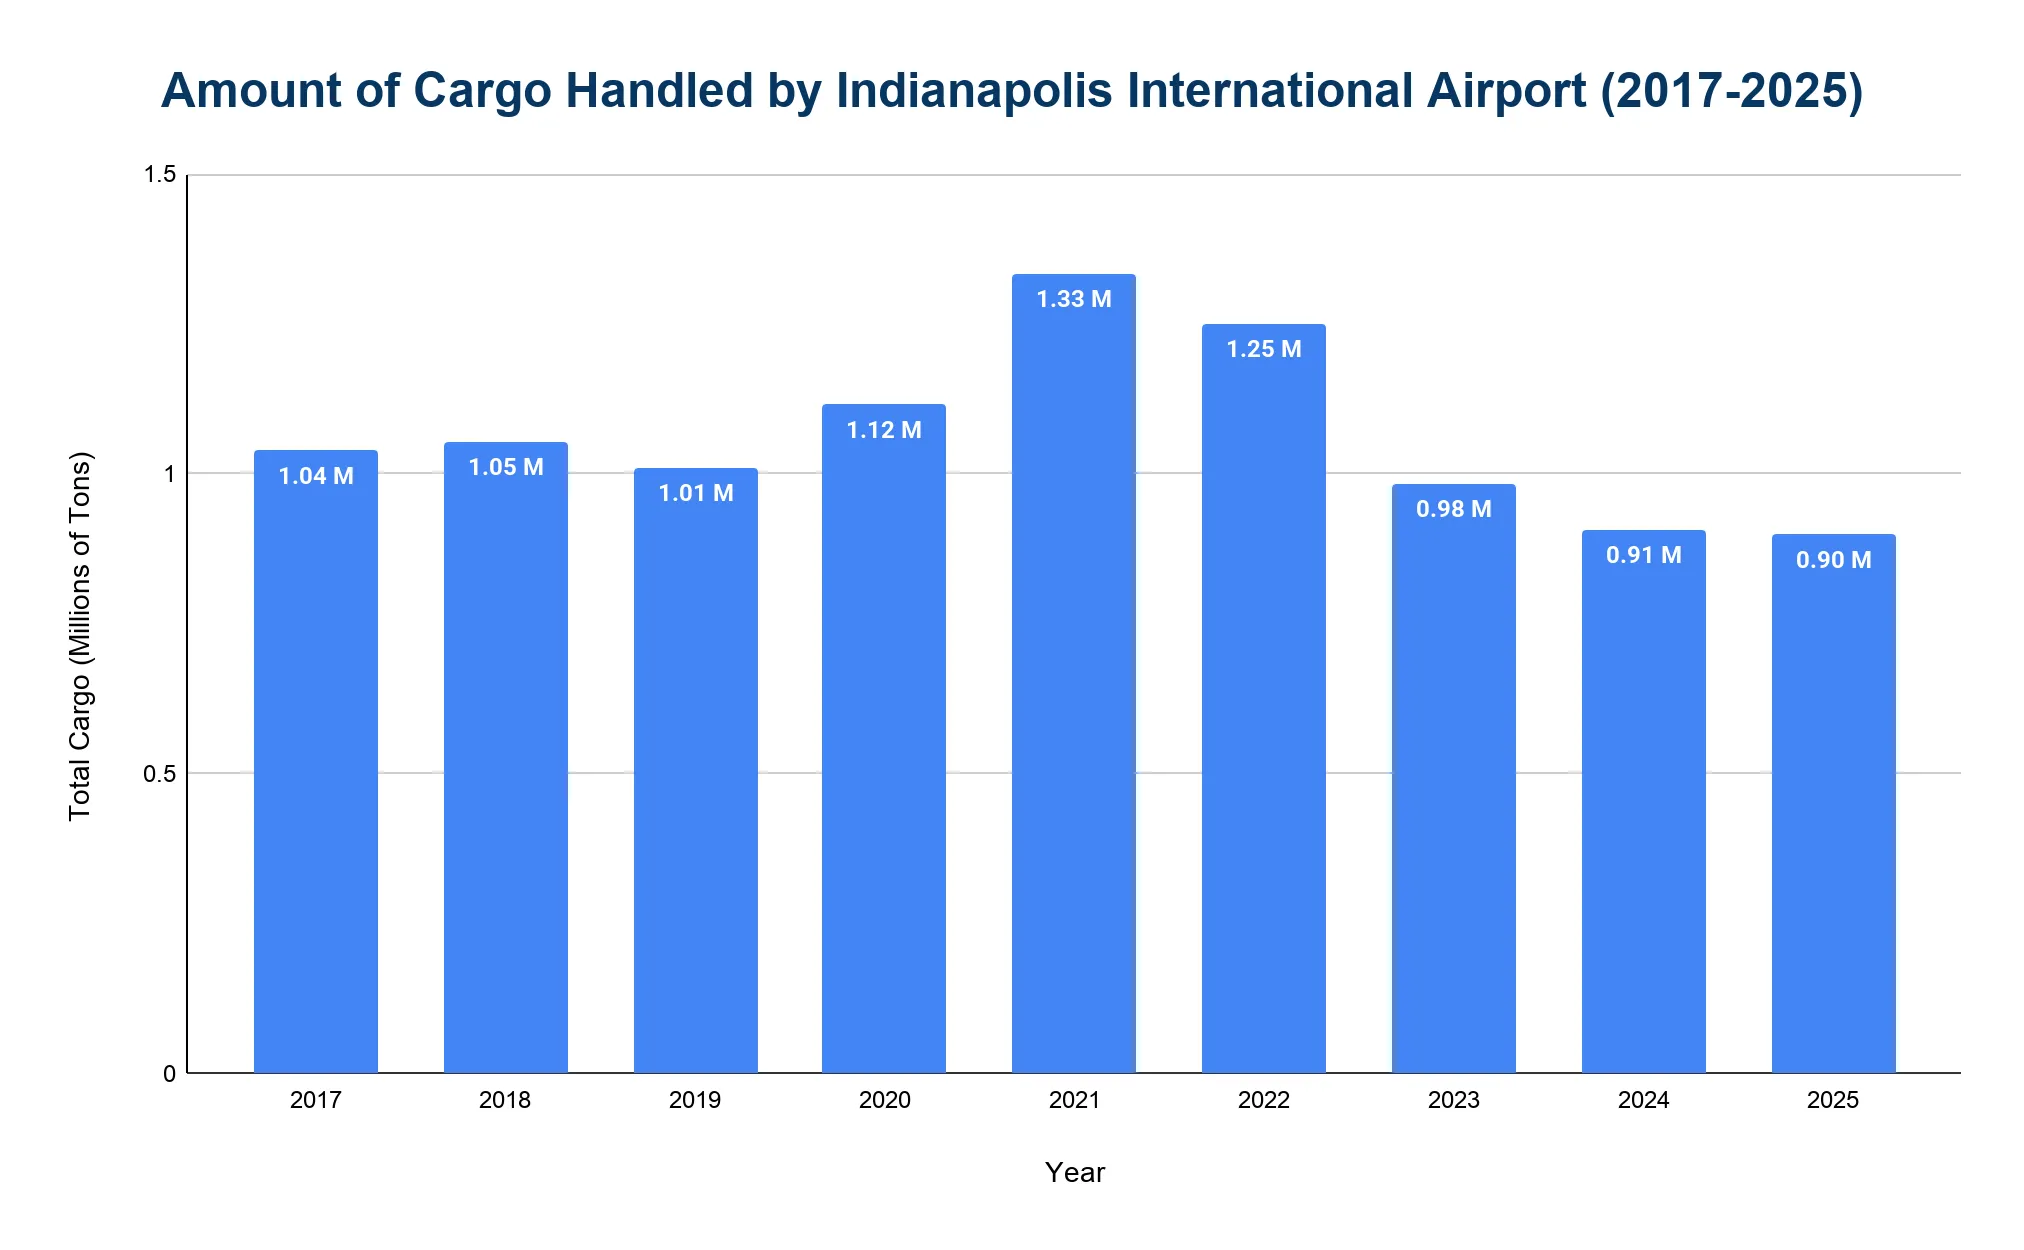
How much cargo does Indianapolis International Airport handle annually?
Indianapolis International Airport is one of the nation's busiest cargo hubs. Historically the airport handled over 1 million tons of cargo, but in recent years the volume went below a million.
- The airport handled 899,065 tons in 2025, a 0.97% decrease from 907,868 tons in 2024.
- Before the pandemic, 2019 saw 1.01 million tons, which grew to 1.12 million tons in 2020 as e-commerce demand surged.
- Cargo volumes peaked at 1.33 million tons in 2021 during the e-commerce boom, then moderated to 1.25 million tons in 2022 and 983,420 tons in 2023.
How many cancellations occur at Indianapolis International Airport annually?
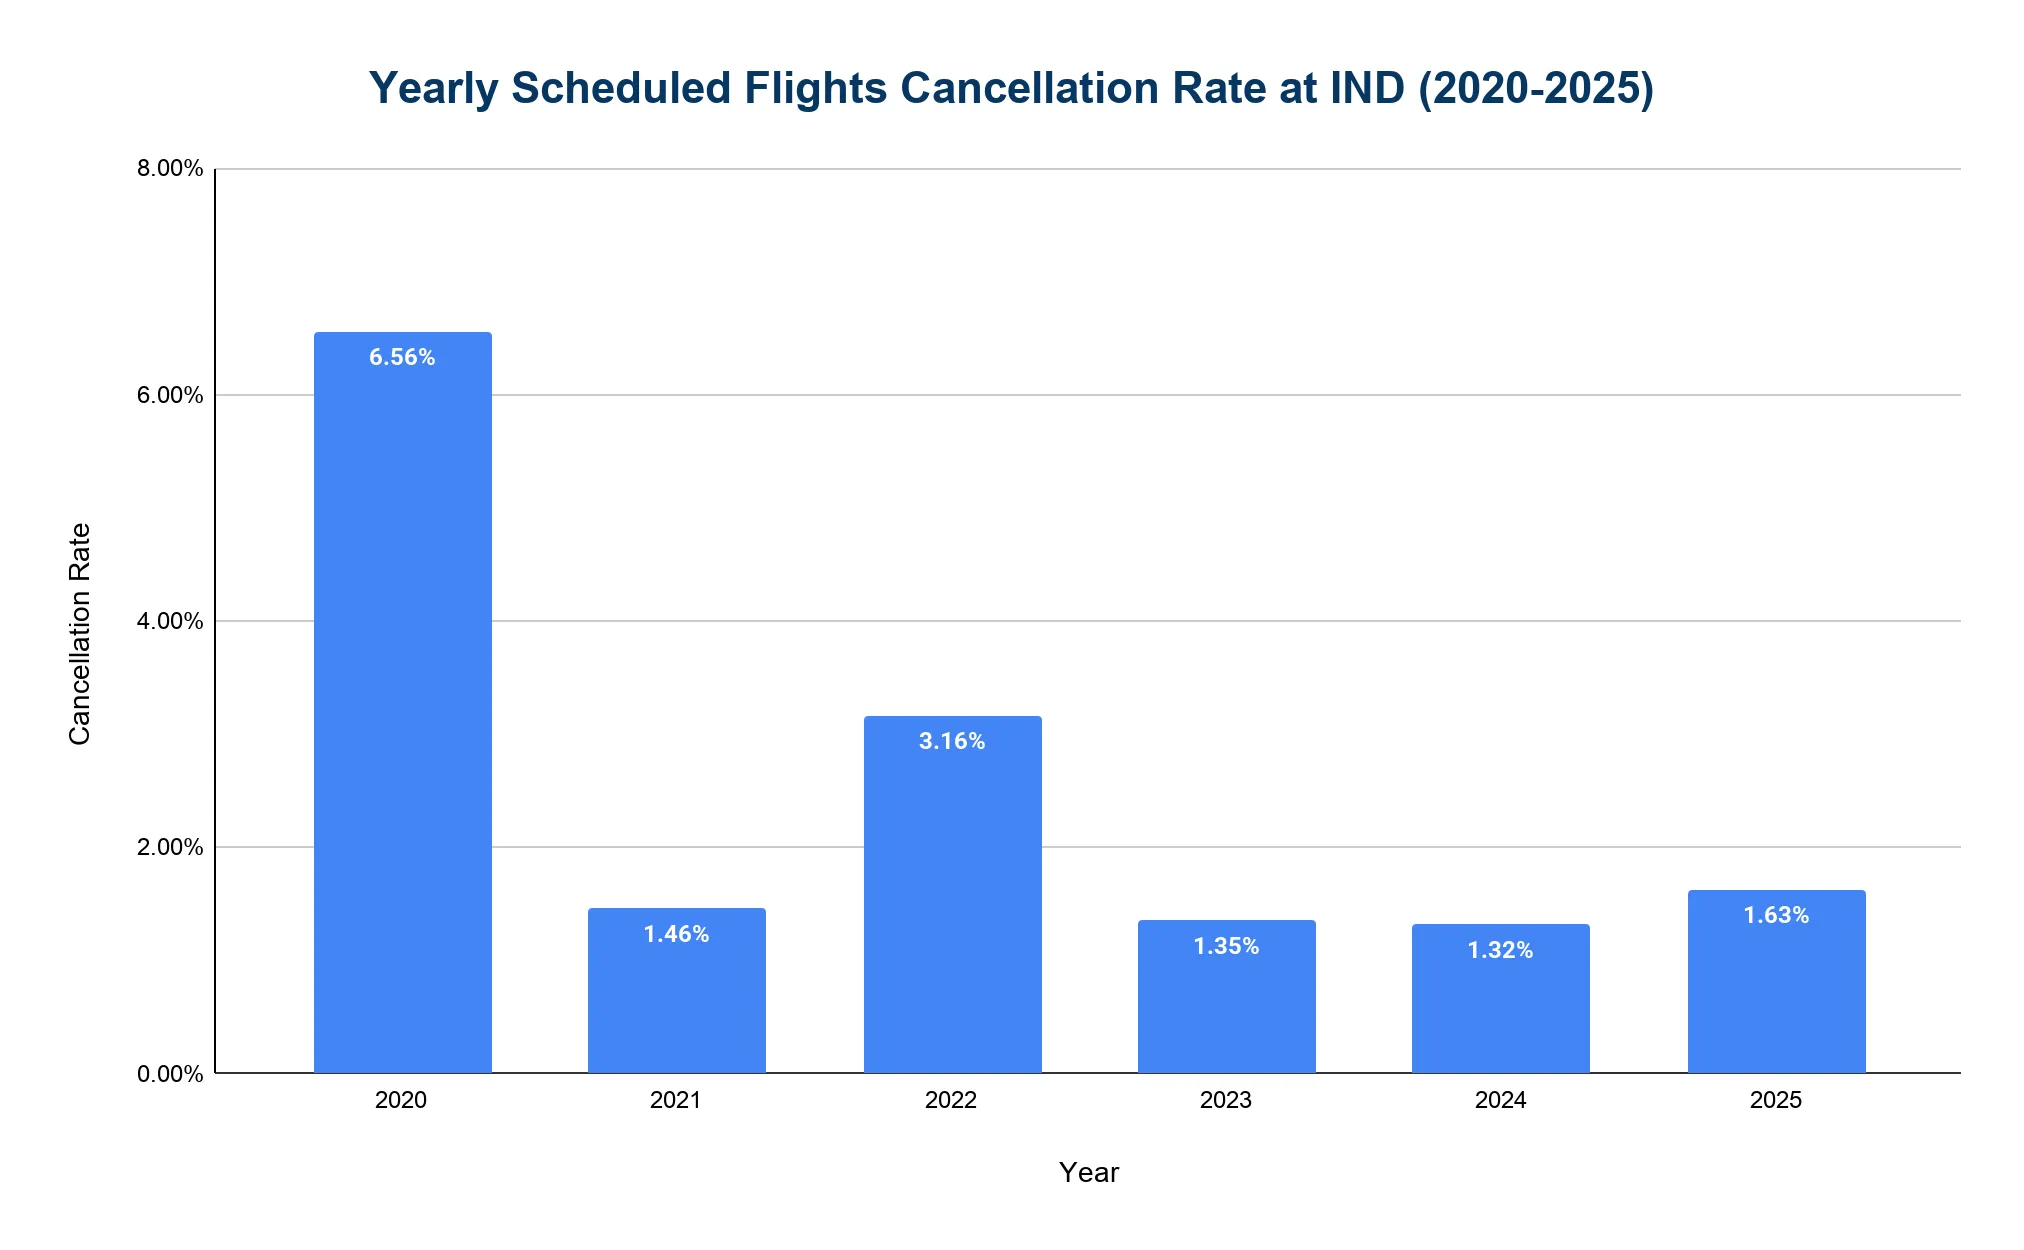
Flight cancellations at IND are generally low, typically around 1-2%.
- 1.63% of domestic flights were cancelled in 2025, a slight increase from 1.32% in 2024.
- The highest rate occurred in 2020, during the pandemic, when 6.56% of flights were cancelled due to reduced demand and operational disruptions.
- In 2021, the cancellation rate improved dramatically to 1.46% as operations normalized.
- The rate increased to 3.16% in 2022, reflecting industry-wide staffing challenges and operational issues.
- In 2023, 1.35% of flights were cancelled, showing improved reliability that continued into 2024.
What are the main causes of flight disruptions at Indianapolis International Airport?
- Midwest weather conditions, including winter snow, ice, and spring/summer thunderstorms requiring ground stops or diversions.
- Thunderstorms during summer months, causing delays both at IND and at connecting hub airports across the network.
- Airline operational issues including crew scheduling, aircraft mechanical issues, and air traffic management delays.
- Air traffic control delays at major hubs (Chicago, Atlanta, Denver) occasionally impact connecting flights.
- Seasonal weather patterns create predictable challenges, particularly January through March and during summer storm season.
How much revenue has Indianapolis International Airport generated each year?
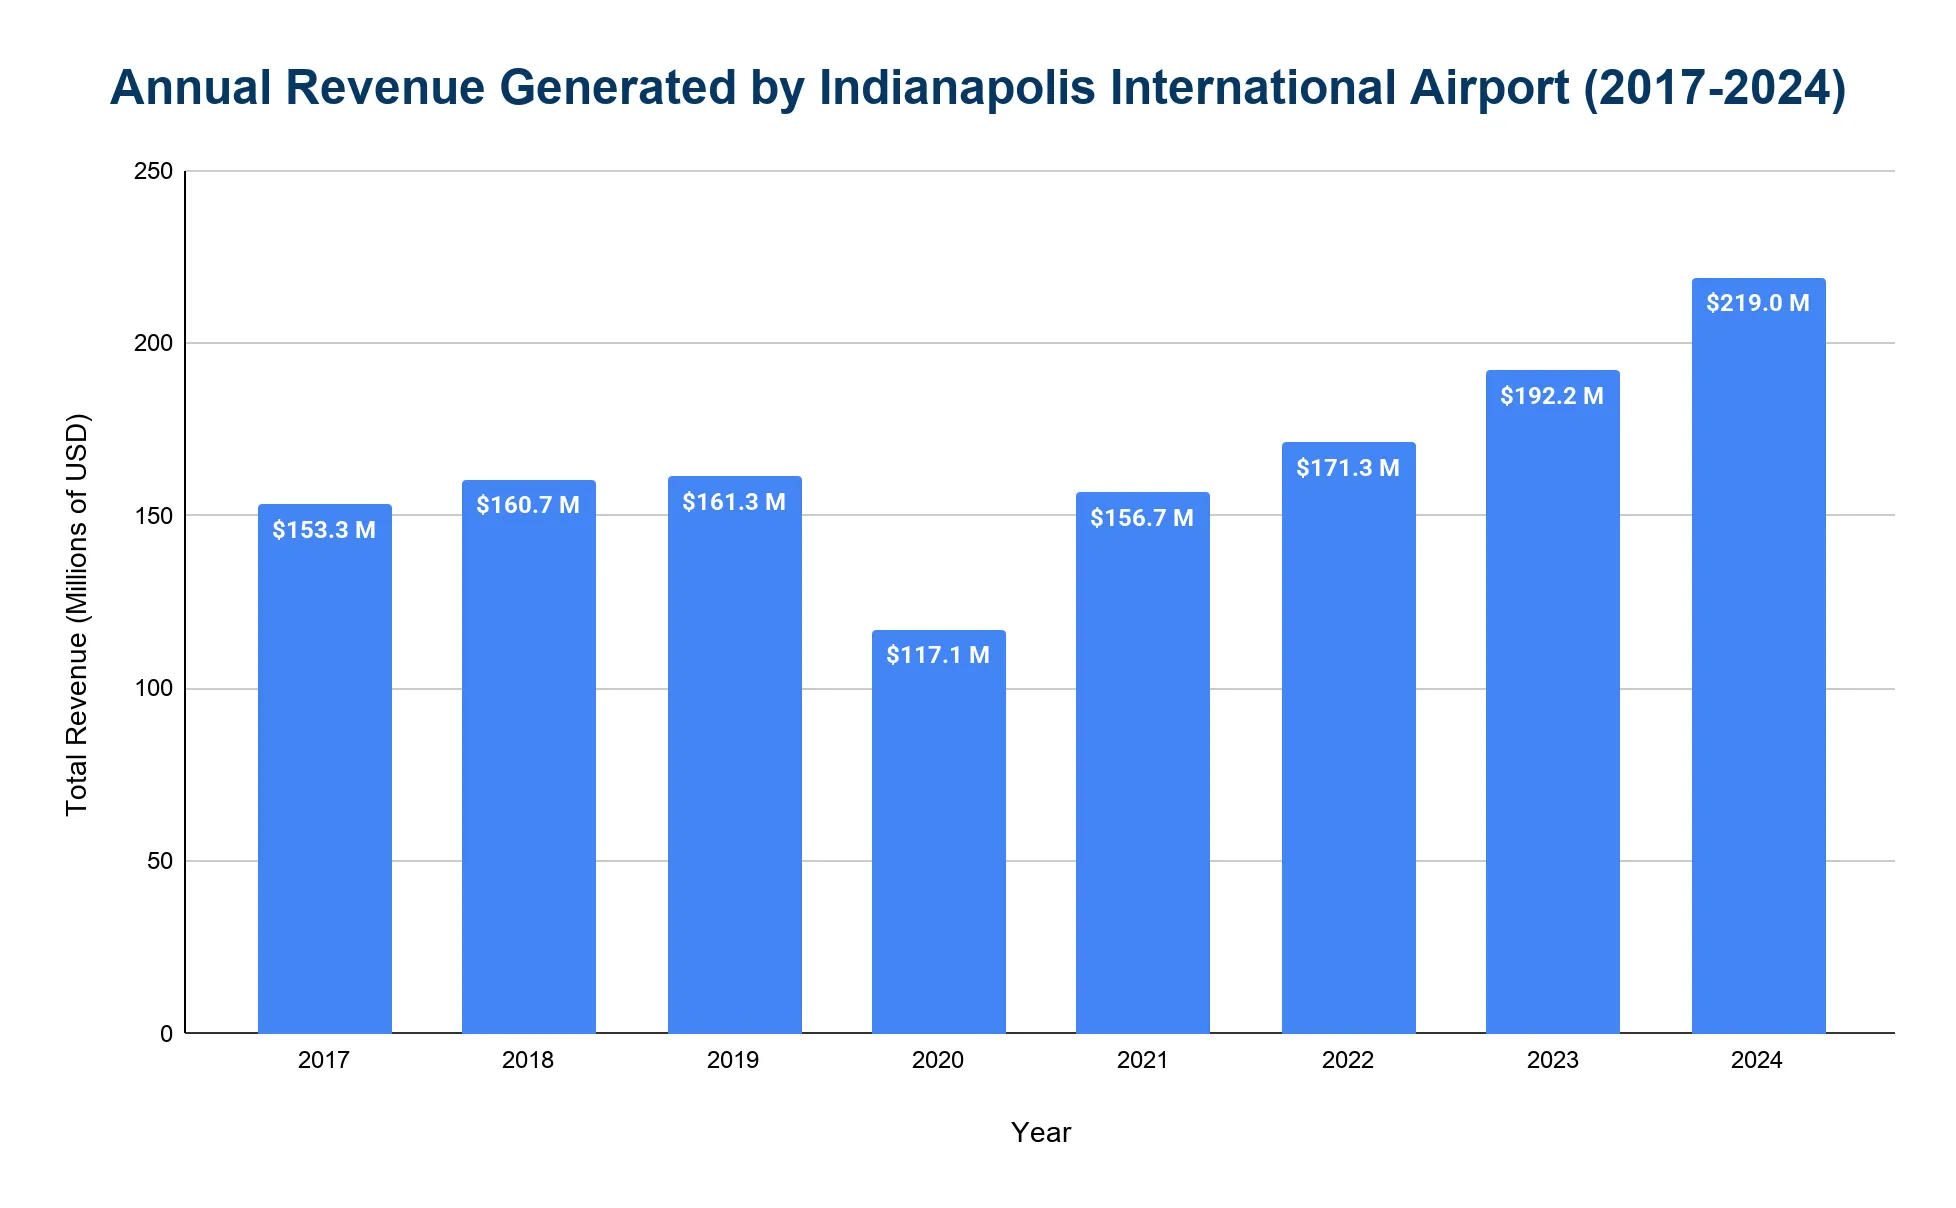
Indianapolis International Airport generates over $200 million in annual operating revenue.
- In 2024, operating revenue reached $219.0 million, an all-time high representing strong post-pandemic growth.
- Before the pandemic, 2019 revenue was $161.3 million.
- Revenue dropped to $117.1 million in 2020 due to pandemic impacts, then recovered steadily to $156.7 million in 2021, $171.3 million in 2022, and $192.2 million in 2023.
Related Travel Statistics
- Albany International Airport (ALB) Statistics
- Albuquerque International Sunport Statistics
- Fairbanks International Airport (FAI) Statistics
- Fayetteville Regional Airport Statistics
- Grand Junction Regional Airport (GJT) Statistics
- Harry Reid Airport (LAS) Statistics
- Jackson Airport (JAN) Statistics
- Los Angeles International Airport Statistics
- OKC Will Rogers Airport Statistics
- Pittsburgh Airport (PIT) Statistics
- San Francisco International Airport Statistics
- Santa Fe Regional Airport Statistics
What are the notable incidents at Indianapolis International Airport?
- February 2021: An Alaska Airlines flight diverted to IND after an engine failure. It landed safely and no injuries were reported.
- Safety Record: The airport has maintained a strong record with no fatal passenger aircraft incidents in recent decades.

