

 Popular Countries
 24/7 Support
Published Sep 9, 2026
Situated roughly 15 miles west of downtown Pittsburgh in Moon Township, Pennsylvania, Pittsburgh International Airport opened in 1992 with its distinctive midfield terminal design. Once a bustling US Airways hub in the late 1990s, the airport has since evolved into what is primarily an origin-and-destination facility serving the Pittsburgh metro area.
How many passengers use Pittsburgh International Airport each year?
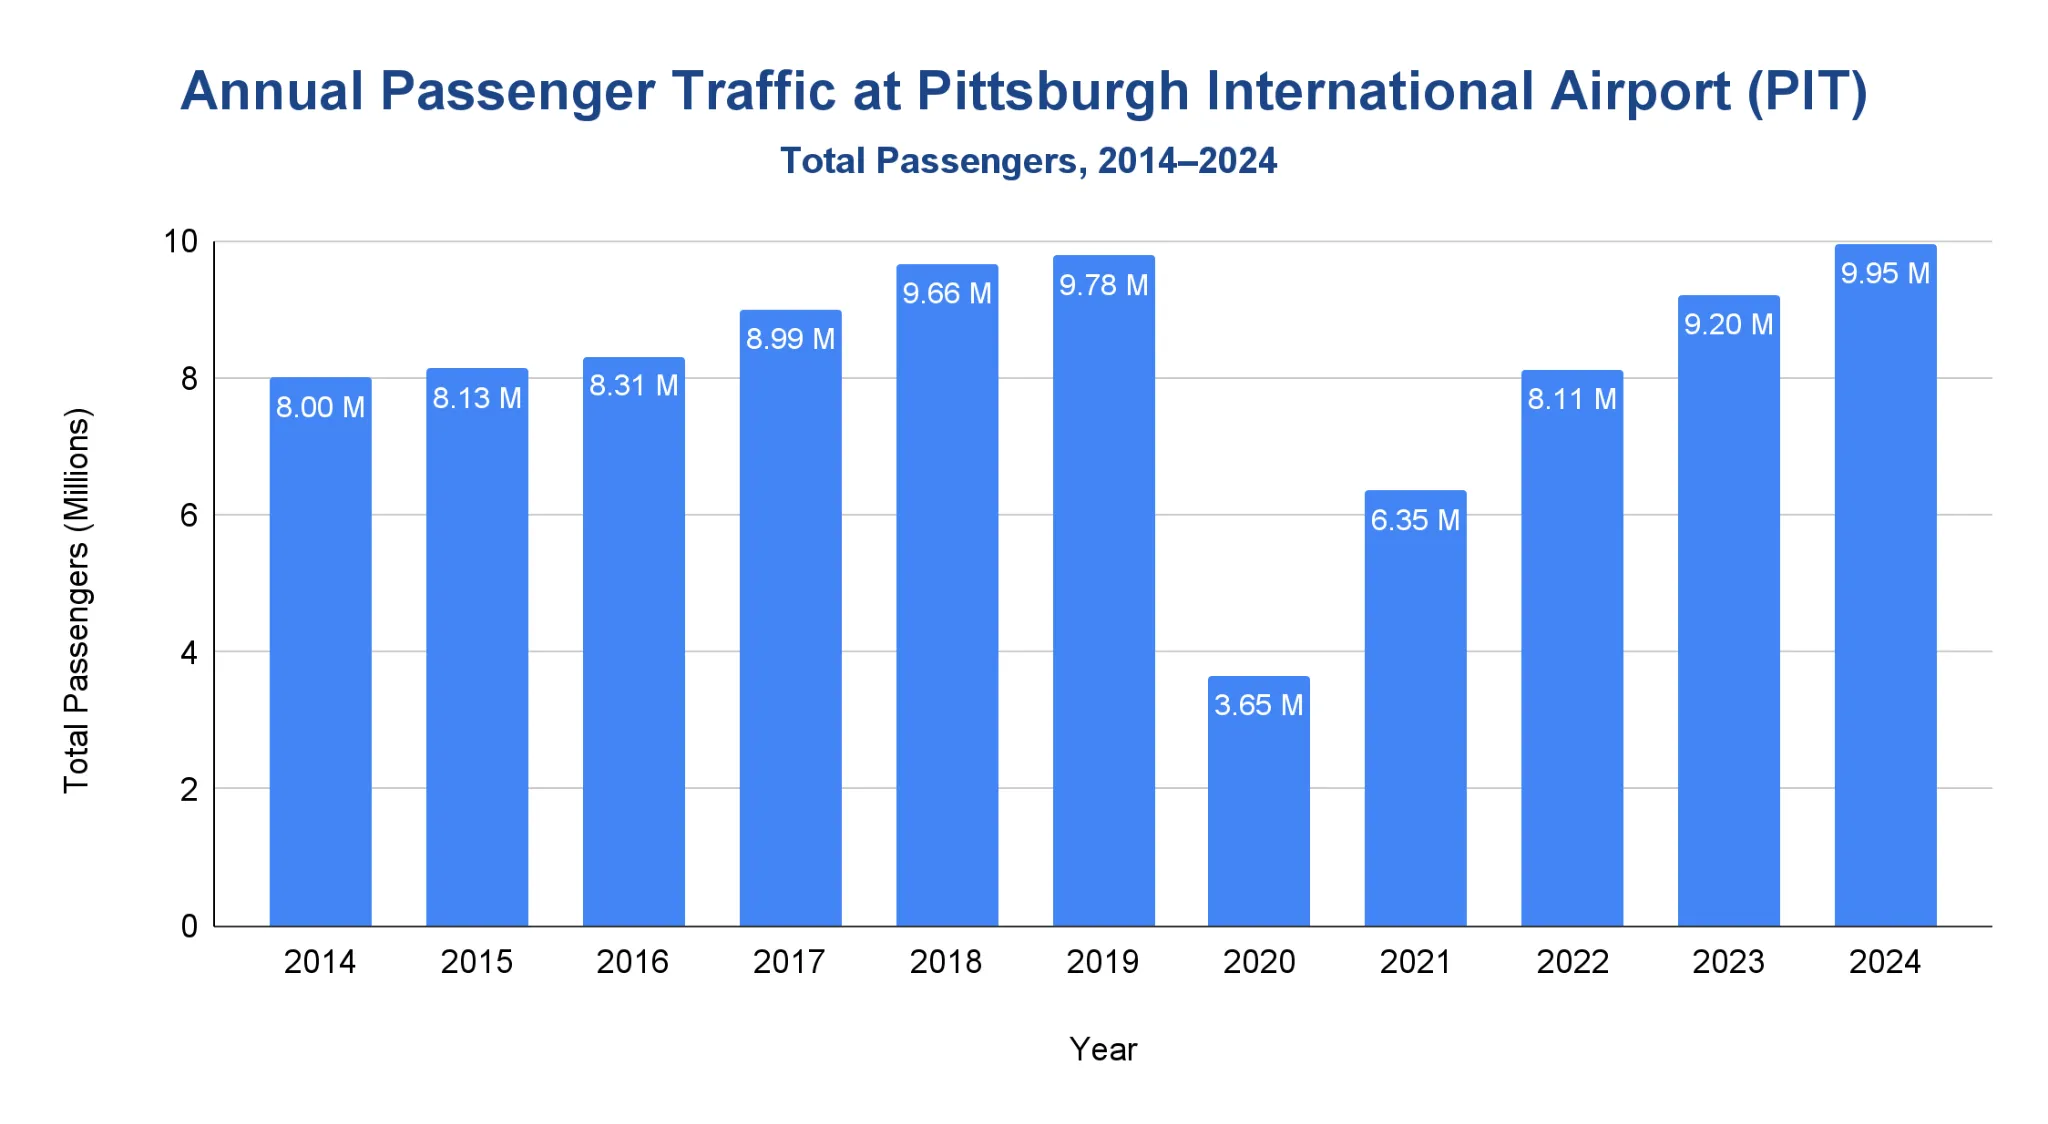
PIT handled 9.95 million passengers in 2024, the highest yearly total since 2006 and passing the pre-pandemic benchmark from 2019.
- Passenger numbers climbed steadily from 8 million in 2014 to 9.78 million in 2019.
- Then came the pandemic. Traffic cratered to 3.65 million in 2020 before bouncing back up to 6.35 million in 2021.
- The recovery picked up speed through 2022, which saw 8.11 million passengers - 83% of the figures seen in 2019, and continued in 2023 with 9.2 million (94% of 2019).
Note: Figures represent total enplaned and deplaned passengers. The original figures have been rounded for better readability.
Does Pittsburgh International Airport handle domestic and international flights?
Pittsburgh International Airport handles predominantly domestic traffic, with international flights representing a small share of overall passenger volumes.
- In 2017, PIT handled 8.73 million domestic passengers compared with 256 thousand international passengers.
- International traffic reached a high point in 2018, when the airport recorded 290 thousand international passengers out of 9.66 million total.
- During the pandemic, international volumes dropped sharply to 39 thousand in 2020 and 44 thousand in 2021, while domestic traffic also declined.
- As travel recovered, international passenger counts rose to 126 thousand in 2022 and 182 thousand in 2023, alongside strong domestic growth.
- In 2024, the airport served approximately 9.75 million domestic passengers and 195 thousand international passengers (calculated), with international travel accounting for about 2% of total traffic (calculated).
| Domestic vs. International Passengers by Year | |||
|---|---|---|---|
| Year | Total Passengers (Millions) | Domestic (Millions) | International (Thousands) |
| 2017 | 8.99 | 8.73 | 256 |
| 2018 | 9.66 | 9.37 | 290 |
| 2019 | 9.78 | 9.54 | 243 |
| 2020 | 3.65 | 3.61 | 39 |
| 2021 | 6.35 | 6.31 | 44 |
| 2022 | 8.11 | 7.99 | 126 |
| 2023 | 9.20 | 9.01 | 182 |
| 2024 | 9.95 | 9.75 | 195 |
Source · Note: International passengers are defined as those requiring customs and immigration clearance. Percentages referenced above are calculated from published ACAA totals, and all figures are rounded for readability.
How many aircraft operations occur at Pittsburgh International Airport each year?
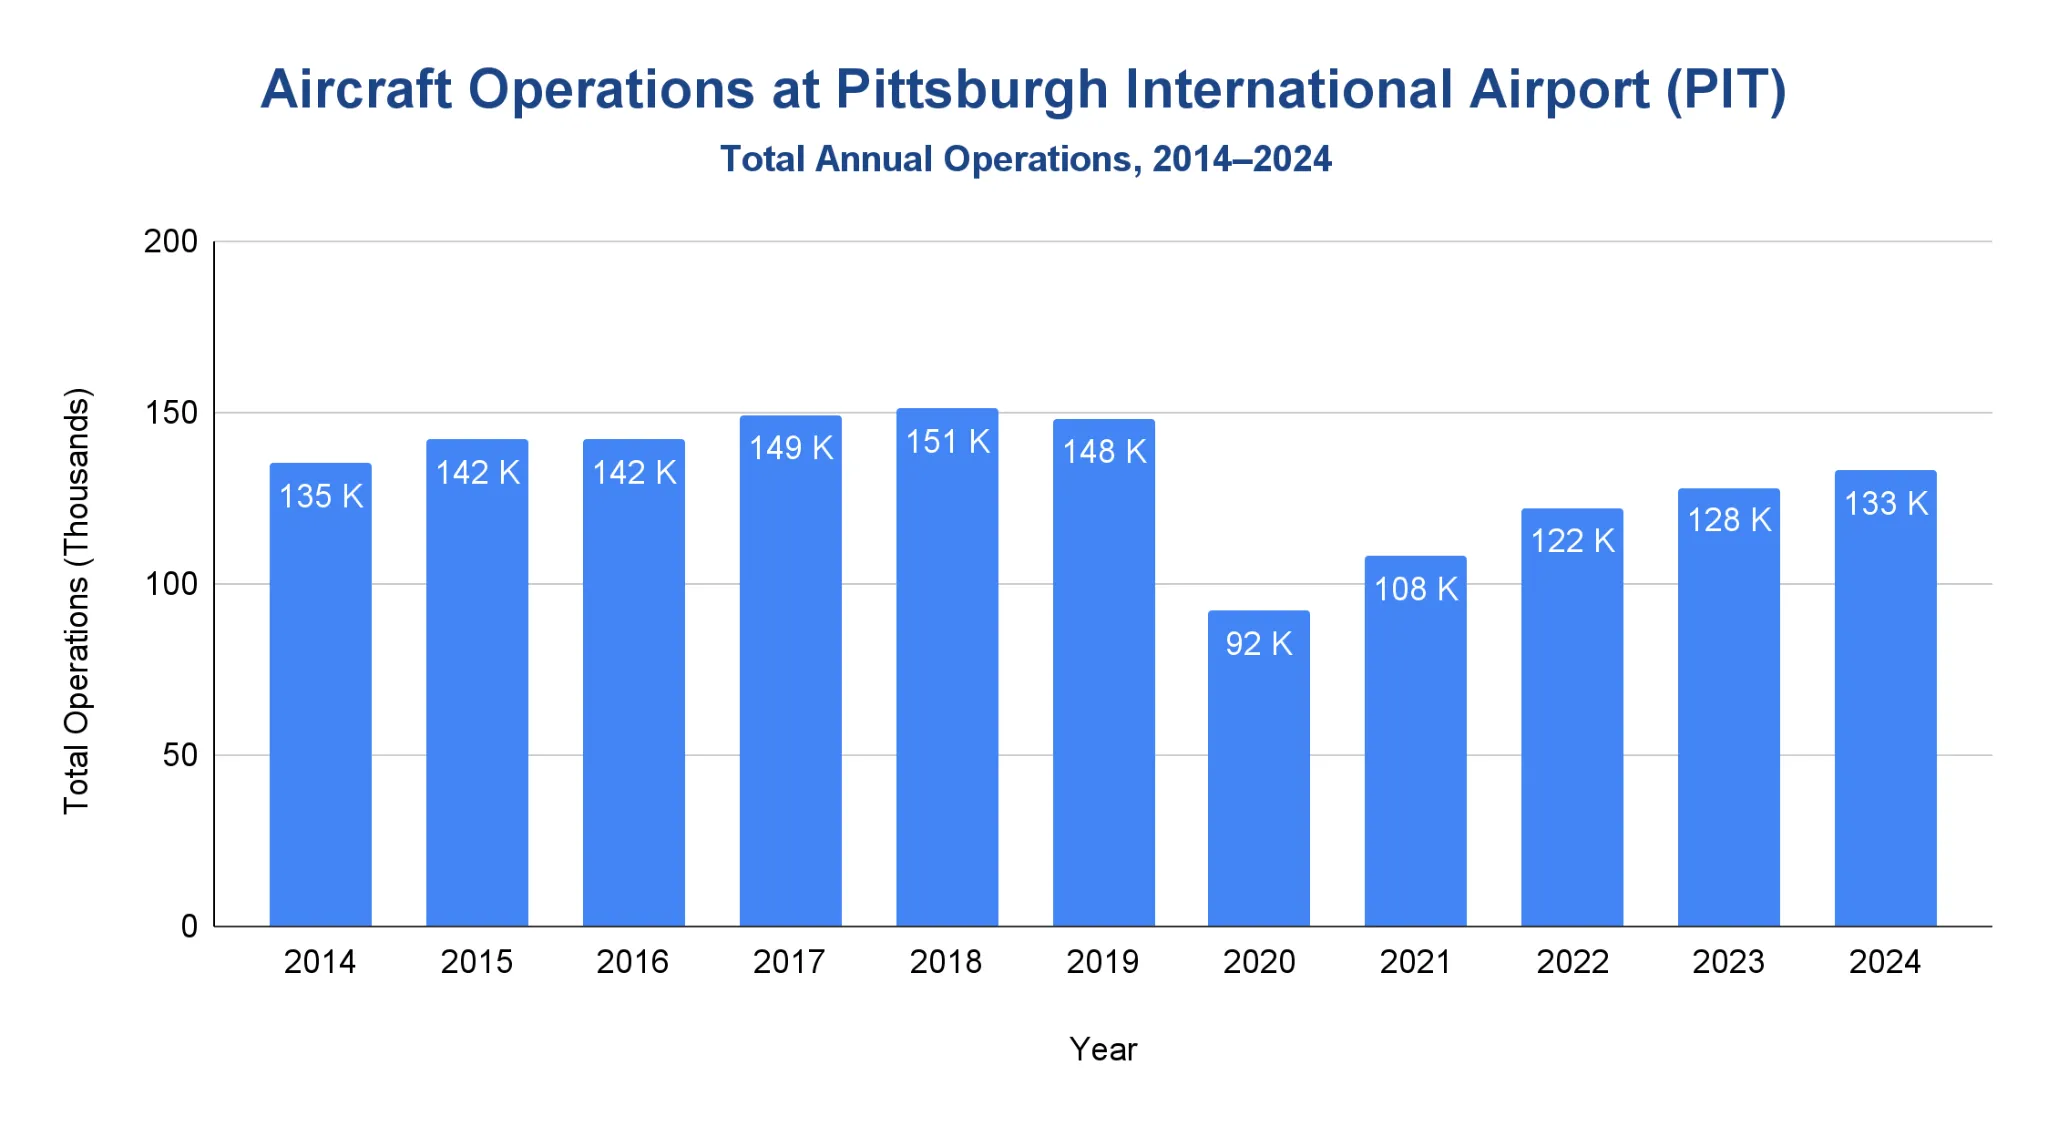
Pittsburgh International Airport recorded 132,756 aircraft operations in 2024, which is about 89.6% of 2019 levels.
- Operations peaked at 151,414 in 2018 before easing to 148,119 in 2019.
- During the pandemic, movements fell sharply to 91,803 in 2020.
- Activity rebounded through the recovery period, reaching 121,650 in 2022 and 128,175 in 2023.
- By 2024, PIT returned to 132,756 operations, still below the late-2010s peak but well above 2020.
Note: Figures represent total annual aircraft operations. Percent comparisons are calculated from ACAA annual totals.
Which airlines carry the most passengers at Pittsburgh International Airport?
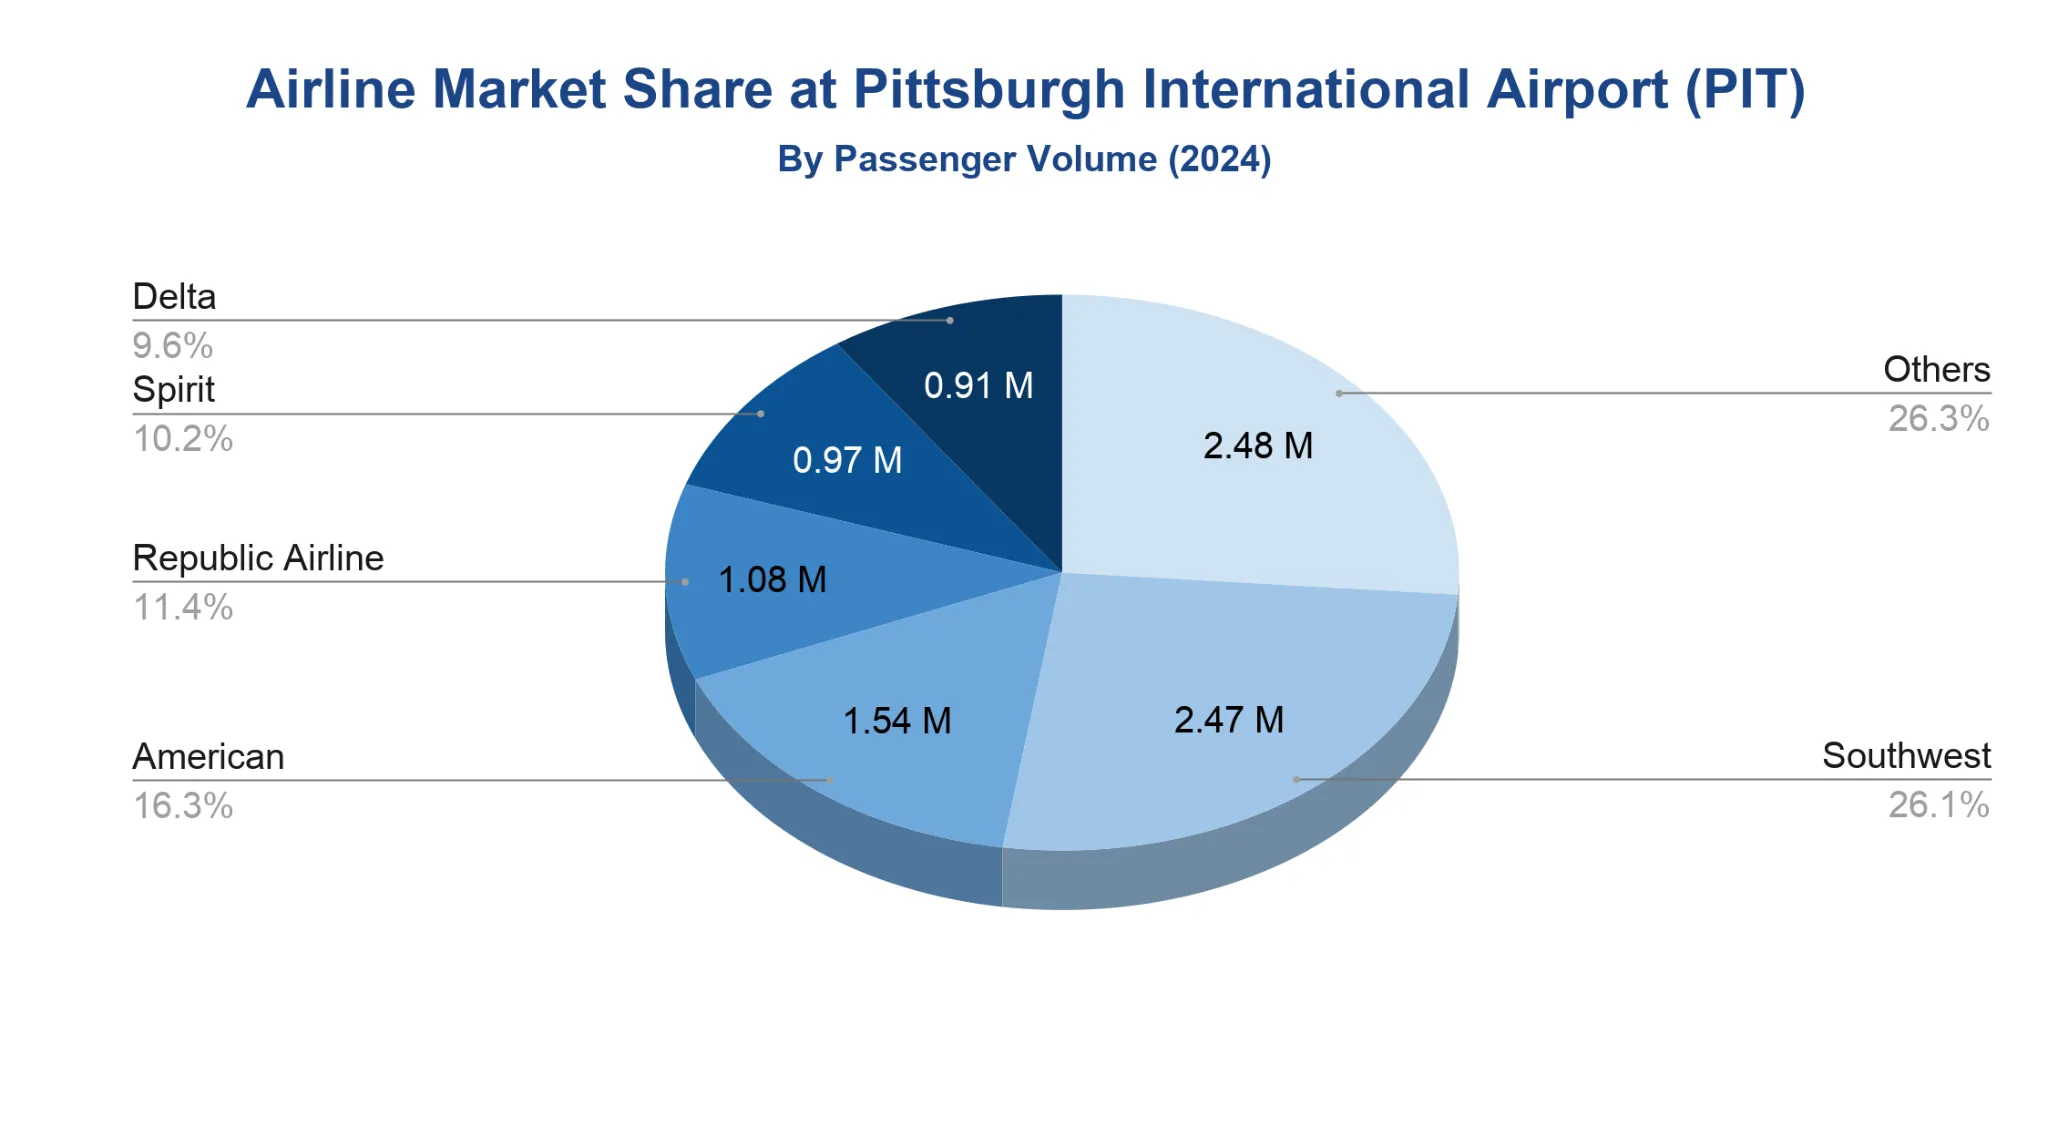
Southwest Airlines led Pittsburgh International Airport in 2024, carrying 2.47 million passengers and taking a 26.13% share of traffic.
- American placed second at 16.31%, well in front of the next tier of carriers.
- The middle of the market was tightly grouped, with Republic (11.44%), Spirit (10.24%), and Delta (9.61%) each clustered around the low-teens.
- Other carriers collectively matched Southwest’s scale, totaling 26.27%, which shows PIT’s traffic is spread across a long tail beyond the top five.
Note: Source BTS. Enplaned passengers = arriving + departing, January–December 2024.
What are the most popular destinations from Pittsburgh International Airport?
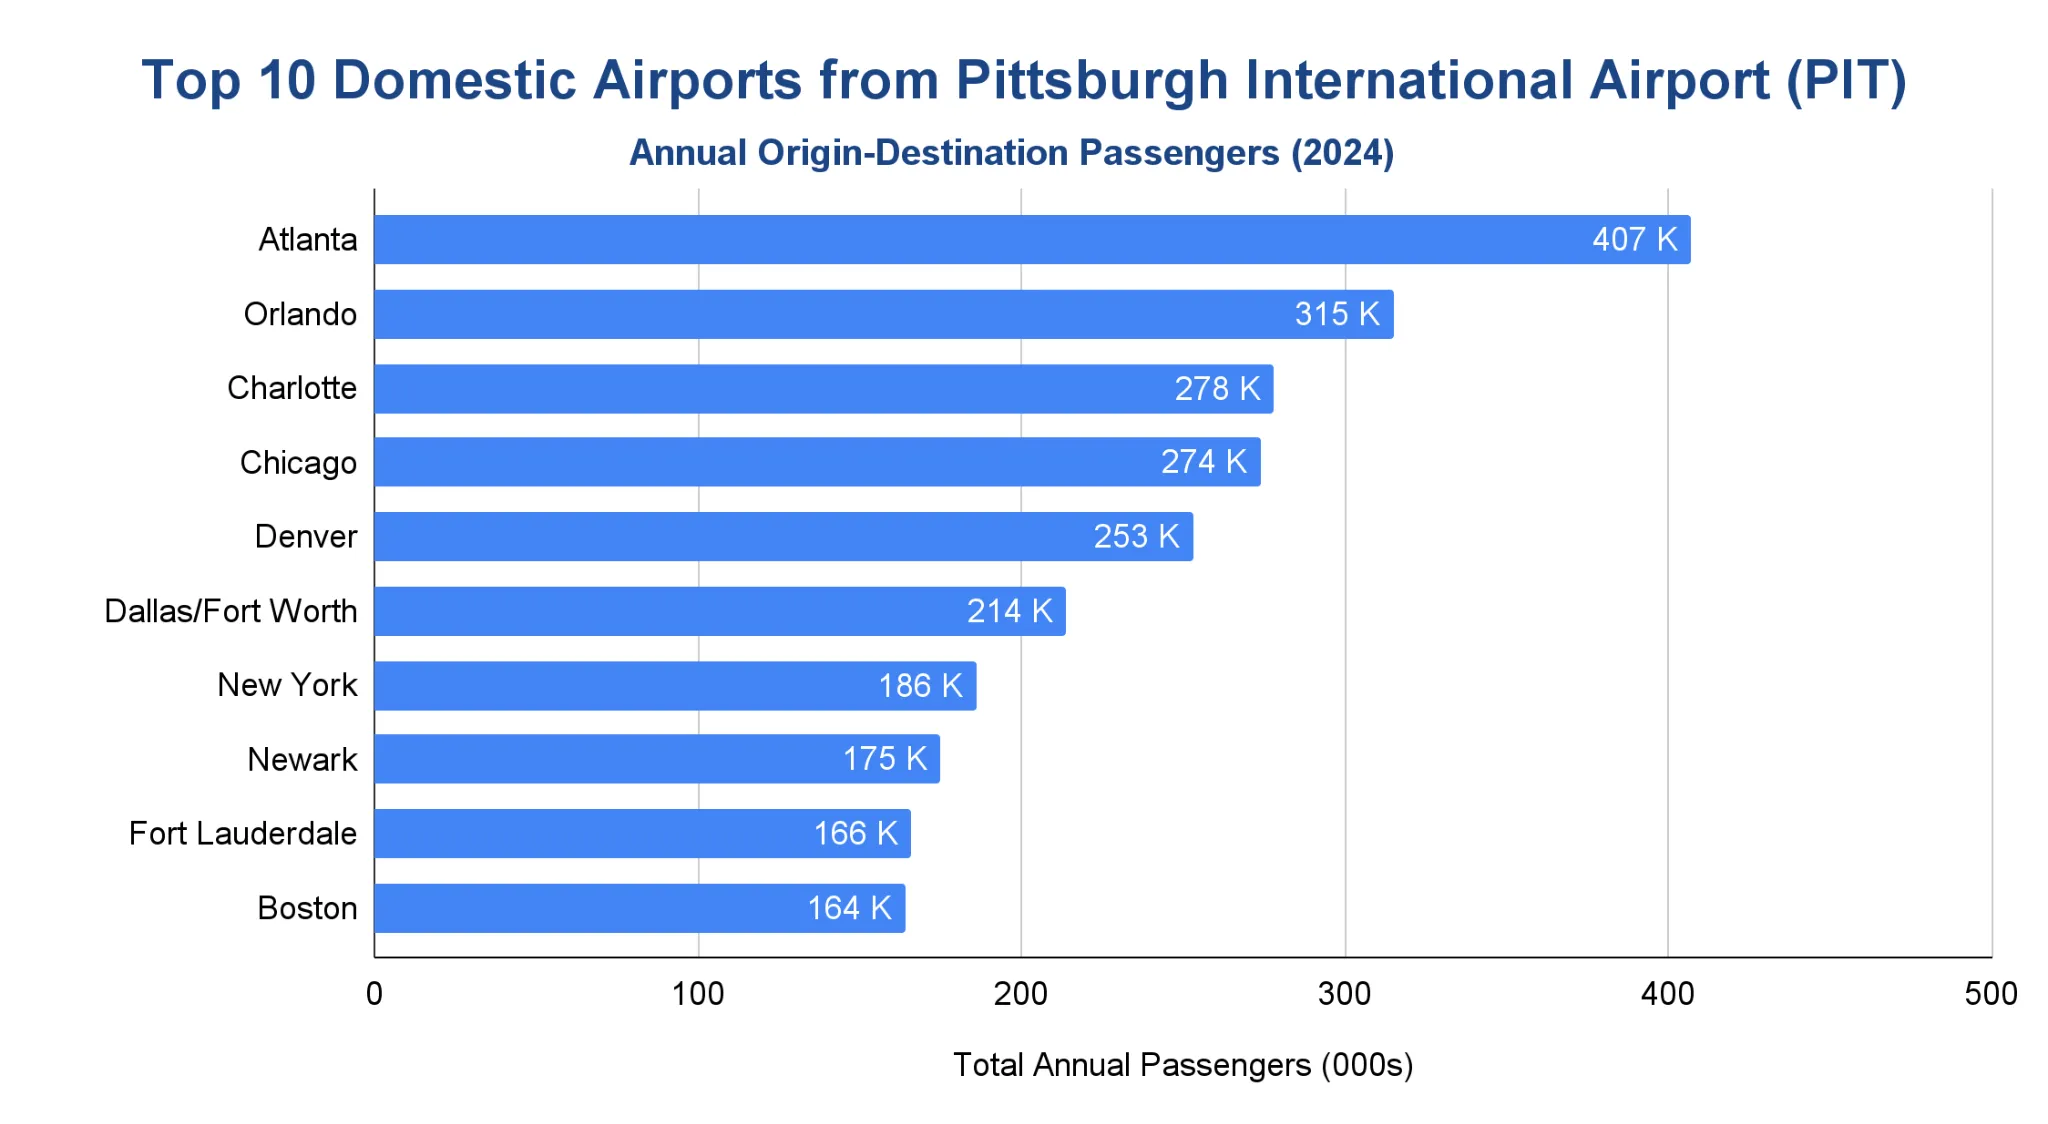
Atlanta ranked as the busiest destination from Pittsburgh International Airport in 2024, followed by Orlando and Charlotte.
- Atlanta led all destinations with 407,000 passengers.
- Orlando ranked second at 315,000, highlighting the strength of year-round leisure demand from western Pennsylvania.
- Charlotte (278,000) and Chicago (274,000) formed the next tier, both serving as key hub gateways for onward domestic connections.
- Denver rounded out the top five with 253,000 passengers, reflecting strong transcontinental and Mountain West connectivity.
- The remainder of the top ten mixed large hubs (Dallas/Fort Worth, Newark) with major leisure and business markets (Fort Lauderdale, Boston, New York).
Note: Passenger figures are from BTS T-100 Domestic Market (U.S. carriers) and represent annual passengers (000) for January–December 2024.
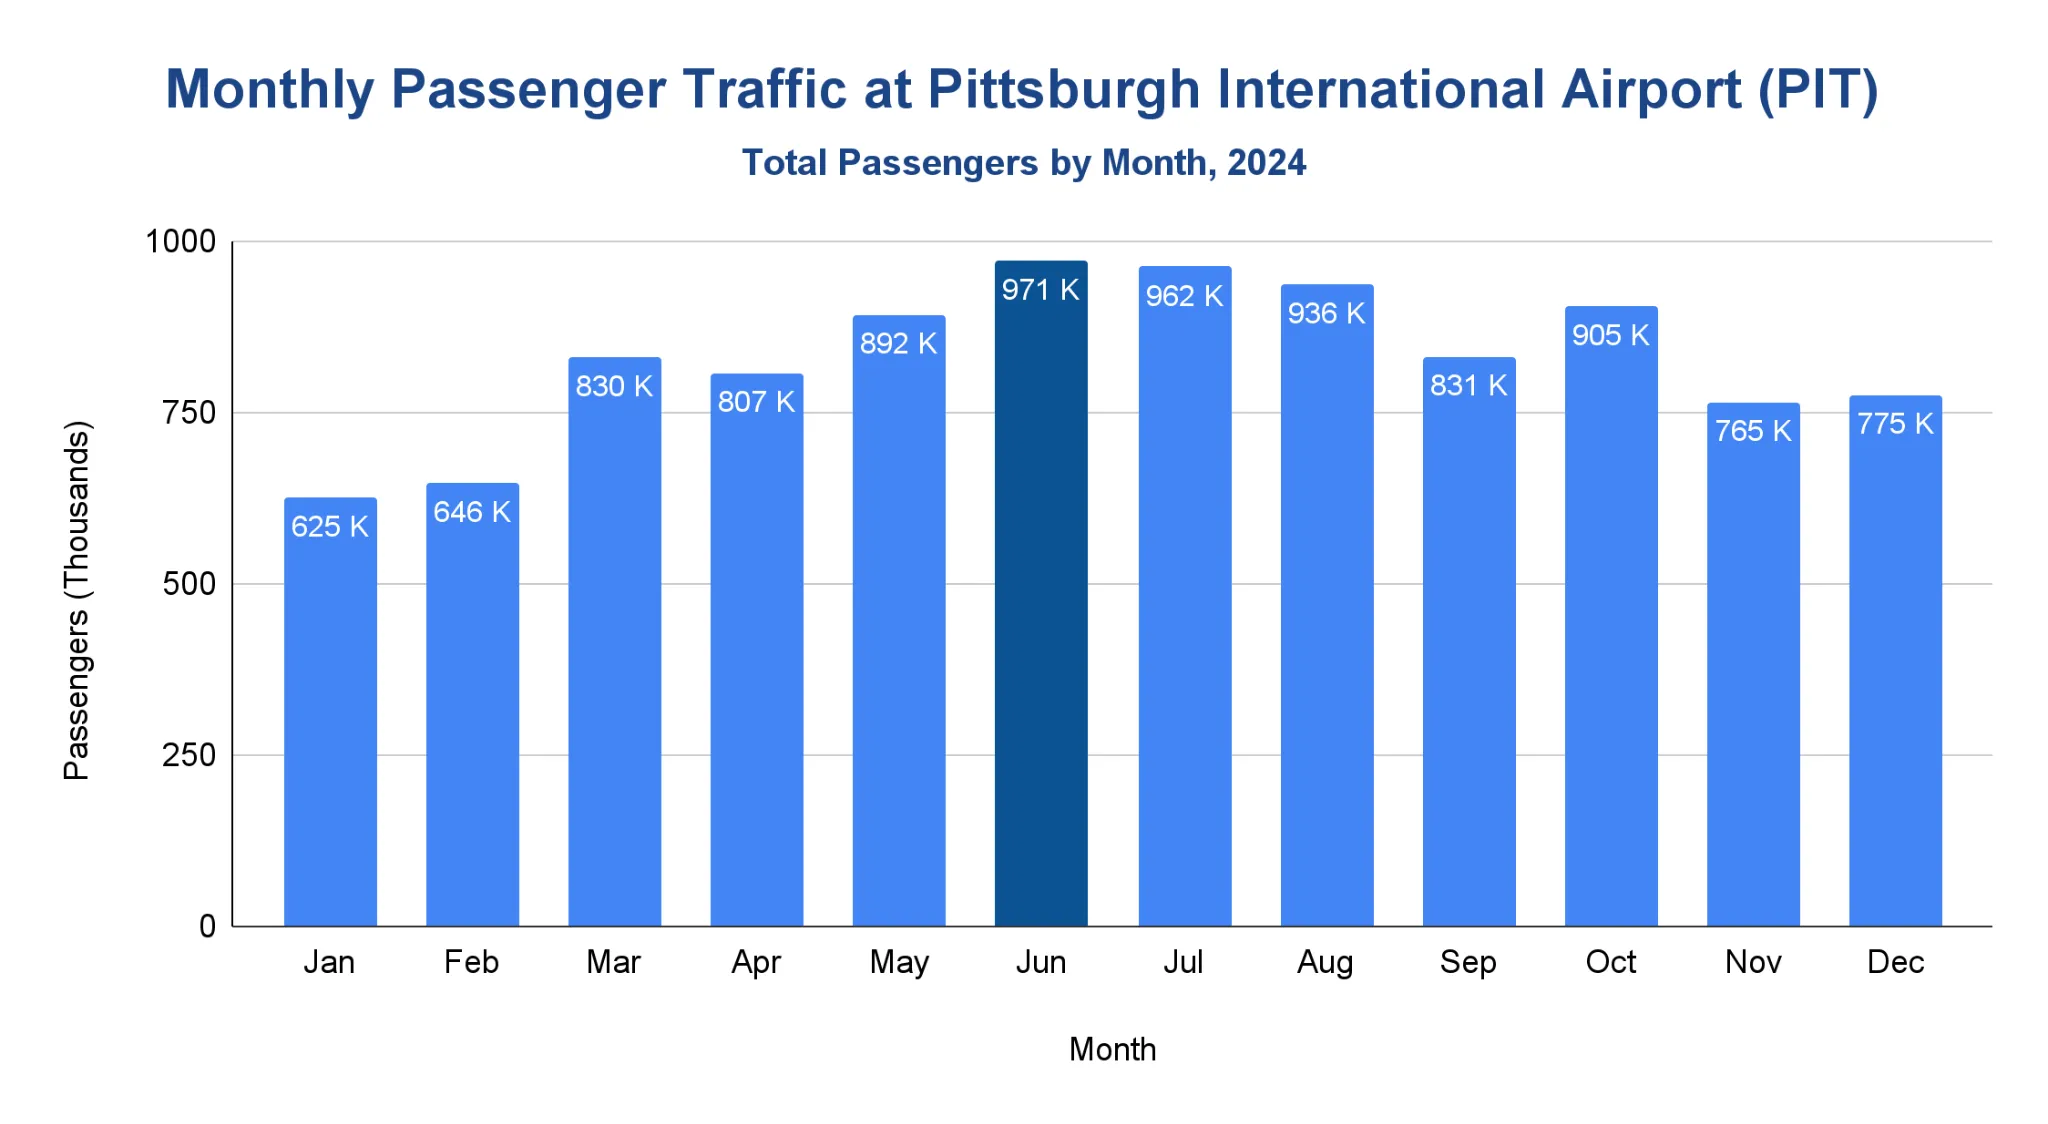
Peak Travel Months at Pittsburgh International Airport
Passenger traffic at Pittsburgh International Airport followed a clear seasonal pattern in 2024, with summer months driving the highest volumes and winter posting the lowest totals.
- June was the busiest month of the year with 971,000 passengers, narrowly edging out July.
- July (962,000) and August (936,000) formed a strong summer peak, reflecting vacation travel and school holidays.
- Traffic ramped up quickly in spring, with March (830,000) and April (807,000) marking the transition into the busy season.
- October stood out as the strongest fall month at 905,000, supported by a mix of leisure and business travel.
- Winter months were the quietest, with January (625,000) and February (646,000) recording the lowest passenger volumes of the year.
Note: Passenger figures represent total enplaned and deplaned passengers (000) for January–December 2024, published by the Allegheny County Airport Authority (ACAA).
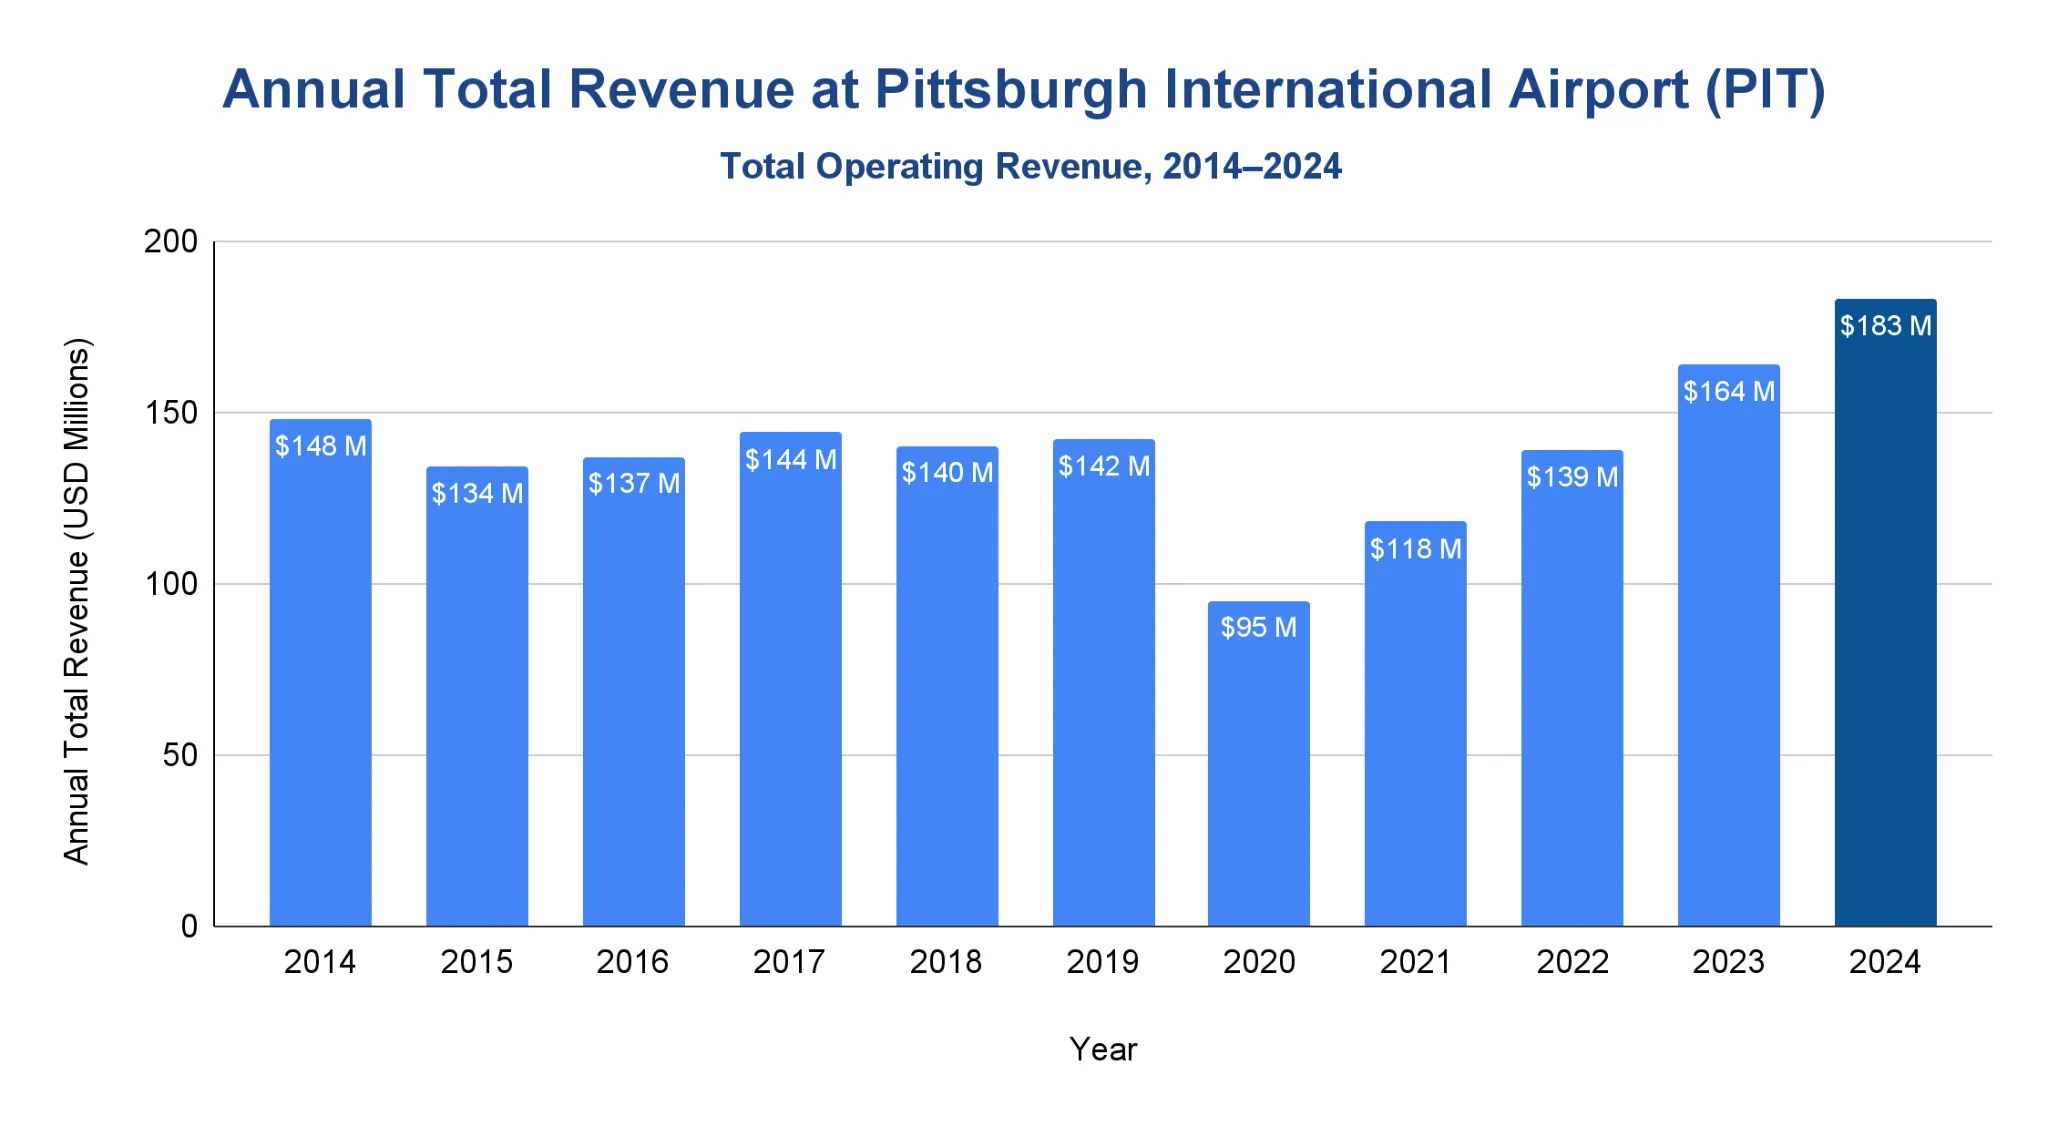
How much revenue does Pittsburgh International Airport generate annually?
Operating revenue at Pittsburgh International Airport declined sharply during the pandemic, falling to $95 million in 2020, then recovered alongside traffic growth, reaching $183 million in 2024, the highest level in the period shown.
- Annual operating revenue averaged around $140 million in the years leading up to the pandemic.
- 2020 marked the low point at $95 million, reflecting the collapse in air travel.
- Revenue recovered through 2021 ($118 million) and 2022 ($139 million) as passenger volumes returned.
- Growth accelerated in 2023, when operating revenue reached $164 million.
Note: Figures represent annual total operating revenue, rounded to the nearest $1 million, as reported in the Allegheny County Airport Authority (ACAA) Annual Financial Reports.
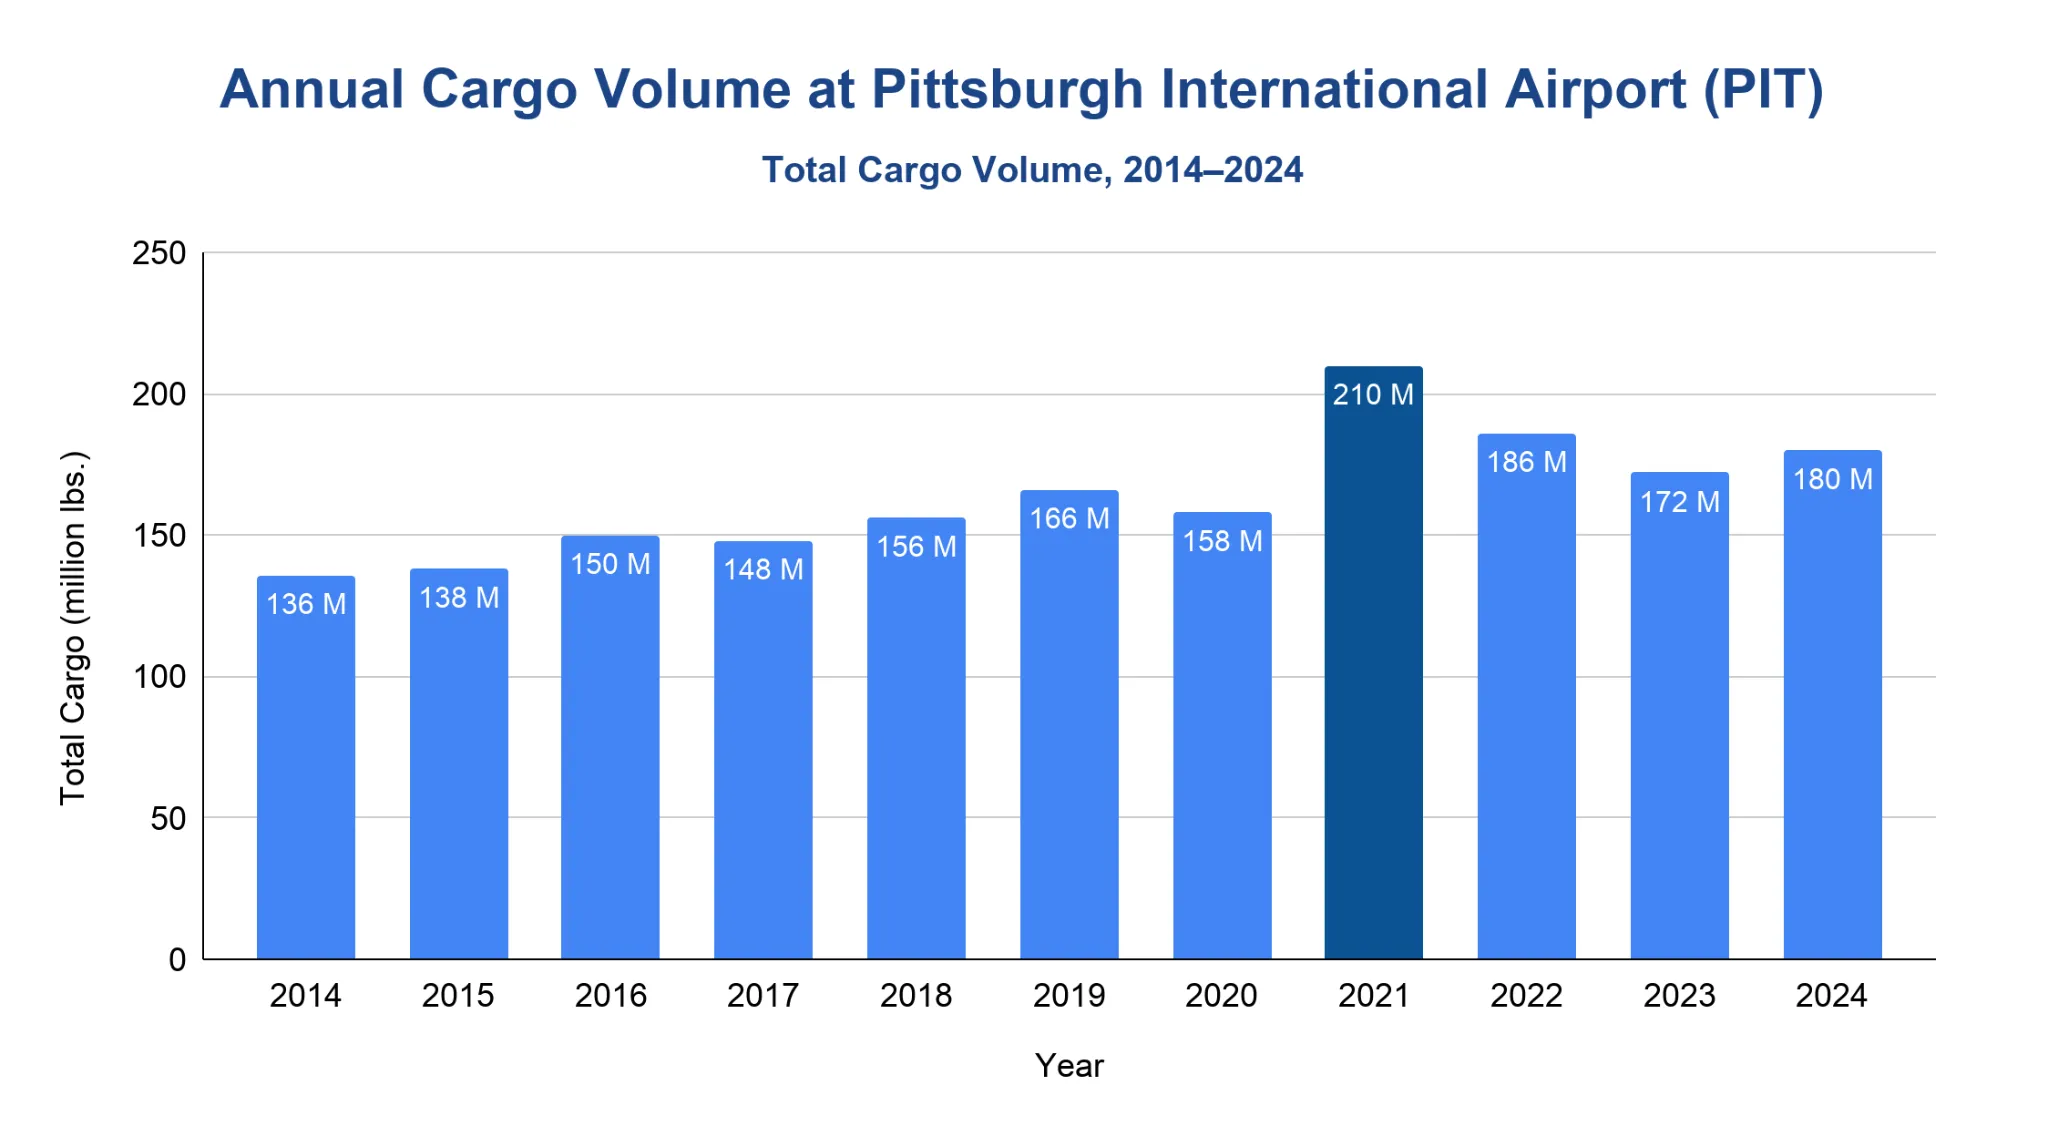
How much cargo moves through Pittsburgh International Airport each year?
Cargo volumes at Pittsburgh International Airport rose from 136 million pounds in 2014 to 166 million pounds in 2019, surged to a pandemic peak of 210 million pounds in 2021, then eased but stayed elevated at 180 million pounds in 2024, well above pre-2020 levels.
- Annual cargo volumes rose steadily from 136 million pounds in 2014 to 166 million pounds in 2019.
- 2021 marked a clear high point at 210 million pounds, driven by pandemic-era logistics demand.
- Volumes moderated in the following years but stayed elevated, totaling 172 million pounds in 2023.
- In 2024, PIT handled approximately 180 million pounds of cargo, above any pre-2020 year shown.
Note: Figures represent total cargo handled, rounded to the nearest 1 million pounds (million lbs.), as reported by the Allegheny County Airport Authority (ACAA).
What is Pittsburgh International Airport's on-time performance?
Departure on-time rates remained above 80% in every year shown, while arrival performance followed a similar pattern.
- Departure on-time performance peaked at 87% in 2020 and stood at 82% in 2024, before improving to 86% in the most recent period (October 2024–September 2025).
- Arrival on-time rates dipped to a low of 75% in 2022, then recovered to 78% in 2024 and 84% in the latest period.
- Average delays were longest in 2024, reaching 75.36 minutes for departures and 67.71 minutes for arrivals, before easing in 2025.
- Cancellation rates fell sharply after 2020, dropping from 6.32% during the pandemic year to 0.75% in the latest reporting period.
- Total domestic flight volume increased steadily from 29,000 flights in 2020 to 43,800 in 2024.
Note: BTS publishes average delays in decimal-minute format. As such, the values have been kept exactly as reported to avoid altering the underlying data.
| On-time performance at PIT, domestic flights | ||||||
|---|---|---|---|---|---|---|
| Metric | 2020 | 2021 | 2022 | 2023 | 2024 | 2025* |
| On-time departures (%) | 87 | 86 | 81 | 84 | 82 | 86 |
| On-time arrivals (%) | 85 | 80 | 75 | 79 | 78 | 84 |
| Avg departure delay (min) | 72.03 | 73.17 | 72.41 | 73.39 | 75.36 | 64.28 |
| Avg arrival delay (min) | 56.61 | 62.61 | 64.56 | 63.67 | 67.71 | 60.25 |
| Cancelled flights (%) | 6.32 | 1.39 | 3.3 | 1.34 | 1.42 | 0.75 |
| Flights (000) | 29 | 32.6 | 40.5 | 42.1 | 43.8 | 10.7 |
| Reporting carriers | 16 | 15 | 15 | 14 | 14 | 13 |
Source · Bureau of Transportation Statistics (BTS).
Major Expansion Projects at Pittsburgh International Airport
Pittsburgh International Airport is in the middle of a major rebuild and cargo expansion led by the Allegheny County Airport Authority (ACAA), centered on the Terminal Modernization Program (TMP) and new cargo facilities.
- ACAA’s Terminal Modernization Program (TMP) broke ground in fall 2021, building a new “right-sized” landside terminal to replace and modernize the passenger entry experience.
- ACAA’s modernization plan is built around a terminal complex paired with the existing airside structure and designed around 51 gates, as outlined in ACAA’s terminal planning documents.
- Cargo facilities have expanded, including Cargo 4, a 77,000 sq ft facility with 17 loading docks and apron capacity sized for widebody freighters.
| Major Expansion Projects at PIT | ||
|---|---|---|
| Project | What it adds | Published project detail (ACAA) |
| Terminal Modernization Program (TMP) | New landside terminal and associated facilities | TMP broke ground fall 2021 |
| Transformed terminal plan | Terminal design centered on 51 gates | “51 gates” modernization plan |
| Cargo 4 facility | Modern cargo building | 77,000 sq ft, 17 loading docks |
Source · Note: This section includes only project details published by ACAA sources.
Pittsburgh International Airport Sustainability Initiatives
Pittsburgh International Airport’s sustainability program is led by ACAA’s published ESG strategy and operational programs covering energy, water systems, waste reduction, and emissions management.
- ACAA’s ESG goals include net-zero new buildings by 2030 and a 50% reduction in energy use intensity for existing structures (as described in ACAA’s Environmental/ESG materials).
- PIT operates an on-site microgrid powered by five natural gas generators and approximately 10,000 solar panels, and ACAA says it saves more than $1 million in annual utility costs.
- ACAA reports that PIT’s water bottle filling stations saved over 2 million bottles (2021–2024), including nearly 1 million in 2024 alone.
- ACAA’s deicing management program recovers spent deicing fluid on dedicated pads and reports over 4 million gallons per year collected for recycling, totaling 33 million gallons since 2016.
- ACAA’s ESG strategy includes a construction-and-demolition waste goal of diverting at least 75% from landfills.
| Sustainability Initiatives at PIT | |
|---|---|
| Initiative | Metric / target |
| ESG building targets | Net-zero new buildings by 2030; 50% reduction in energy use intensity for existing structures |
| Microgrid | Five natural-gas generators; nearly 10,000 solar panels; $1M+ annual utility savings |
| Deicing fluid recovery | 4M+ gallons/year; 33M gallons since 2016 |
| Water bottle refill stations | 2M+ bottles saved (2021–2024); ~1M in 2024 |
| Construction waste goal | Divert ≥75% of construction & demolition waste |
Source · Note: All carbon-reduction targets measured from a 2016 baseline.
How does Pittsburgh International Airport rank nationally?
Pittsburgh International Airport ranked 48th among U.S. airports by enplaned passengers in 2023, following a 49th-place ranking in 2022, according to the Bureau of Transportation Statistics.
- The airport spans more than 8,800 acres, giving it ample space for future development.
- PIT took home the 2017 Airport of the Year title from Air Transport World, the first U.S. airport to earn that honor, citing operational excellence and innovation.
Related Travel Statistics
- Lehigh Valley International Airport Statistics
- Aspen/Pitkin County Airport Statistics
- Charlotte Douglas Airport Statistics
- Colorado Springs Airport Statistics
- Fresno Yosemite International Airport Statistics
- Logan International Airport (BOS) Statistics
- Minneapolis-Saint Paul Airport Statistics
- Tweed–New Haven Airport (HVN) Statistics
- Peoria Airport (PIA) Statistics
- Richmond International Airport Statistics
- San Antonio International Airport Statistics
- Wilmington International Airport Statistics
What is Pittsburgh International Airport's economic impact?
PIT and Allegheny County Airport together drive $29.2 billion in total economic activity across southwestern Pennsylvania, supporting about 148,000 jobs in the 10-county region when all multiplier effects are counted.
- On-airport activity at PIT and Allegheny County Airport supports roughly 18,000 jobs and $3 billion in business revenues.
| Economic Impact of PIT | ||
|---|---|---|
| Category | Jobs Supported | Annual Business Revenue |
| Direct Airport Operations | 18,000 | $3.0 billion |
| Total Regional Impact (Direct + Indirect + Induced) | 147,847 | $29.2 billion |
Source · Note: Total impact includes multiplier effects across the 10-county southwestern Pennsylvania region.
References
- Allegheny County Airport Authority — Reports & Financials · flypittsburgh.com
- Allegheny County Airport Authority 2024 Annual Comprehensive Financial Report (ACFR) · flypittsburgh.com
- Pittsburgh International Airport Economic Impact Study — Core Report · flypittsburgh.com
- Allegheny County Airport Authority ESG Report (2023) · flypittsburgh.com
- Pittsburgh International Airport — Environmental Strategic Initiatives · flypittsburgh.com
- Pittsburgh International Airport — PIT Cargo Buildings & Facilities · flypittsburgh.com
- BTS TranStats — Airport profiles (route information by airport) · transtats.bts.gov
- Bureau of Transportation Statistics — Airport Rankings 2023 · bts.gov

