

 Popular Countries
 24/7 Support
Published Sep 9, 2026
Fresno Yosemite International Airport (FAT) is the primary air gateway for California’s Central Valley, connecting Fresno and nearby communities to destinations across the United States and Mexico through multiple partner airlines.
How many passengers pass through Fresno Yosemite International Airport each year?
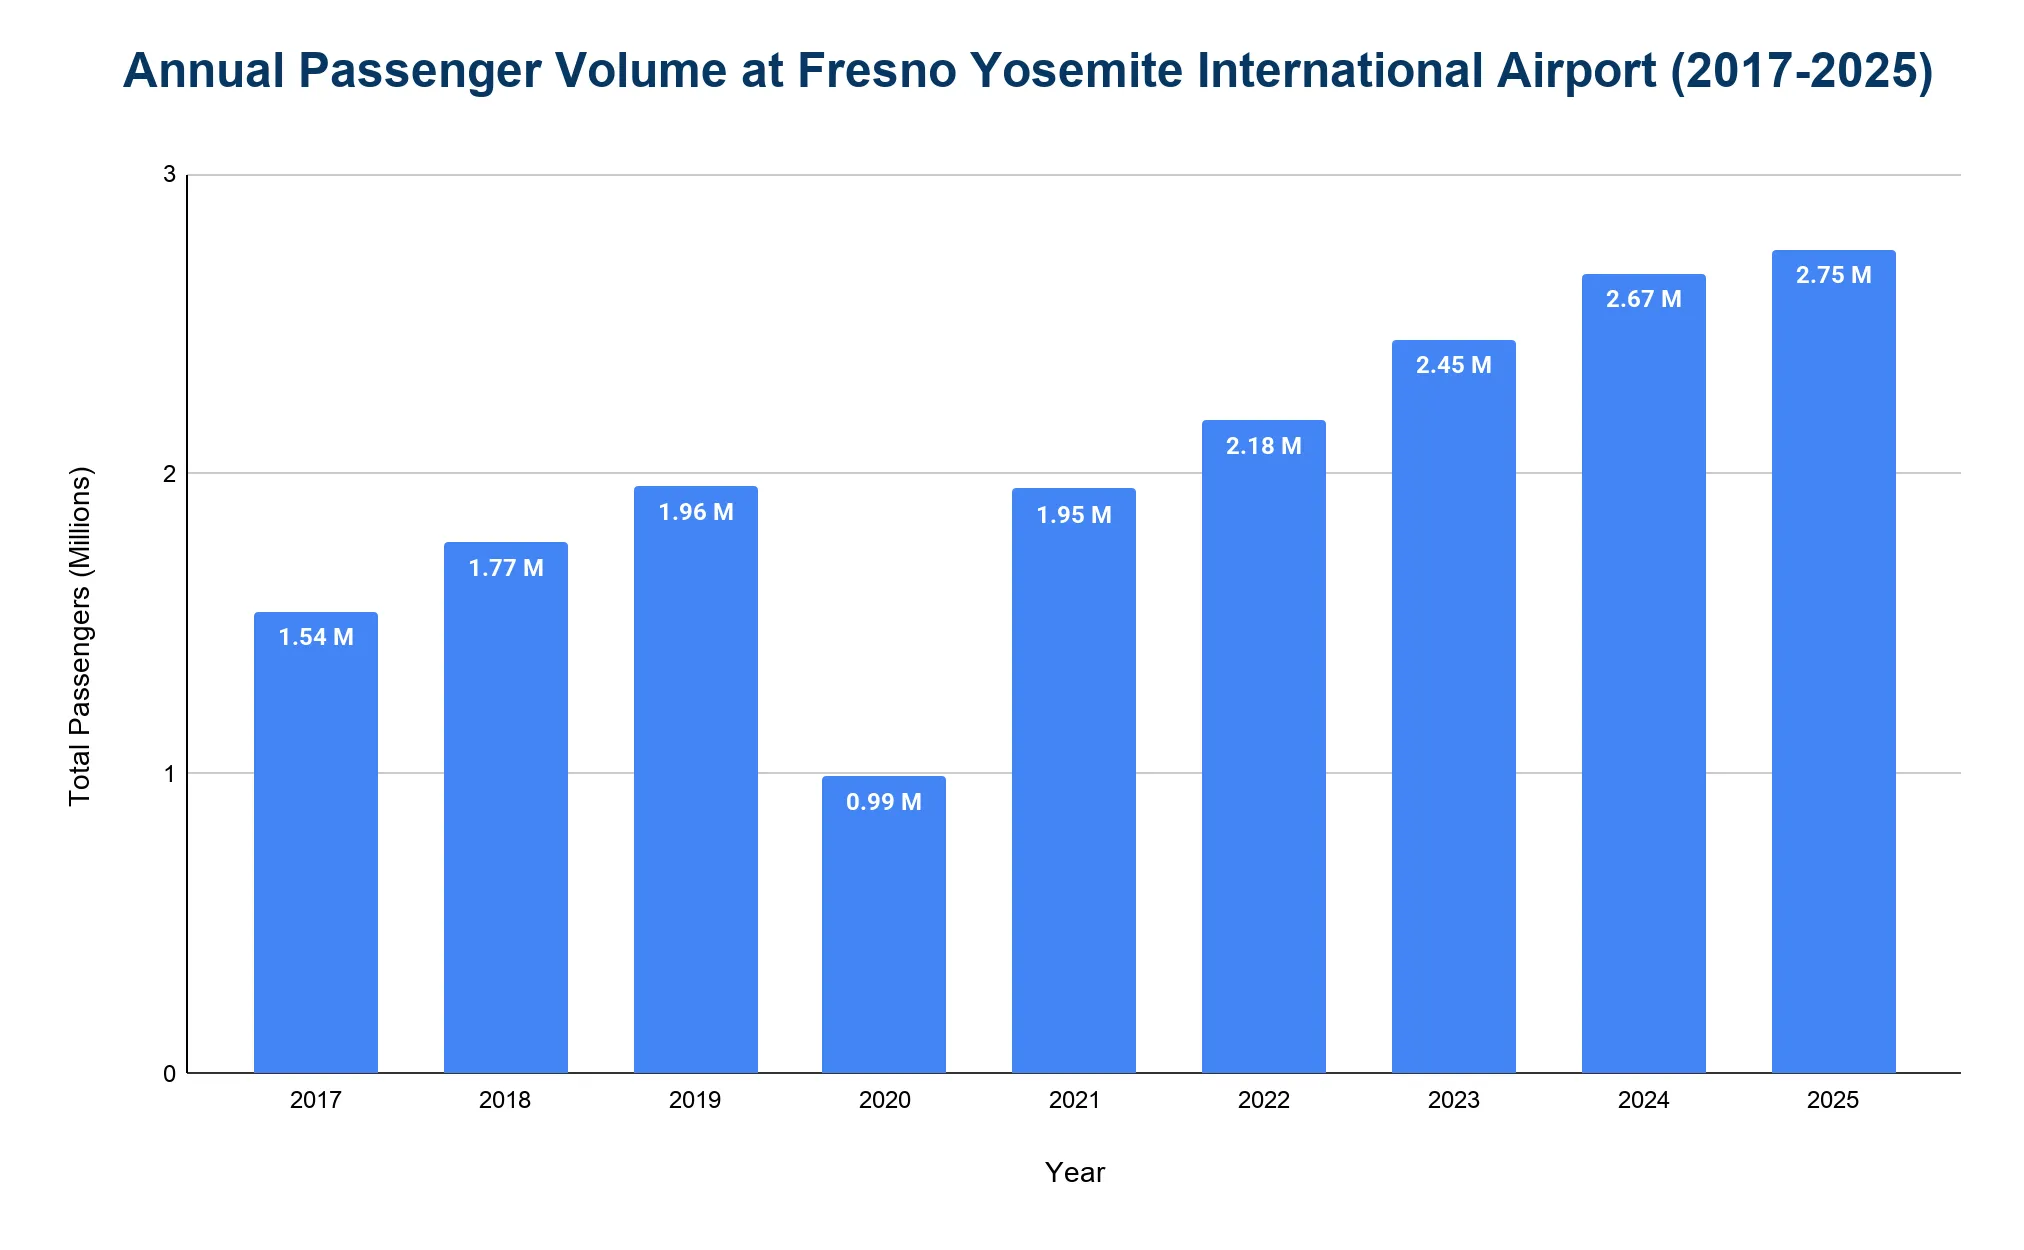
Fresno Yosemite International Airport handles nearly 3 million passengers annually. It has experienced consistent growth since the pandemic recovery, setting new records in recent years.
- The airport served 2.75 million passengers in 2025, a 3% increase over 2.67 million in 2024, marking the highest annual passenger total in its history.
- In 2019, the airport reached 1.96 million passengers before the pandemic.
- Passenger traffic dropped to 990,627 in 2020 (a 49.5% decline), then rebounded to 1.95 million in 2021.
- Recovery continued with 2.18 million in 2022 and 2.45 million in 2023.
What is the total number of aircraft operations at Fresno Yosemite International Airport each year?
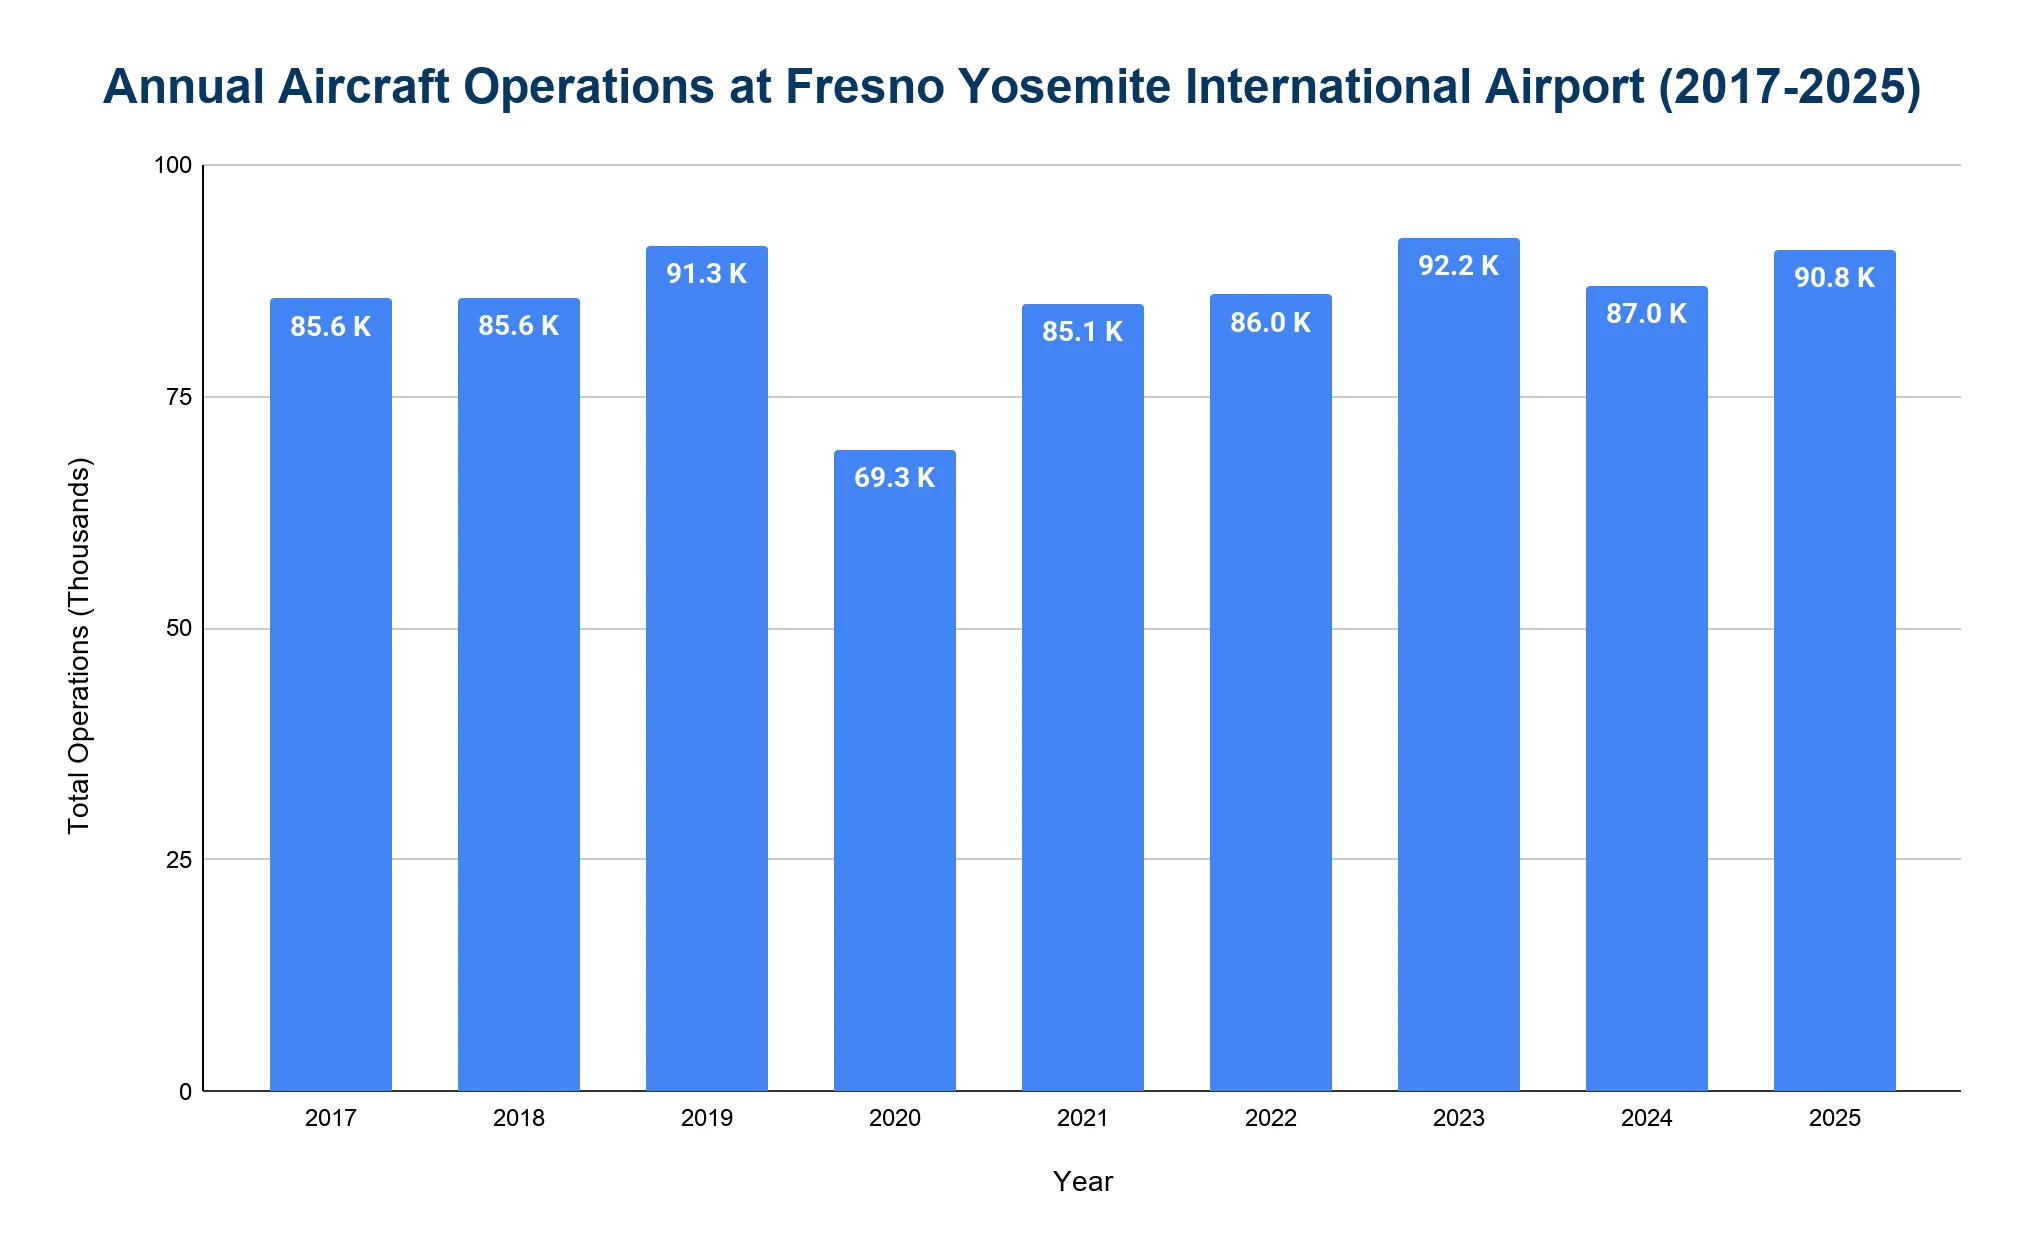
Fresno Yosemite International Airport averages over 90,000 aircraft takeoffs and landings annually.
- In 2025, there were 90,817 total aircraft movements, reflecting steady operational activity.
- Before the pandemic, operations totaled 91,251 in 2019.
- Activity dropped to 69,263 in 2020, the lowest point during the pandemic.
- Recovery followed with 85,068 operations in 2021 and 85,969 in 2022.
- Operations peaked in 2023 at 92,186 before dropping to 86,999 in 2024.
Which airlines operate the most flights out of Fresno Yosemite International Airport?
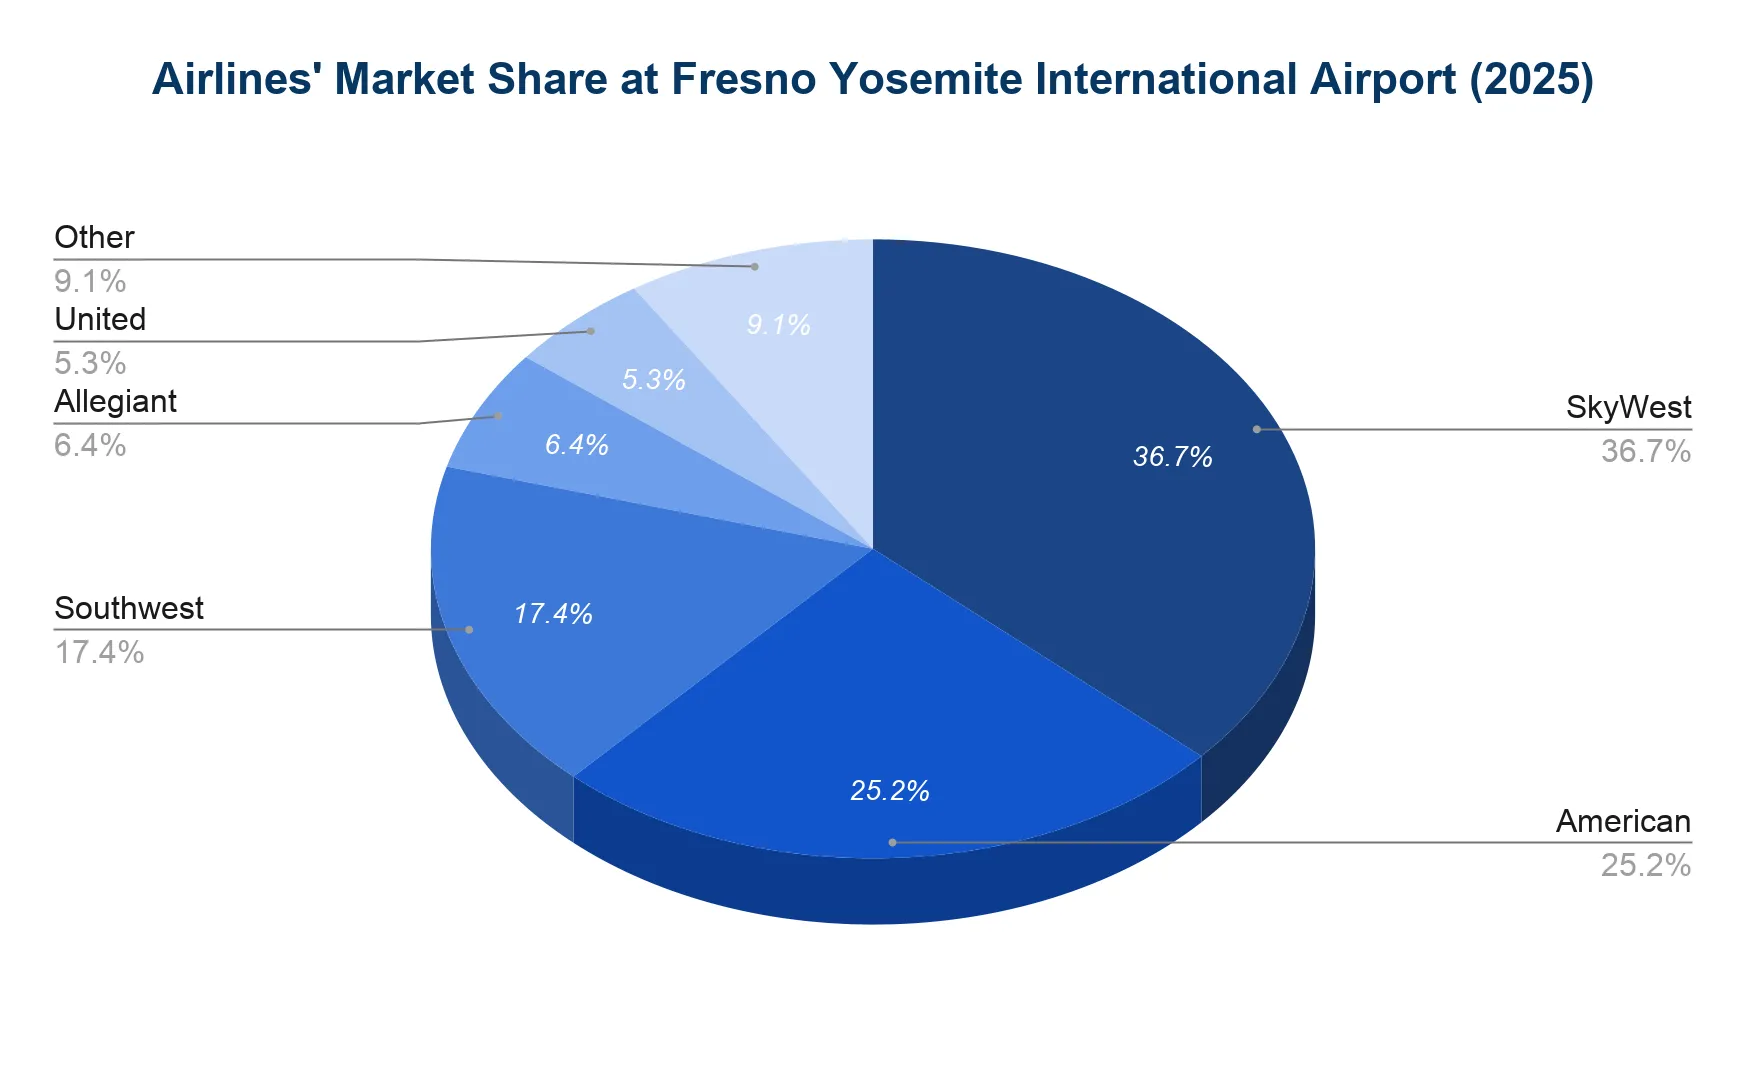
Regional and major U.S. carriers dominate operations at FAT, with SkyWest Airlines (which operates regional flights for major carriers) accounting for the largest share.
- In 2025, SkyWest Airlines led with 36.7% of total enplaned passengers, flying on behalf of United, Delta, Alaska and American.
- American Airlines followed with 25.2%, then Southwest Airlines with 17.4%.
- Allegiant Air made up 6.4%, and United Airlines accounted for 5.3%.
What are the monthly trends in passenger traffic at Fresno Yosemite International Airport?
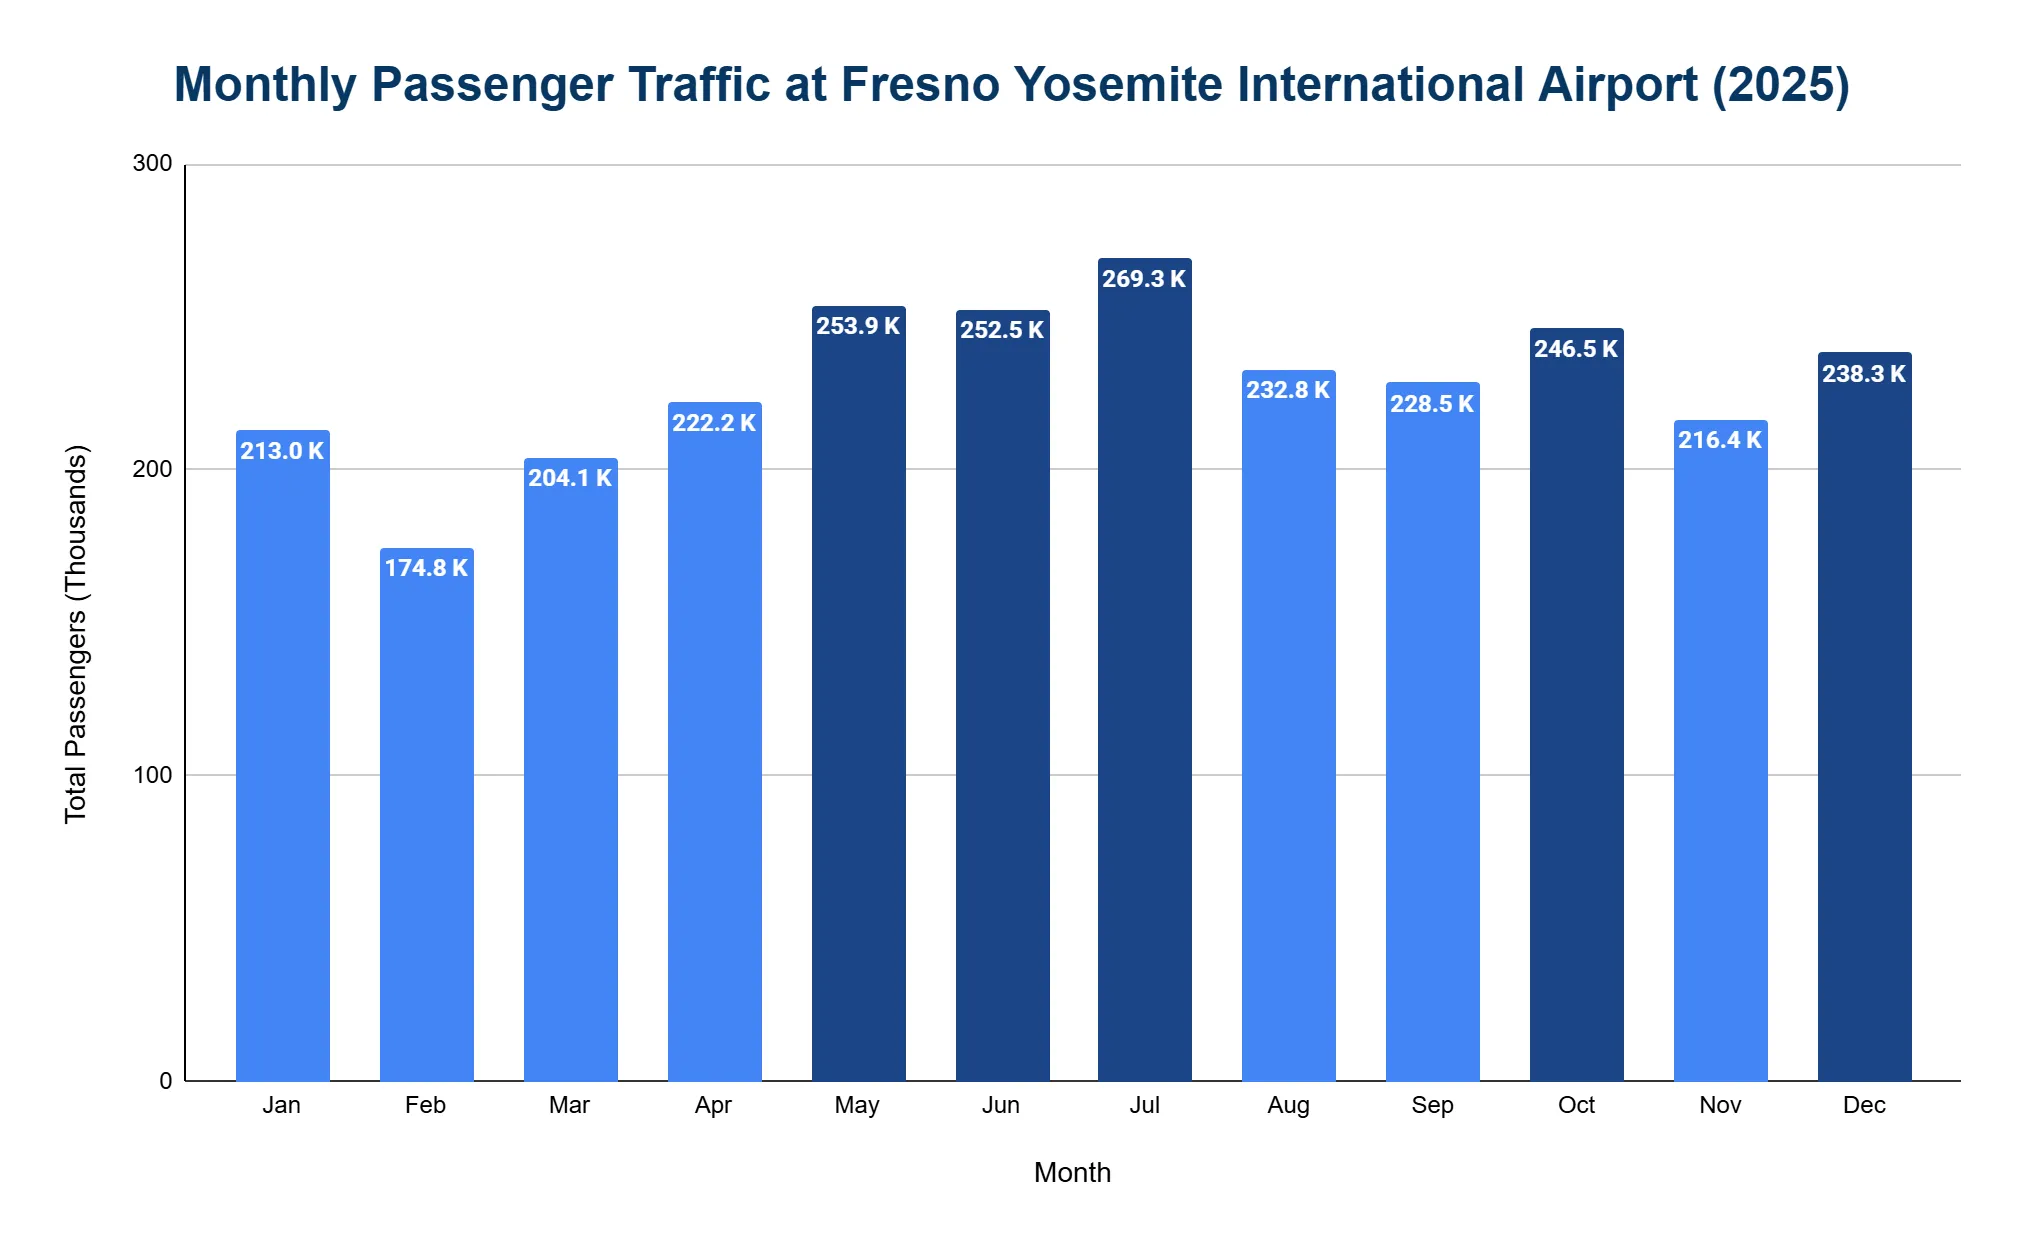
FAT sees distinct seasonal patterns, with summer and holiday months drawing the most passengers.
- July was the busiest month in 2025 with 269,270 passengers.
- May had 253,918 and June followed with 252,525.
- October had 246,491 passengers, while December completed the top 5 busiest months with 238,307 passengers.
- February was the slowest month at 174,766, followed by March as the second-quietest month with 204,109.
How many routes are there at Fresno Yosemite International Airport?
As of 2025, Fresno Yosemite International Airport (FAT) offered non-stop service to 16 destinations in the U.S. and Mexico, encompassing 13 domestic routes and 3 international routes.
- In 2025, Fresno Yosemite International Airport (FAT) added three notable new and returning nonstop routes to expand its domestic connectivity. These are: San Diego (SAN), Portland (PDX) and Chicago O'Hare (ORD).
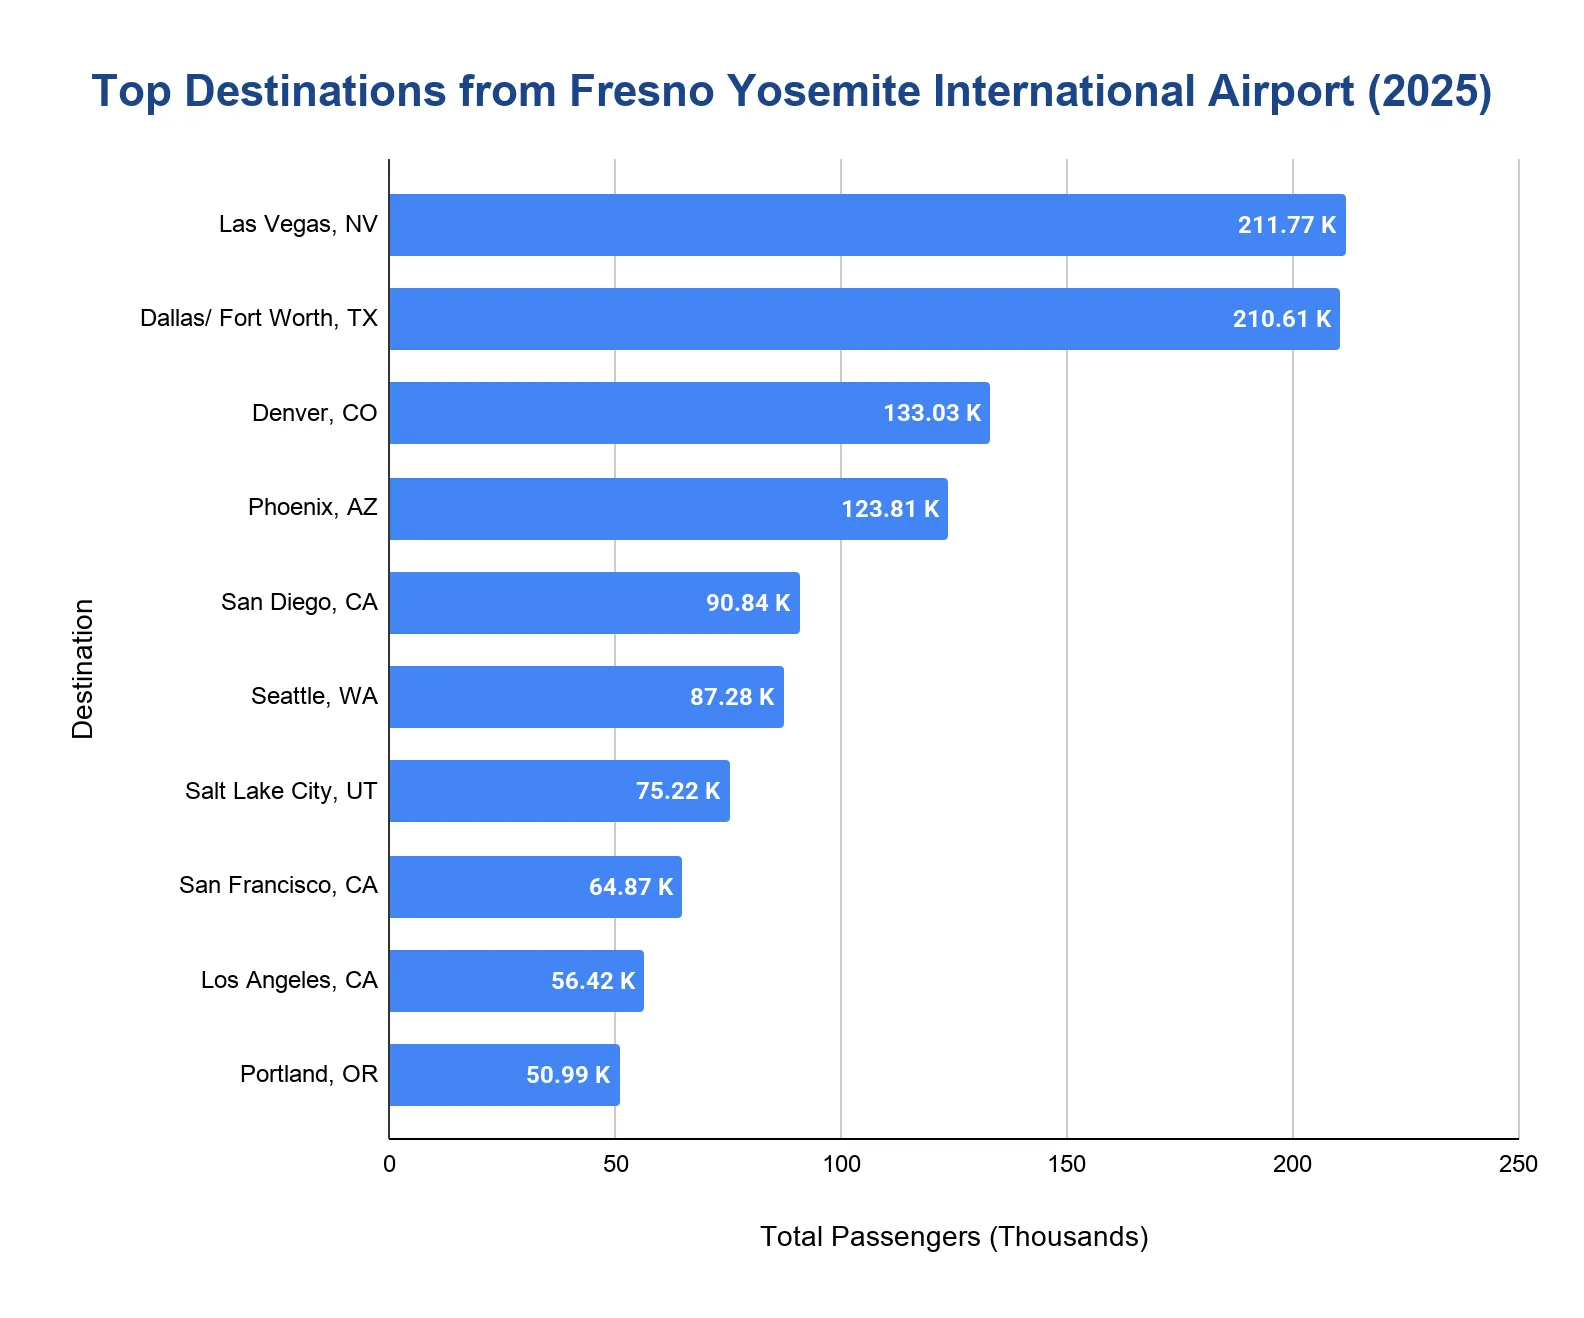
Which destinations are the most popular from Fresno Yosemite International Airport?
- Las Vegas (LAS) carried 211,770 passengers in 2025, making it the busiest route.
- Dallas/Fort Worth (DFW) followed closely with 210,610 passengers.
- Denver (DEN) handled 133,030, providing key access to the Mountain West.
- Phoenix (PHX) saw 123,810 passengers.
- San Diego (SAN) rounded out the top five with 90,840 passengers.
How much cargo does Fresno Yosemite International Airport handle annually?
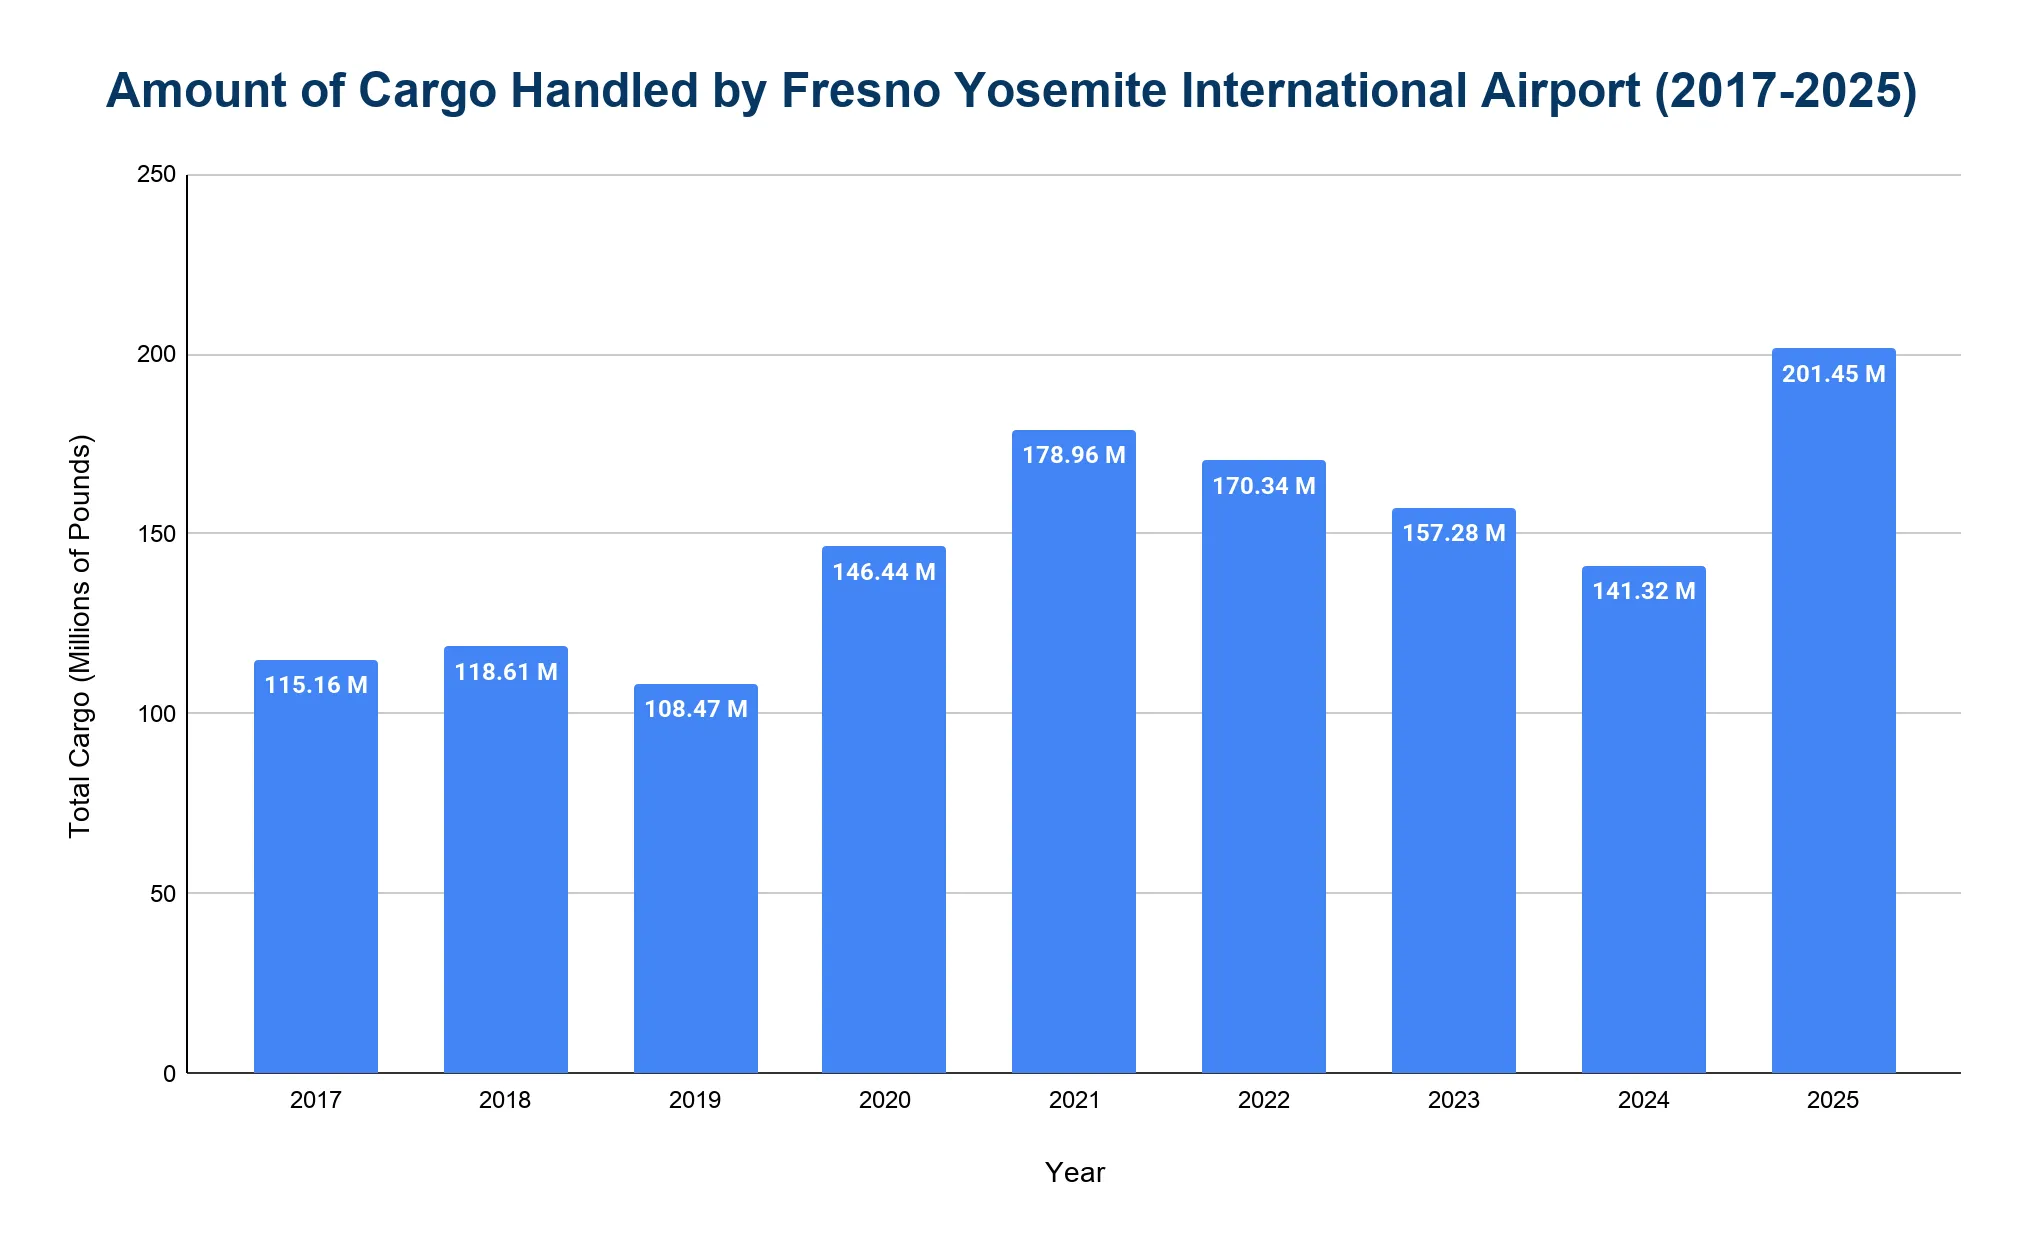
Fresno Yosemite International Airport is a major cargo hub for California’s Central Valley, handling over 140 million pounds of freight annually.
- The airport processed 201.45 million pounds of cargo in 2025, a 42.5% increase from 141.32 million pounds in 2024.
- Cargo volume jumped from 108.47 million pounds in 2019 to 146.44 million pounds in 2020 during the pandemic.
- The peak year was 2021 with 178.96 million pounds, driven by e-commerce demand.
- The airport handled 170.34 million pounds in 2022, then 157.28 million pounds in 2023.
How many cancellations occur at Fresno Yosemite International Airport annually?
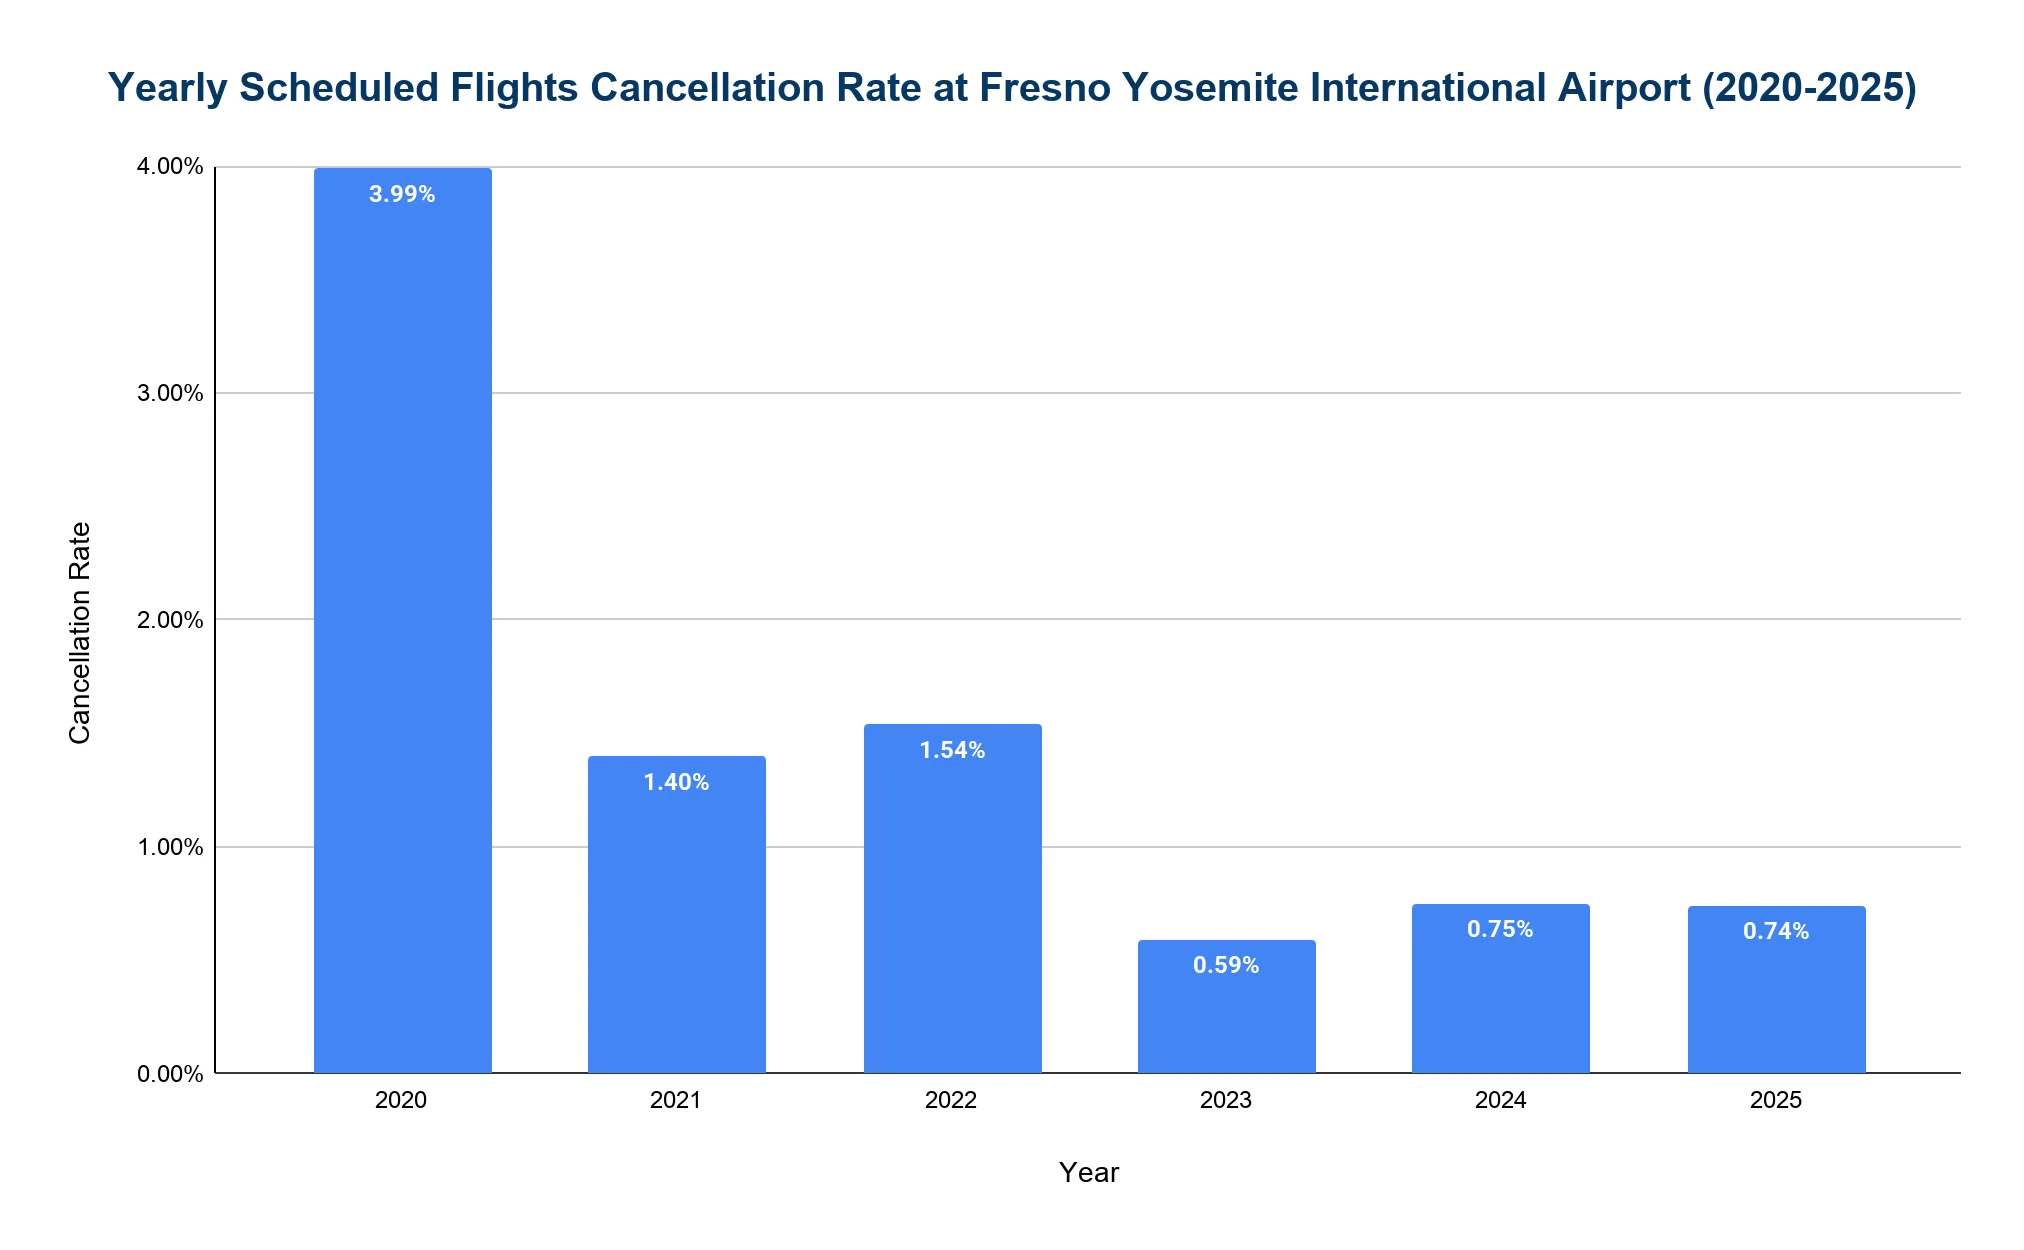
Flight cancellations at FAT remain low, typically under 2%.
- In 2025, the cancellation rate was 0.74%, almost similar to 0.75% in 2024
- The lowest recent rate was in 2023, with just 0.59% of flights cancelled.
- Cancellations rose to 1.54% in 2022, mainly due to Southwest Airlines’ operational disruption in December.
- In 2021, the rate was 1.40%, reflecting a return to more stable operations.
- The highest rate occurred in 2020, with 3.99% of flights cancelled due to pandemic-related disruptions.
Related Travel Statistics
- Albany International Airport (ALB) Statistics
- Albuquerque International Sunport Statistics
- Appleton International Airport Statistics
- Southwest Florida Airport Statistics
- Piedmont Triad Airport Statistics
- Houston Hobby Airport Statistics
- Los Angeles International Airport Statistics
- Myrtle Beach Airport (MYR) Statistics
- T.F. Green International Airport Statistics
- Roanoke-Blacksburg Regional Airport Statistics
- Salt Lake City International Airport Statistics
- Santa Barbara Municipal Airport Statistics
What are the main causes of flight disruptions at Fresno Yosemite International Airport?
- Tule fog in winter months (December and January) can reduce visibility, sometimes causing morning delays or diversions.
- Weather conditions at hub airports, such as fog in San Francisco, snow in Denver or storms in Dallas, can lead to cascading delays.
- Airline operational issues, especially crew scheduling at regional carriers, often affect connecting flights.
- Air traffic control delays at larger California airports like SFO or LAX may impact departures from Fresno.
- Mechanical issues also cause occasional delays, although these are less frequent due to the airport's effective maintenance protocols.
What are the notable incidents at Fresno Yosemite International Airport?
- September 13, 2015: An Erickson Aero firefighting tanker experienced a left-engine failure shortly after departing Fresno Yosemite International Airport. The aircraft returned safely to FAT, but engine debris fell into a Fresno neighborhood and damaged a vehicle window. No injuries were reported1.
- December 18, 2019: A 17-year-old breached FAT’s perimeter fence, entered a King Air 200, and started one engine. The aircraft moved and pivoted before striking a building and fence on airport property. It never became airborne, and no injuries were reported2.
- December 27, 2022: During Southwest Airlines’ nationwide holiday operational disruption, local media reported that about 75% of the carrier’s flights in and out of Fresno were canceled that Tuesday morning. The disruption affected many local travelers and was part of Southwest’s broader 2022 holiday meltdown3.
References
- Engine parts fall off plane into a Fresno neighborhood · kmph.com ↑
- Statement on General Aviation Aircraft Incident Response · flyfresno.com ↑
- Southwest Airlines cancellations affect Central Valley travelers (December 2022) · kmph.com ↑
- Fresno Yosemite International Airport Activity Data · flyfresno.com
- FAA OPSNET — George Bush Intercontinental Airport Operations Data · aspm.faa.gov
- BTS TranStats — Airport profiles (route information by airport) · transtats.bts.gov
- Incidents at Fresno Yosemite International Airport (KMPH) · kmph.com

