

 Popular Countries
 24/7 Support
Updated
Los Angeles International Airport (LAX) is the primary entry port to Southern California and one of the world’s busiest airports. Located within the Los Angeles metropolitan area, it supports tens of millions of passengers and significant cargo volumes each year, generating substantial economic activity for the region.
Los Angeles International Airport Statistics 2026 Year to Date
Passenger traffic at LAX from January to August 2026 is running slightly behind the same period of 2025, while air cargo continues to grow.
- LAX handled 48.92 million passengers from January to August 2026, a 1.46% decrease from 49.64 million in the same period of 2025.1
- Domestic passengers: 33.33 million, down 0.93% year over year.1
- International passengers: 15.59 million, down 2.58% year over year.1
- Aircraft operations totaled 380,174 movements, a 2.29% decrease from 389,095.1
- Air cargo reached 1.55 million tons, a 4.59% increase from 1.49 million tons.1
- August 2026 alone saw 6.44 million passengers, 3.74% fewer than in August 2025.1
| LAX Monthly Traffic, January–August 2026 | ||||||
|---|---|---|---|---|---|---|
| Month | Total Passengers | Change vs 2025 | Domestic Passengers | International Passengers | Aircraft Operations | Cargo (tons) |
| January | 5,546,409 | +0.79% | 3,634,168 | 1,912,241 | 45,527 | 180,646 |
| February | 4,956,270 | +0.93% | 3,357,714 | 1,598,556 | 41,597 | 171,542 |
| March | 6,011,798 | -0.10% | 4,151,549 | 1,860,249 | 47,500 | 190,083 |
| April | 5,871,843 | -3.14% | 4,027,445 | 1,844,398 | 46,833 | 193,466 |
| May | 6,287,378 | -2.48% | 4,363,756 | 1,923,622 | 48,361 | 200,341 |
| June | 6,738,428 | -1.37% | 4,625,181 | 2,113,247 | 49,382 | 207,348 |
| July | 7,064,222 | -1.58% | 4,815,337 | 2,248,885 | 51,947 | 207,272 |
| August | 6,441,757 | -3.74% | 4,352,933 | 2,088,824 | 49,027 | 202,357 |
Source · Los Angeles World Airports, Traffic Comparison (TCOM) monthly reports, January–August 2026. Monthly figures as first reported.
How many passengers pass through Los Angeles International Airport each year?
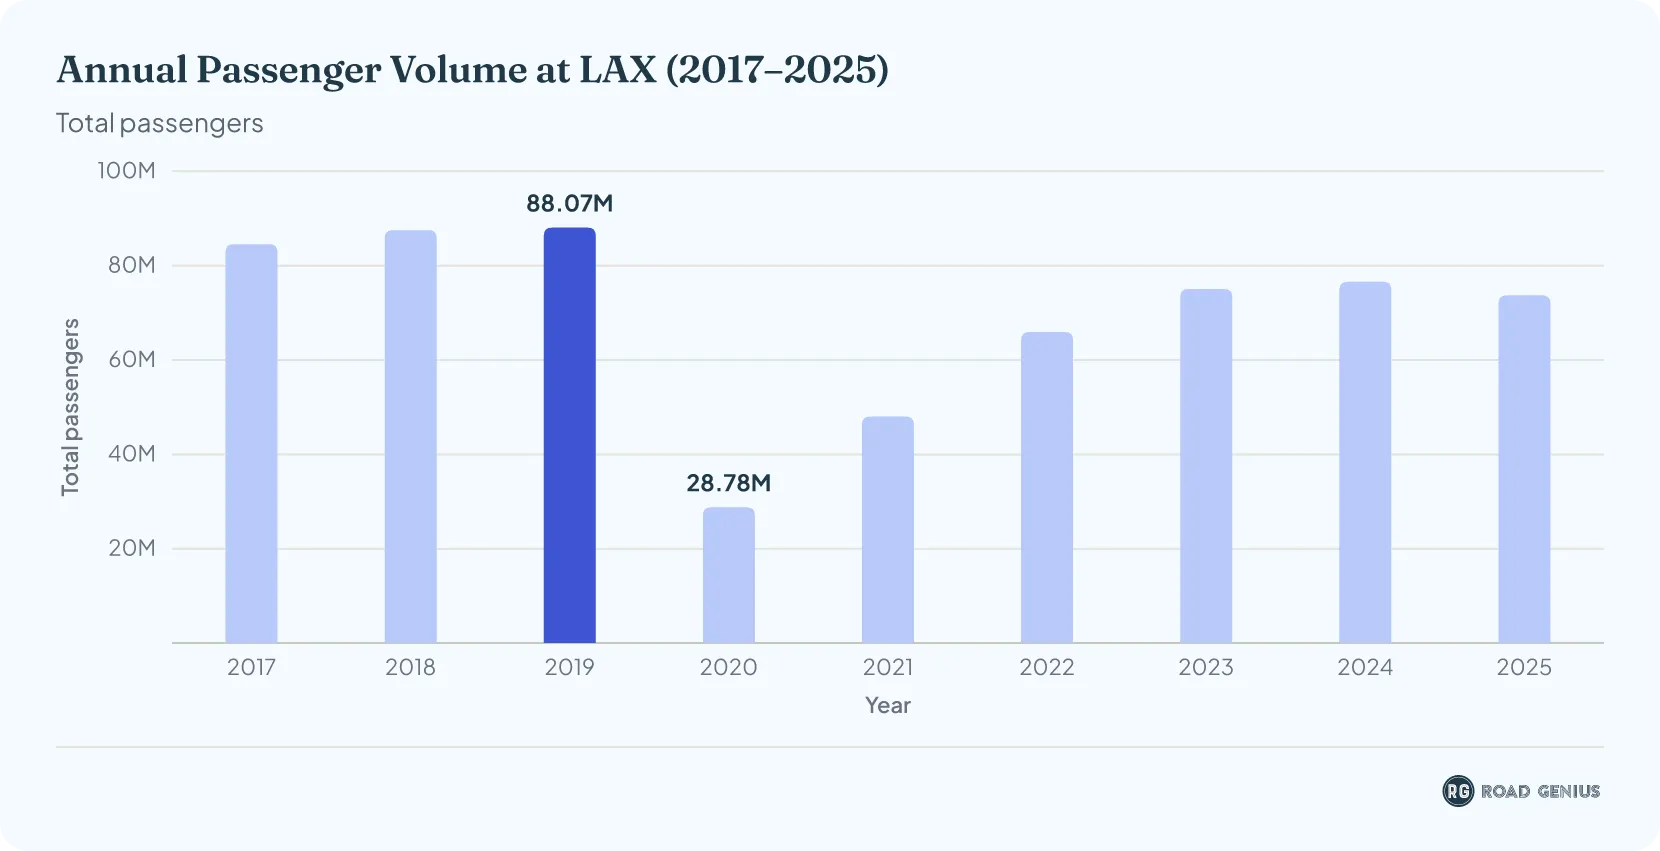
Los Angeles International Airport handles over 70 million passengers annually, maintaining its position as one of the world's busiest airports.
| LAX Passengers by Year, 2008–2025 | ||||
|---|---|---|---|---|
| Year | Total Passengers | Change vs Prior Year | Departing | Arriving |
| 2008 | 59,820,750 | — | 29,933,581 | 29,887,169 |
| 2009 | 56,520,843 | -5.5% | 28,288,211 | 28,232,632 |
| 2010 | 59,070,127 | +4.5% | 29,605,542 | 29,464,585 |
| 2011 | 61,862,052 | +4.7% | 30,923,005 | 30,939,047 |
| 2012 | 63,688,121 | +3.0% | 31,857,135 | 31,830,986 |
| 2013 | 66,665,726 | +4.7% | 33,335,386 | 33,330,340 |
| 2014 | 70,663,519 | +6.0% | 35,320,501 | 35,343,018 |
| 2015 | 74,956,305 | +6.1% | 37,550,046 | 37,406,259 |
| 2016 | 80,921,651 | +8.0% | 40,555,706 | 40,365,945 |
| 2017 | 84,558,776 | +4.5% | 42,470,554 | 42,088,222 |
| 2018 | 87,533,177 | +3.5% | 44,001,158 | 43,532,019 |
| 2019 | 88,068,013 | +0.6% | 44,290,884 | 43,777,129 |
| 2020 | 28,779,527 | -67.3% | 14,439,788 | 14,339,739 |
| 2021 | 48,009,241 | +66.8% | 23,940,913 | 24,068,328 |
| 2022 | 65,924,298 | +37.3% | 32,926,543 | 32,997,755 |
| 2023 | 75,056,210 | +13.9% | 37,644,851 | 37,411,359 |
| 2024 | 76,585,861 | +2.0% | 38,328,369 | 38,257,492 |
| 2025 | 73,709,594 | -3.8% | 36,947,210 | 36,762,384 |
Source · Los Angeles World Airports, LAX 10-Year Summary: Passengers.
How LAX Compares With Other U.S. Airports
LAX is the fifth-busiest airport in the United States by passenger boardings and ranked 13th in the world by total passengers in 2025.
- LAX boarded 36.50 million passengers in 2025, ranking 5th in the U.S. behind Atlanta, Dallas/Fort Worth, Chicago O'Hare and Denver.4
- Its boardings fell 3.35% from 2024, the second-steepest decline among the 10 busiest U.S. airports after Las Vegas (6.07%).4
- Worldwide, LAX ranked 13th in 2025 with 73.71 million passengers, down from 11th in 2024 and 3rd in 2019.5
- Domestic travelers make up 68% of LAX passengers, compared with 80–95% at the other four U.S. airports in the world's top 20.5
- LAX ranked 2nd of the 30 major U.S. airports for on-time arrivals in 2025.6
- For cargo, LAX ranked 7th in the U.S. by all-cargo aircraft landed weight in 2025.7
| Busiest U.S. Airports by Passenger Boardings, 2025 | |||
|---|---|---|---|
| Rank | Airport | Boardings (2025) | Change vs 2024 |
| 1 | Atlanta (ATL) | 51,459,786 | -2.00% |
| 2 | Dallas/Fort Worth (DFW) | 41,297,009 | -2.49% |
| 3 | Chicago O'Hare (ORD) | 40,680,735 | +5.46% |
| 4 | Denver (DEN) | 39,976,695 | -0.09% |
| 5 | Los Angeles (LAX) | 36,497,303 | -3.35% |
| 6 | New York JFK (JFK) | 30,792,806 | -2.14% |
| 7 | Orlando (MCO) | 27,999,709 | +0.50% |
| 8 | Las Vegas (LAS) | 26,531,765 | -6.07% |
| 9 | Miami (MIA) | 26,450,972 | -0.52% |
| 10 | San Francisco (SFO) | 26,251,850 | +4.68% |
Source · Federal Aviation Administration, Final CY2025 Commercial Service Airports Enplanements.
International vs Domestic Passengers
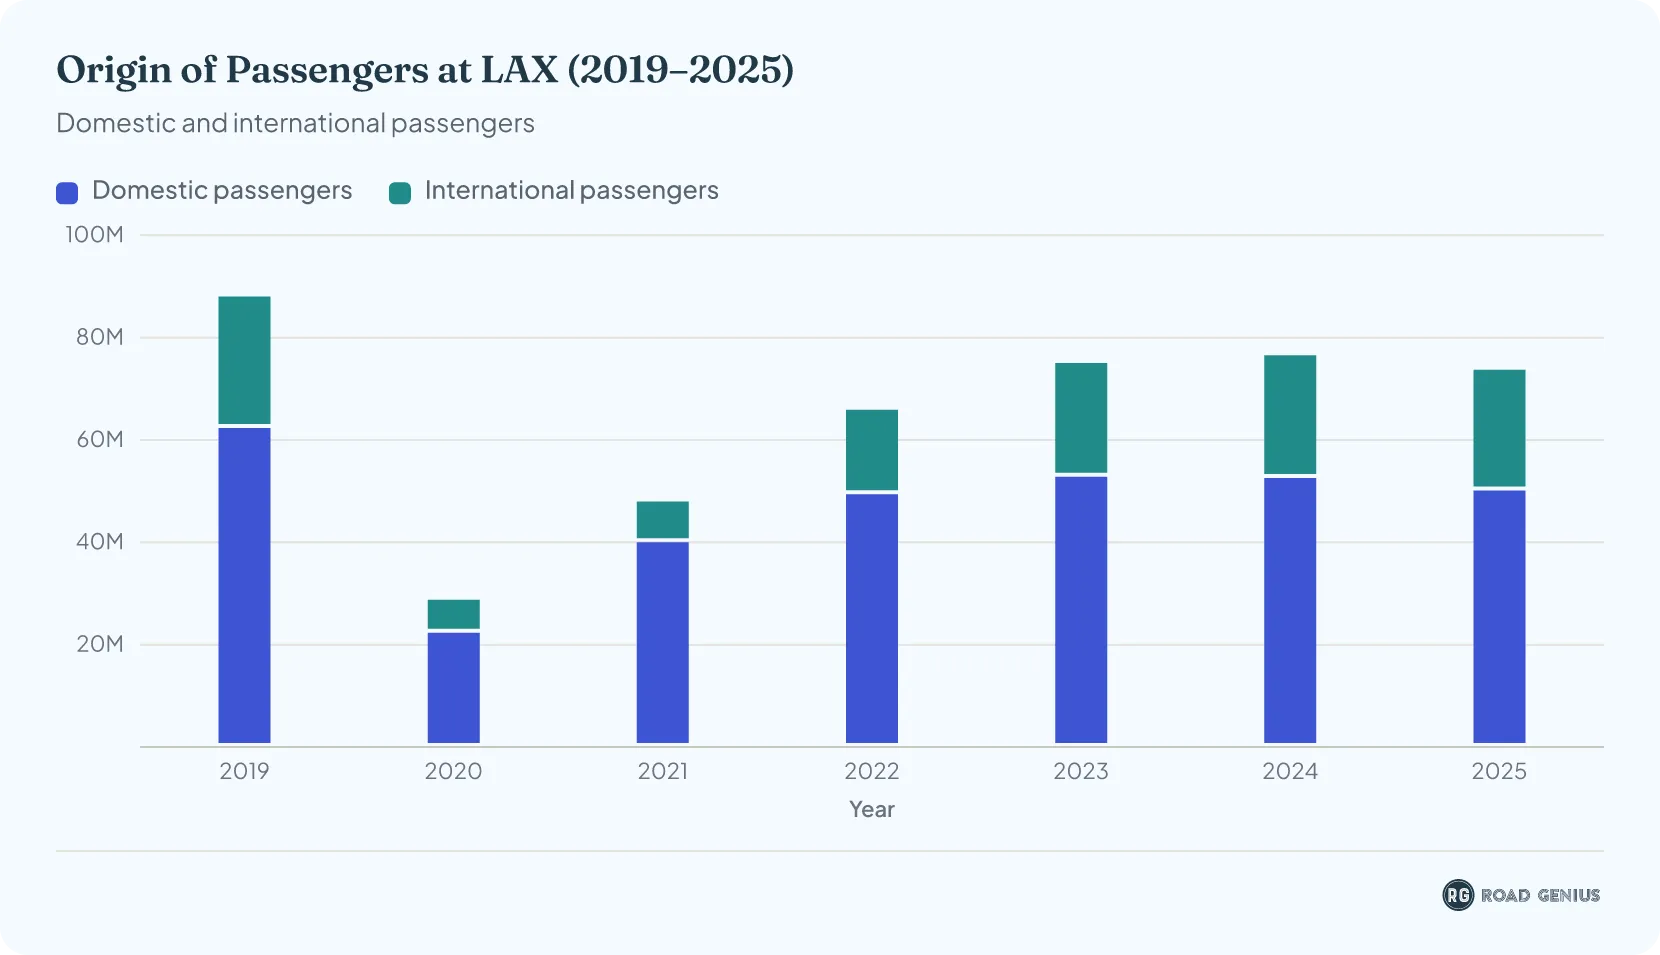
Both domestic and international passenger volumes declined in 2025, with domestic travel experiencing a larger decrease.
Arrivals vs Departures
LAX functions primarily as an origin-and-destination airport, with nearly equal numbers of departures and arrivals.
| Passenger Flow: Departure vs Arrival (2019-25) | ||||
|---|---|---|---|---|
| Year | Domestic Departure | Domestic Arrival | International Departure | International Arrival |
| 2019 | 31.37 M | 30.99 M | 12.92 M | 12.78 M |
| 2020 | 11.20 M | 11.15 M | 3.22 M | 3.18 M |
| 2021 | 20.04 M | 19.98 M | 3.89 M | 4.07 M |
| 2022 | 24.61 M | 24.79 M | 8.31 M | 8.21 M |
| 2023 | 26.45 M | 26.35 M | 11.18 M | 11.04 M |
| 2024 | 26.33 M | 26.27 M | 12.00 M | 11.99 M |
| 2025 | 25.12 M | 24.99 M | 11.83 M | 11.77 M |
Passengers by Terminal
The Tom Bradley International Terminal is the busiest terminal at LAX, handling almost one in five of the airport's passengers.
- The Tom Bradley International Terminal handled 14.09 million passengers in 2025, including 13.05 million international travelers.9
- The West Gates (8.12 million) and Terminal 7 (8.06 million) ranked second and third in 2025.9
- Terminal 8 was the least busy of the numbered terminals, with 3.38 million passengers in 2025.9
- From January to August 2026, Tom Bradley handled 10.66 million passengers, while Terminal 5 recorded no passengers.10
| LAX Passengers by Terminal, 2025 and January–August 2026 | |||
|---|---|---|---|
| Terminal | Passengers (2025) | Share of 2025 Total | Passengers (Jan–Aug 2026) |
| Tom Bradley International Terminal | 14,092,126 | 19.1% | 10,659,144 |
| West Gates (MSC) | 8,117,707 | 11.0% | 5,368,544 |
| Terminal 7 | 8,060,839 | 10.9% | 5,637,236 |
| Terminal 3 | 7,021,603 | 9.5% | 4,845,035 |
| Terminal 6 | 6,705,919 | 9.1% | 4,563,838 |
| Terminal 1 | 6,602,729 | 9.0% | 5,555,196 |
| Terminal 2 | 6,559,533 | 8.9% | 4,553,293 |
| Terminal 5 | 6,106,739 | 8.3% | 0 |
| Terminal 4 | 5,720,108 | 7.8% | 4,229,689 |
| Terminal 8 | 3,375,990 | 4.6% | 2,451,117 |
| Other terminals | 1,346,301 | 1.8% | 1,054,558 |
Source · Los Angeles World Airports, Passenger Traffic Comparison by Terminal (December 2025 and August 2026 reports).
What is the total number of aircraft operations at Los Angeles International Airport each year?
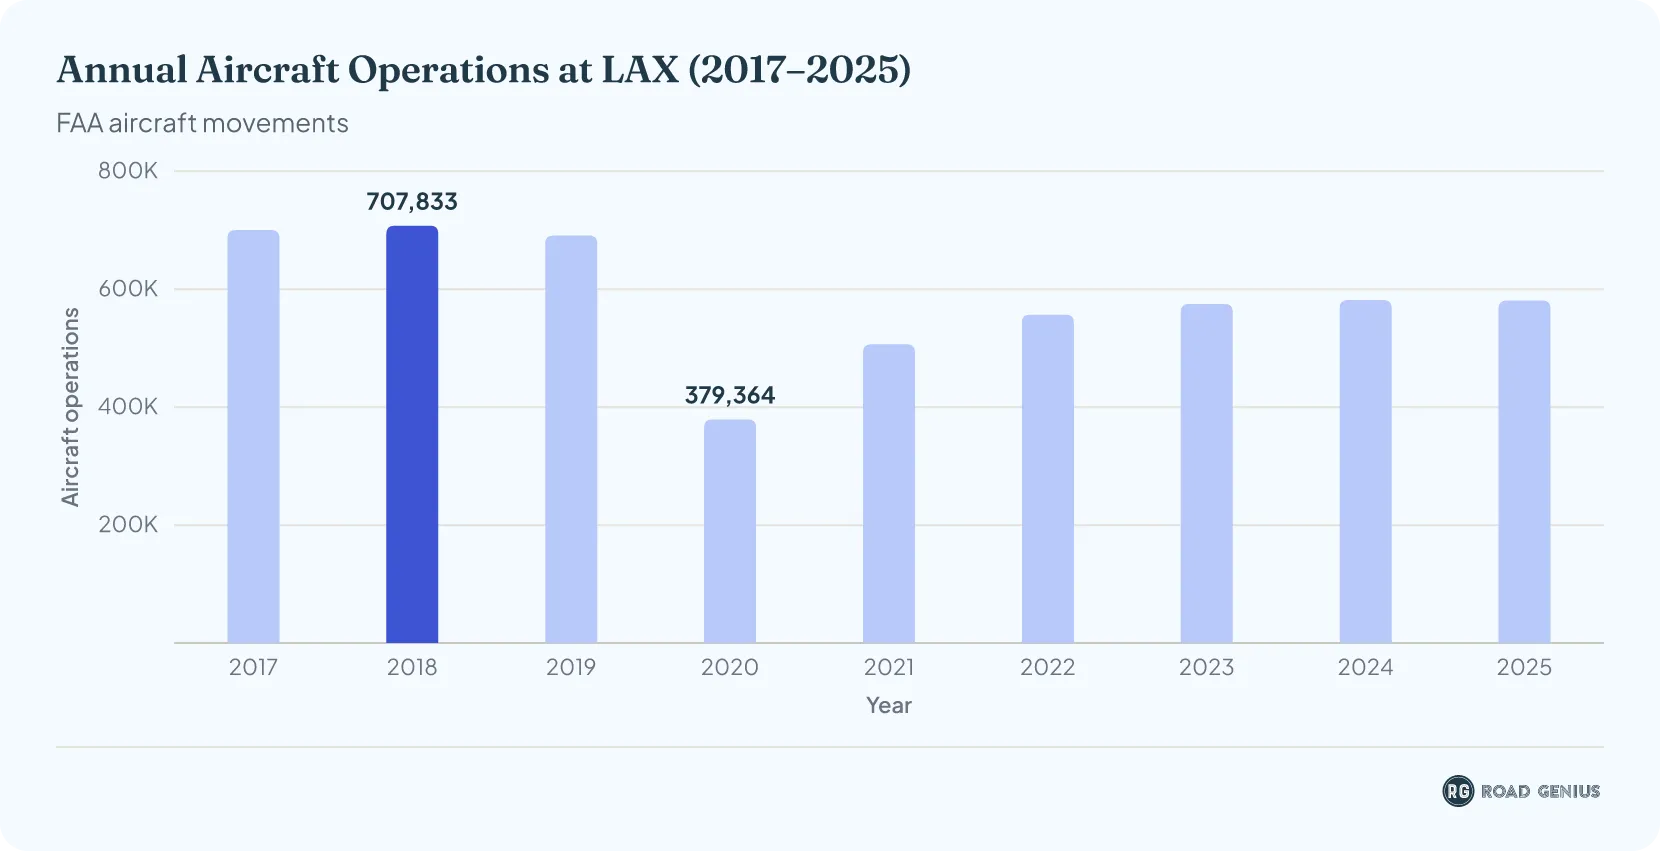
LAX recorded 580,996 total aircraft operations in 2025, representing a 0.13% decrease from the previous year11.
- LAX logged 580,996 aircraft movements in 2025, down from 581,779 in 20242 and up from 575,097 in 2023.11
- Pre-pandemic operations peaked at 707,833 movements in 2018, meaning 2025 levels remain about 18% below the 2018 peak.11
- Operations fell to 379,364 in 2020, rebounded to 506,769 in 2021 and 556,913 in 2022.11
Aircraft Operations by Type
| Aircraft Operations at Los Angeles International Airport by Type (2019-2025) | ||||
|---|---|---|---|---|
| Year | Air Carrier | Air Taxi | General Aviation | Military |
| 2019 | 634,515 | 38,505 | 17,853 | 384 |
| 2020 | 346,036 | 22,647 | 10,348 | 333 |
| 2021 | 464,803 | 27,623 | 13,948 | 395 |
| 2022 | 513,421 | 28,565 | 14,392 | 535 |
| 2023 | 540,404 | 21,110 | 13,105 | 478 |
| 2024 | 547,779 | 20,747 | 12,877 | 376 |
| 2025 | 546,465 | 22,041 | 12,234 | 256 |
Source · Note: The FAA counts air taxi operations separately from general aviation. Air taxi covers on-demand flights for hire in smaller aircraft (generally 60 seats or fewer), while general aviation covers other civil flying outside air carrier and air taxi services.
Which airlines operate the most flights out of Los Angeles International Airport?
LAX operates as a highly competitive "battleground hub" with no single airline maintaining majority market share, creating an unusually diverse competitive landscape among major carriers.
- Delta Air Lines leads with 18.9% market share, carrying 13.92 million passengers in 2025.12
- United Airlines holds 16.1% market share with 11.87 million passengers12, operating LAX as a major West Coast hub.
- American Airlines captures 15.3% market share with 11.31 million passengers12, maintaining significant West Coast presence.
- Southwest Airlines accounts for 8.4% market share with 6.19 million passengers12, focusing on domestic point-to-point service.
- Alaska Airlines represents 6.6% market share with 4.88 million passengers12, emphasizing West Coast and Alaska routes.
| Top 10 Airlines at LAX Airport by Passenger Volume (2025) | ||
|---|---|---|
| Airline | Passengers (millions) | Market Share |
| Delta Air Lines | 13.92 | 18.9% |
| United Airlines | 11.87 | 16.1% |
| American Airlines | 11.31 | 15.3% |
| Southwest Airlines | 6.19 | 8.4% |
| Alaska Airlines | 4.88 | 6.6% |
| Spirit Airlines | 2.15 | 2.9% |
| JetBlue Airways | 2.12 | 2.9% |
| Frontier Airlines | 1.85 | 2.5% |
| Air Canada | 1.11 | 1.5% |
| Volaris | 1.10 | 1.5% |
Trends in Passenger Traffic at Los Angeles International Airport
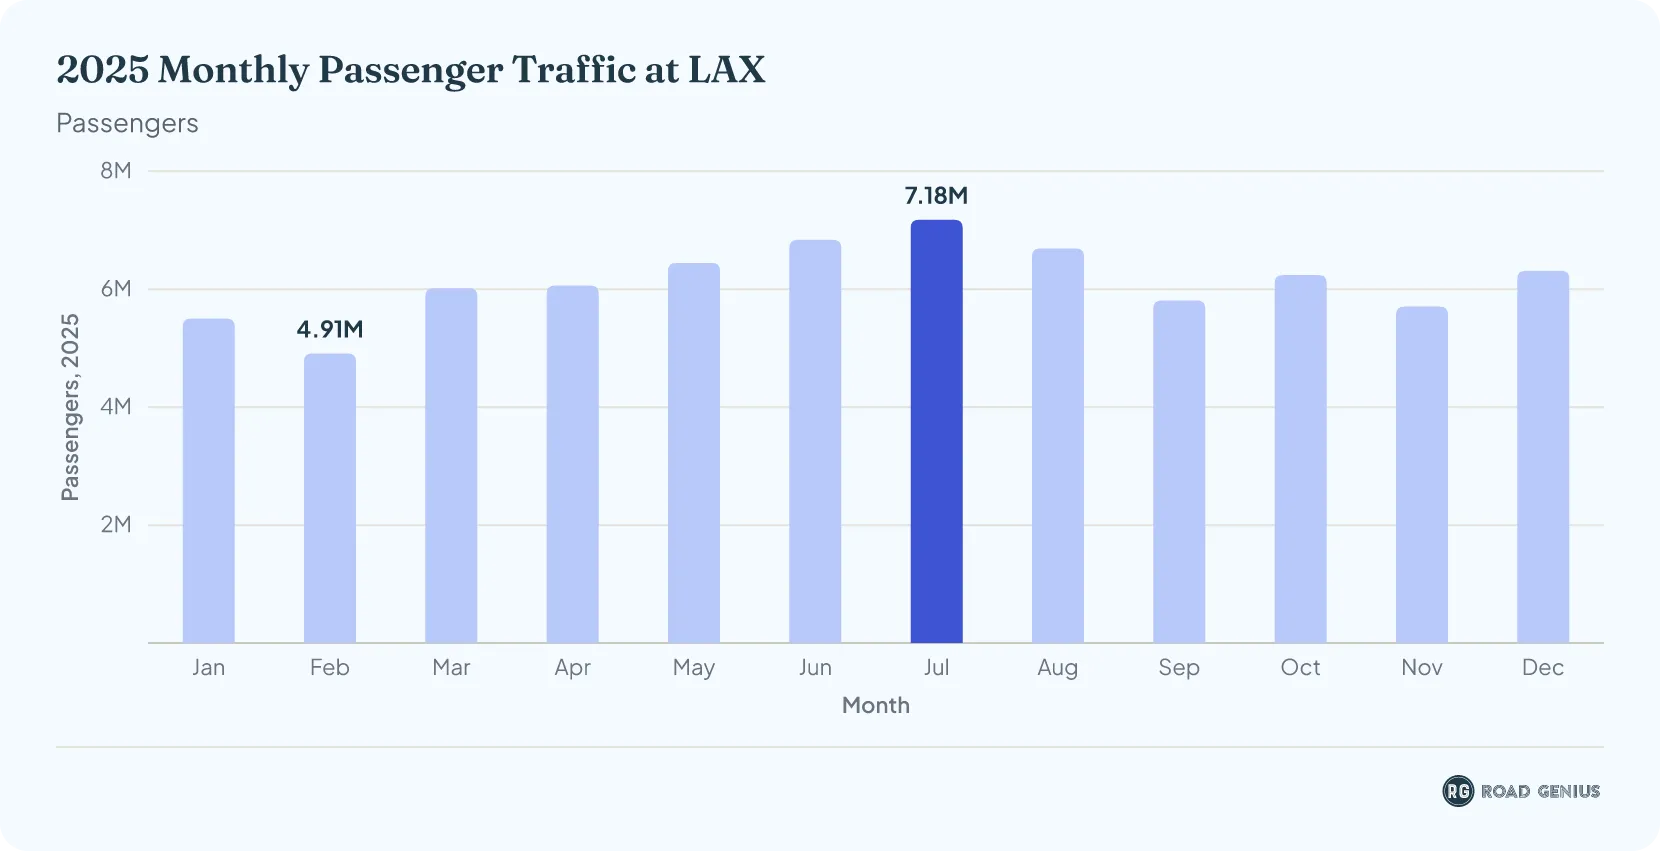
Passenger totals rise through late winter and spring, peak in mid‑summer, and taper off toward year‑end.
Most Popular Destinations from Los Angeles International Airport
Domestic Destinations
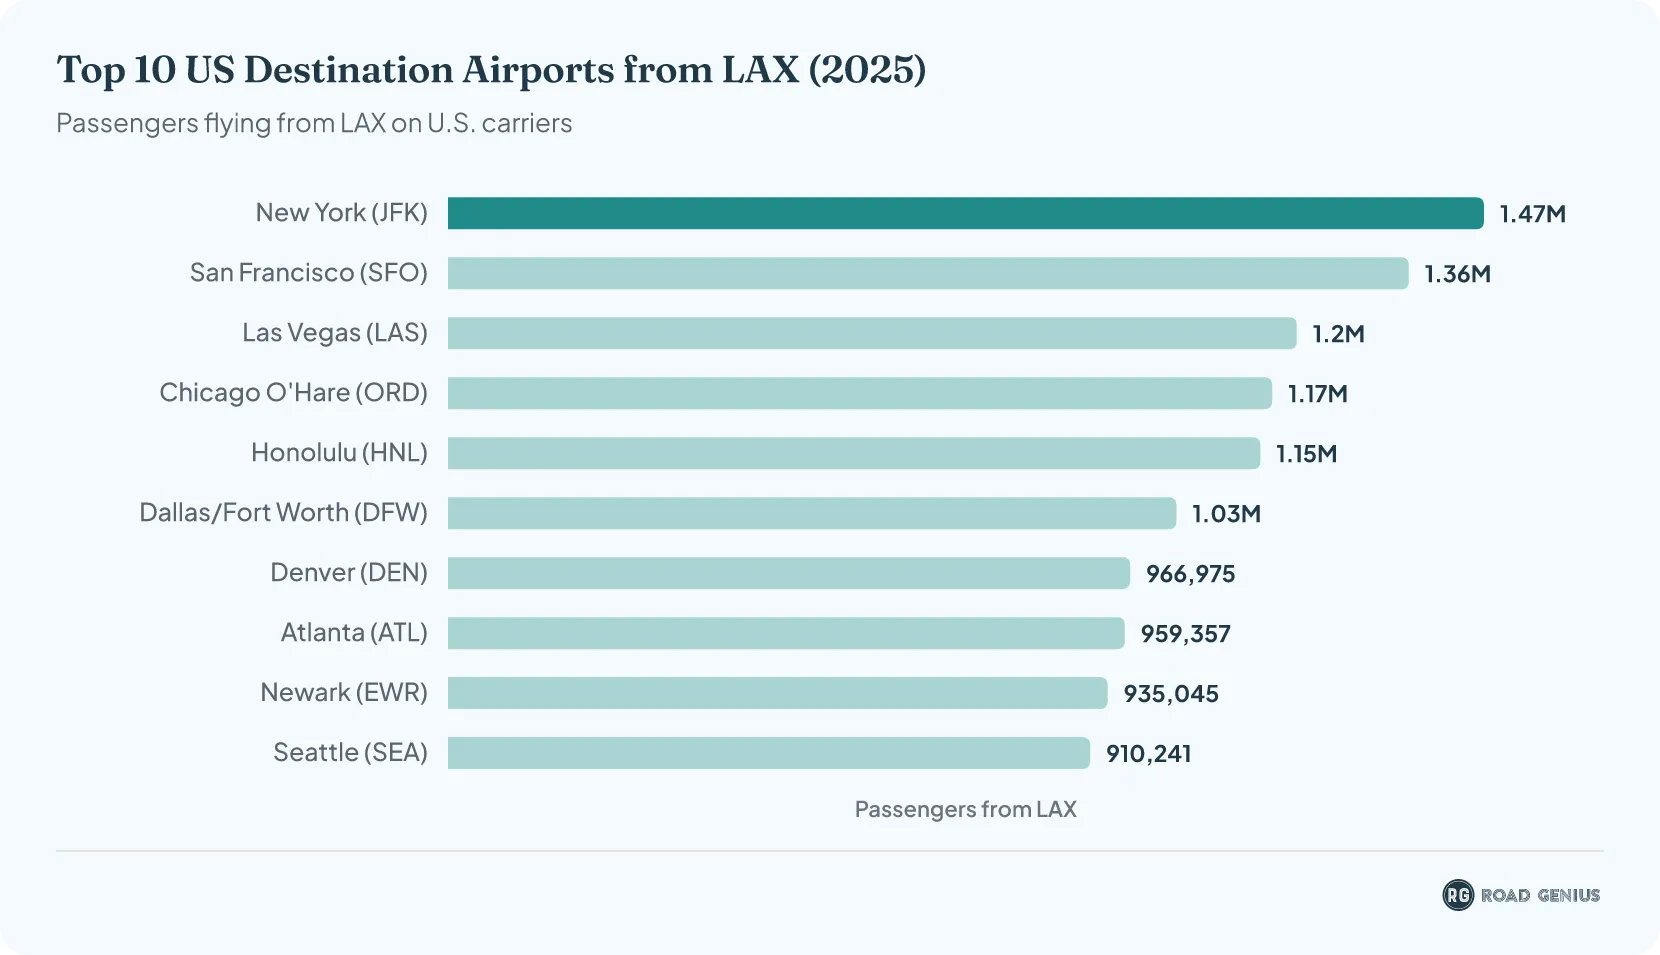
These figures count passengers flying from LAX to each airport, in one direction only. The international figures below count both directions, so the two lists are not directly comparable.
- 1.47 million passengers flew from LAX to New York-JFK in 2025, the most of any domestic route18, served by multiple carriers on this premium transcontinental route.
- San Francisco ranked second, with 1.36 million passengers flying from LAX18, representing a key West Coast business corridor.
- 1.2 million travelers flew from LAX to Las Vegas18, highlighting the strength of the leisure travel market.
- Around 1.17 million and 1.15 million passengers flew from LAX to Chicago O'Hare and Honolulu18, completing the top domestic destinations.
International Destinations
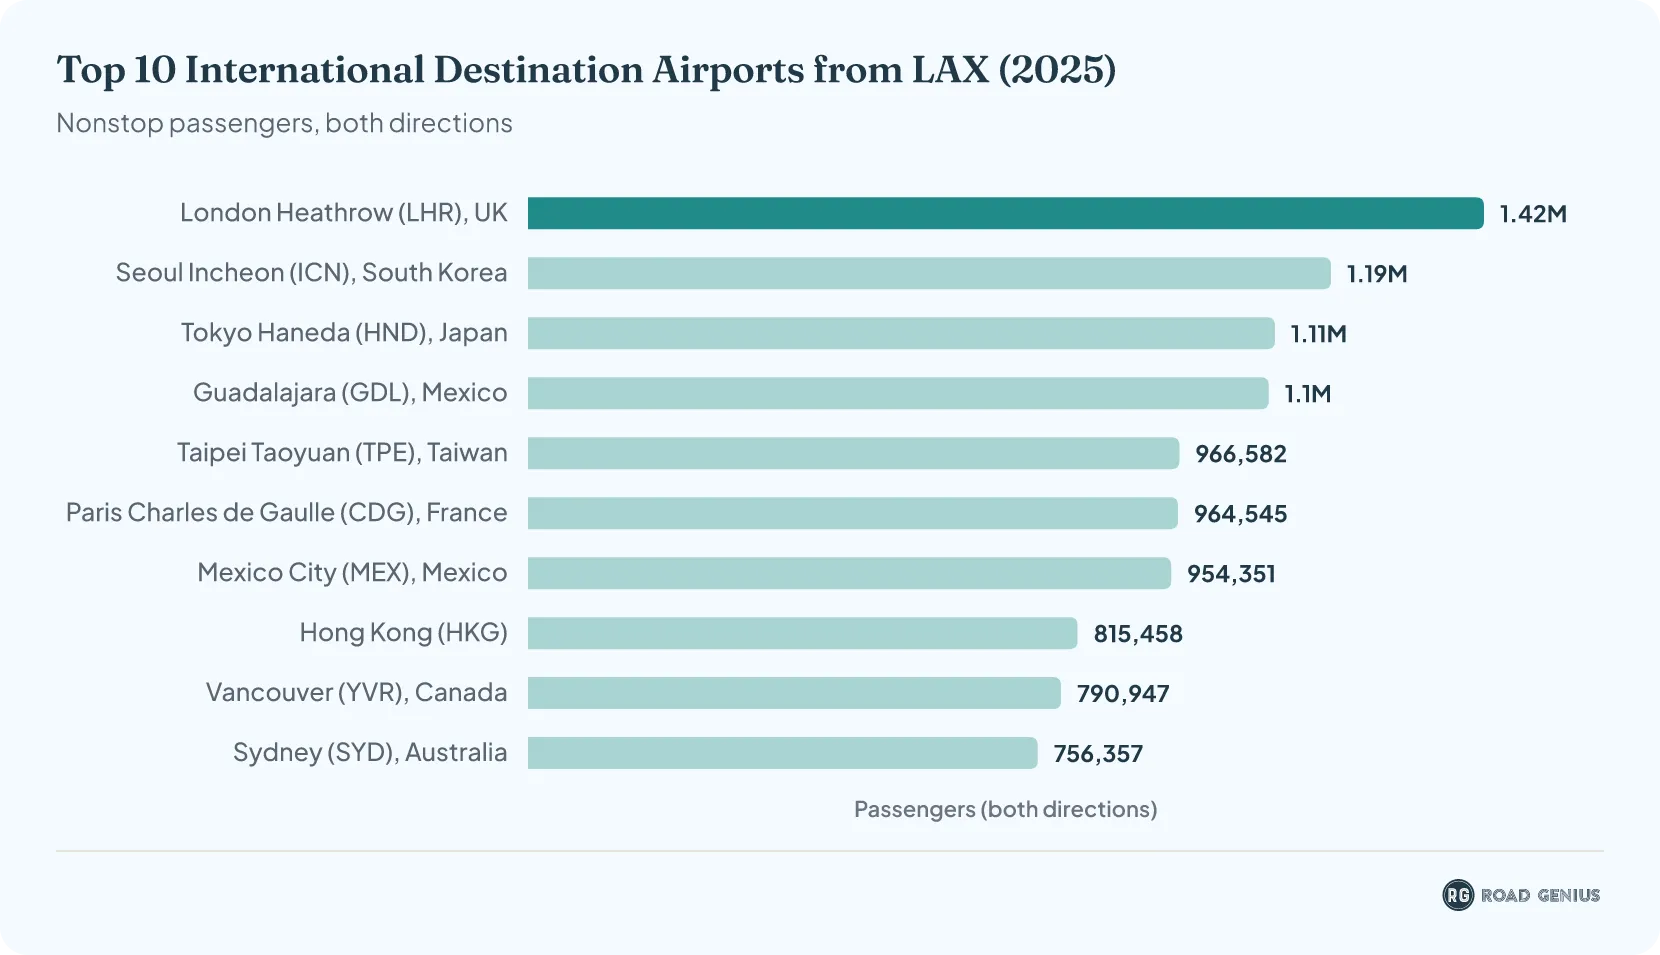
- London-Heathrow dominated international routes with 1.42 million passengers in 202519, served by four major airlines.
- Seoul-Incheon ranked second with 1.19 million passengers19, reflecting strong trans-Pacific business and leisure demand.
- Tokyo-Haneda ranked third with 1.11 million passengers19.
- Guadalajara, Mexico, and Taipei-Taoyuan completed the top five international destinations, with 1.10 million and 0.97 million passengers.19
Top International Markets
Mexico is the largest international market at LAX by a wide margin, followed by Canada and Japan.
- Mexico accounted for 4.42 million passengers on nonstop flights between LAX and foreign airports in 2025, 18.8% of the total.19
- Canada (2.00 million) and Japan (1.95 million) ranked second and third, followed by the United Kingdom (1.49 million).19
- Compared with 2024, traffic to China rose 28% and to Hong Kong 46%, while traffic to Canada fell 20%.19
- 11.47 million international travelers cleared U.S. Customs at LAX in 2025, 0.61% more than in 2024, and 91% of them arrived at the Tom Bradley International Terminal.2
- From January to August 2026, customs arrivals fell 1.62% to 7.73 million, although Terminal 7 grew 10.62%.1
| Top 10 Countries by LAX International Passengers, 2025 | |||||
|---|---|---|---|---|---|
| Rank | Country | Passengers (2025) | Share of LAX International | Passengers (2024) | Change |
| 1 | Mexico | 4,423,633 | 18.8% | 4,301,628 | +2.8% |
| 2 | Canada | 1,996,431 | 8.5% | 2,504,954 | -20.3% |
| 3 | Japan | 1,954,996 | 8.3% | 1,910,180 | +2.3% |
| 4 | United Kingdom | 1,486,230 | 6.3% | 1,699,806 | -12.6% |
| 5 | South Korea | 1,191,690 | 5.1% | 1,076,749 | +10.7% |
| 6 | Australia | 1,172,479 | 5.0% | 1,124,723 | +4.2% |
| 7 | France | 1,043,408 | 4.4% | 993,154 | +5.1% |
| 8 | China | 973,997 | 4.1% | 761,238 | +27.9% |
| 9 | Taiwan | 966,582 | 4.1% | 1,073,560 | -10.0% |
| 10 | Hong Kong | 815,458 | 3.5% | 558,772 | +45.9% |
Source · U.S. Department of Transportation, International Report: Passengers (T-100). Passengers on nonstop flights between LAX and each country, both directions, U.S. and foreign airlines; Canada is the sum of its provinces.
Car and Campervan Rental in Los Angeles
- Car Rental Burbank Airport (BUR)
- Car Rental Hollywood
- Campervan Rental Los Angeles
- Car Rental Los Angeles
- Car Rental Los Angeles Airport (LAX)
- Car Rental Santa Monica
- Car Rental Los Angeles to Las Vegas (One-Way)
- Car Rental Los Angeles to Palm Springs (One-Way)
- Car Rental Los Angeles to San Diego (One-Way)
- Car Rental Los Angeles to San Francisco (One-Way)
- Campervan Rental California
- Car Rental California
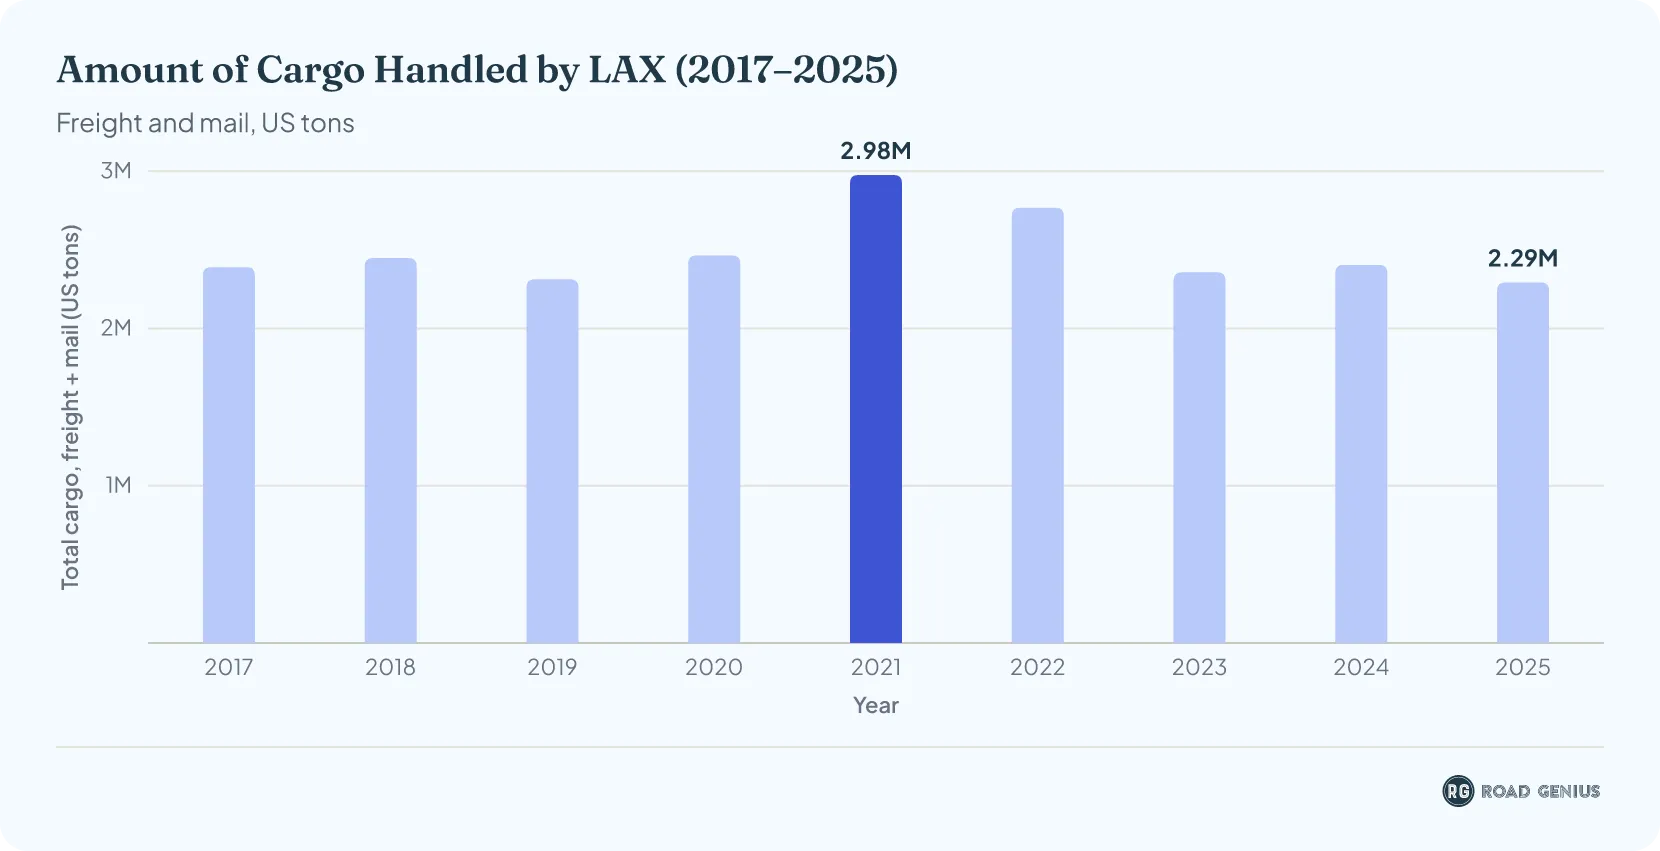
How much cargo does Los Angeles International Airport handle annually?
LAX handles over 2 million tons of cargo annually, demonstrating the airport's importance as a freight gateway.
On-Time Performance at Los Angeles International Airport
- On‑time arrivals (2025): 80.4% (2nd among the 30 major U.S. airports, up from 8th in 2024)6
Financial Statistics of Los Angeles International Airport
- Los Angeles International Airport generated an operating revenue of $2.05 billion in the fiscal year ending in June 2025, which reflects an increase from $1.93 billion in FY 2024.22
- Operating expenses also rose from $940 million in FY 2024 to $1.02 billion in FY 2025.22
- Despite the higher expenses, operating income increased from $228.9 million in FY 2024 to $233.9 million in FY 202522, indicating improved financial performance year-over-year.
| LAX Operating Financial Performance: FY 2023-2025 (YE June) | |||
|---|---|---|---|
| Metric | FY 2023 | FY 2024 | FY 2025 |
| Operating Revenue | $1,727.3 M | $1,926.5 M | $2,047.5 M |
| Operating Expenses | $832.4 M | $940.0 M | $1,019.5 M |
| Operating Income before Depreciation and Amortization | $894.9 M | $986.5 M | $1,027.9 M |
| Depreciation and Amortization | $689.8 M | $757.6 M | $794.1 M |
| Operating Income | $205.1 M | $228.9 M | $233.9 M |
How do passengers get to and from LAX?
Most travelers reach LAX by private car, while rideshare services account for about one in five vehicle trips on the terminal roadways.
- 33.14 million vehicle trips were counted on LAX's upper and lower terminal roadways in 2025, an average of 90,792 a day and 5.2% fewer than in 2024.23
- Private vehicles made 21.65 million of those trips (65%), while rideshare services such as Uber and Lyft made 6.78 million (20%), down 9.6% from 2024.23
- Taxis made 788,900 trips, down 14.3%, and FlyAway buses made 74,887.23
- Rental car companies recorded 2.16 million on-airport rental transactions at LAX in 2025; Hertz had the largest share (19.6%), followed by Avis (16.8%) and Enterprise (13.6%).24
More Statistics
- Cincinnati Airport (CVG) Statistics
- St. Pete-Clearwater Airport Statistics
- Fort Lauderdale Airport (FLL) Statistics
- Southwest Florida Airport Statistics
- George Bush Airport (IAH) Statistics
- Harry Reid Airport (LAS) Statistics
- Hilo International Airport Statistics
- Houston Hobby Airport Statistics
- Indianapolis International Airport Statistics
- Ithaca Tompkins International Airport Statistics
- O’Hare International Airport Statistics
- Palm Beach Airport (PBI) Statistics
Incidents at Los Angeles International Airport
- October 2013: Two small dry‑ice devices detonated at Terminal 2 and the Tom Bradley International Terminal, causing brief disruptions but no injuries.25
- November 1, 2013: A gunman in Terminal 3 killed a TSA officer and wounded three others26; operations resumed after security clearance.
- August 28, 2016: False reports of an active shooter caused panicked evacuations, 281 flight delays and 27 diversions.27
- May 20, 2017: Aeroméxico Flight 642 struck a provisioning truck while taxiing to its gate; all eight people on the truck were injured.28
- July 25, 2018: Prop wash from a taxiing Dash 8 blew a baggage dolly into the right engine of United Flight 739, a Boeing 737; the damage was minor.29
- November 21, 2019: Philippine Airlines Flight 113 returned after an engine stall; no injuries.30
- August 19, 2020: FedEx Flight 1026 landed with gear failure; one pilot injured while exiting.31
- July 8, 2024: A United 757 lost a main wheel after takeoff but landed safely in Denver.32
- July 18, 2025: Delta Flight 446 returned to LAX following a left-engine fire; passengers continued on another aircraft.33
Los Angeles International Airport Quick Answers
How many passengers use LAX each day?
About 202,000 on average. LAX handled 73.71 million passengers in 2025, which works out to roughly 201,900 a day.
How many flights take off and land at LAX each day?
About 1,590. LAX recorded 580,996 aircraft operations (takeoffs and landings) in 2025, or roughly 1,592 a day.
What is the busiest month at LAX?
July. In 2025, July was the busiest month with 7.18 million passengers, while February was the quietest with 4.91 million.
Which is the busiest terminal at LAX?
The Tom Bradley International Terminal, which handled 14.09 million passengers in 2025, about 19% of the airport's total.
Has LAX recovered to pre-pandemic traffic levels?
Not yet. The 73.71 million passengers in 2025 were about 16% below the record 88.07 million set in 2019.
References
- Los Angeles World Airports — LAX Traffic Comparison (TCOM), August 2026 and calendar year to date · lawa.org ↑ b c d e f g
- Los Angeles World Airports — LAX Traffic Comparison (TCOM), December 2025 and calendar year to date · lawa.org ↑ b c d e f g h
- Los Angeles World Airports — LAX 10-Year Summary: Passengers · lawa.org ↑ b c
- FAA — Final CY2025 Commercial Service Airports Enplanements · faa.gov ↑ b
- World's Busiest Airports: Atlanta Holds, Asia Climbs (2026 ACI World Airport Traffic Dataset) · aci.aero ↑ b
- BTS — Table 4: Ranking of Major Airport On-Time Arrival Performance, Year-to-date December 2003–December 2025 · bts.gov ↑ b
- FAA — Final Calendar Year 2025 All-Cargo Landed Weight · faa.gov ↑
- Los Angeles World Airports — LAX Volume of Air Traffic, December 2025 · lawa.org ↑ b
- Los Angeles World Airports — LAX Passenger Traffic Comparison by Terminal, December 2025 and calendar year to date · lawa.org ↑ b c
- Los Angeles World Airports — LAX Passenger Traffic Comparison by Terminal, August 2026 and calendar year to date · lawa.org ↑
- Los Angeles World Airports — LAX 10-Year Summary: FAA Aircraft Movements · lawa.org ↑ b c d
- Los Angeles World Airports — LAX Airline Market Share Summary, January to December 2025 · lawa.org ↑ b c d e
- Los Angeles World Airports — LAX Traffic Comparison (TCOM), July 2025 and calendar year to date · lawa.org ↑
- Los Angeles World Airports — LAX Traffic Comparison (TCOM), June 2025 · lawa.org ↑
- Los Angeles World Airports — LAX Traffic Comparison (TCOM), August 2025 · lawa.org ↑
- Los Angeles World Airports — LAX Traffic Comparison (TCOM), February 2025 · lawa.org ↑
- Los Angeles World Airports — LAX Traffic Comparison (TCOM), November 2025 · lawa.org ↑
- BTS TranStats — T-100 Domestic Market (U.S. Carriers): domestic passengers by origin and destination airport · transtats.bts.gov ↑ b c d
- US DOT International Report: Passengers (T-100, nonstop traffic between US and foreign airports) · data.transportation.gov ↑ b c d e f g
- Los Angeles World Airports — LAX 10-Year Summary: Air Freight and Air Mail (tons) · lawa.org ↑
- Los Angeles World Airports — LAX 10-Year Summary: Air Mail (tons) · lawa.org ↑
- Los Angeles World Airports — LAX Annual Financial Information (Continuing Disclosure Report) for the Fiscal Year Ended June 30, 2025 · lawa.org ↑ b c
- Los Angeles World Airports — LAX Ground Transportation Monthly Report, December 2025 and year to date · lawa.org ↑ b c
- Los Angeles World Airports — LAX On- and Off-Airport Rental Car Monthly Stats, Calendar Year 2025 · lawa.org ↑
- Second Dry Ice Bomb Goes Off At L.A. Airport · npr.org ↑
- San Fernando Valley Man Who Admitted Murdering TSA Officer During 2013 Shooting Spree at LAX Sentenced to Life plus 60 Years · justice.gov ↑
- Active Shooter Report Delays Flights, Spreads Alarm at LAX · abcnews.com ↑
- LAX Media Statement: Collision Between AeroMexico Aircraft and Provisioning Truck · lawa.org ↑
- United Airlines, Boeing 757-200, N62892: Incident occurred July 25, 2018 at Los Angeles International Airport (KLAX), California (reproduces the FAA incident record) · kathrynsreport.com ↑
- Philippine Airlines Boeing 777-300 returns to Los Angeles after engine failure · aviation24.be ↑
- FedEx cargo jet makes pre-dawn emergency landing in Los Angeles · cnn.com ↑
- United Airlines Boeing plane loses wheel after takeoff from Los Angeles and lands safely in Denver · nbcnews.com ↑
- Delta flight makes emergency landing at LAX following visible engine fire captured on video · foxnews.com ↑
- LAWA — Statistics for LAX · lawa.org
- International Destinations of Passengers from Raleigh-Durham International Airport · data.transportation.gov
- BTS TranStats — Airport profiles (route information by airport) · transtats.bts.gov
- Incidents at Jackson–Medgar Wiley Evers International Airport — NTSB · ntsb.gov
- Los Angeles World Airports — LAX Traffic Comparison (TCOM), January 2026 and calendar year to date · lawa.org
- Los Angeles World Airports — LAX Traffic Comparison (TCOM), February 2026 and calendar year to date · lawa.org
- Los Angeles World Airports — LAX Traffic Comparison (TCOM), March 2026 and calendar year to date · lawa.org
- Los Angeles World Airports — LAX Traffic Comparison (TCOM), April 2026 and calendar year to date · lawa.org
- Los Angeles World Airports — LAX Traffic Comparison (TCOM), May 2026 and calendar year to date · lawa.org
- Los Angeles World Airports — LAX Traffic Comparison (TCOM), June 2026 and calendar year to date · lawa.org
- Los Angeles World Airports — LAX Traffic Comparison (TCOM), July 2026 and calendar year to date · lawa.org

