

 Popular Countries
 24/7 Support
Updated
Denver International Airport at a glance
These are the headline numbers for Denver International Airport (DEN), from the airport's own reports and Airports Council International.
- Passengers: a record 82.4 million in 20253, or about 226,000 a day4.
- 2026 so far: 48.1 million passengers from January to July 2026, 1.2% more than in the same months of 20255.
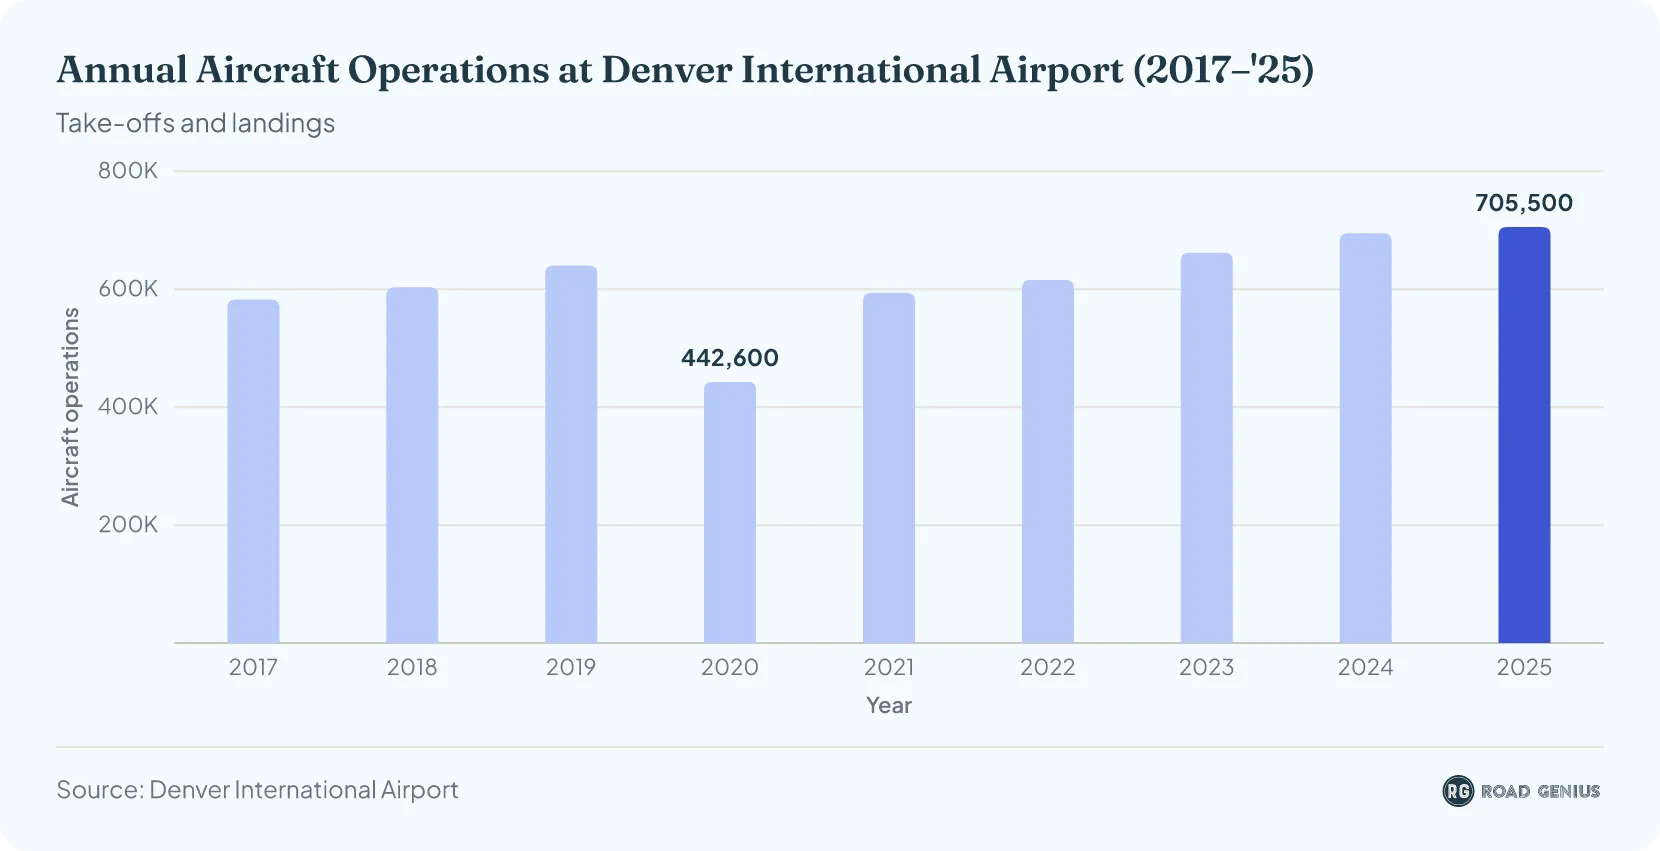
- Flights: 705,469 take-offs and landings in 20252, or about 1,930 a day.
- Rankings: the fourth-busiest airport in the United States and the tenth-busiest in the world by passengers1, and fourth in the world for aircraft movements4.
- Biggest airline: United Airlines, which carried 50.3% of DEN's passengers in 20252.
- Size: 53 square miles (33,600 acres), the largest airport in North America by land area61, with six runways.
- Cargo: 733 million lb in 20252.
- Revenue: $1.32 billion in operating revenue in 20251, also a record.
- Busiest day: Sunday, July 6, 2025, when 97,507 passengers went through security3.
Denver International Airport Statistics 2026 (Year to Date)
Denver International Airport handled 48.1 million passengers from January to July 2026, 1.2% more than in the same months of 2025.5
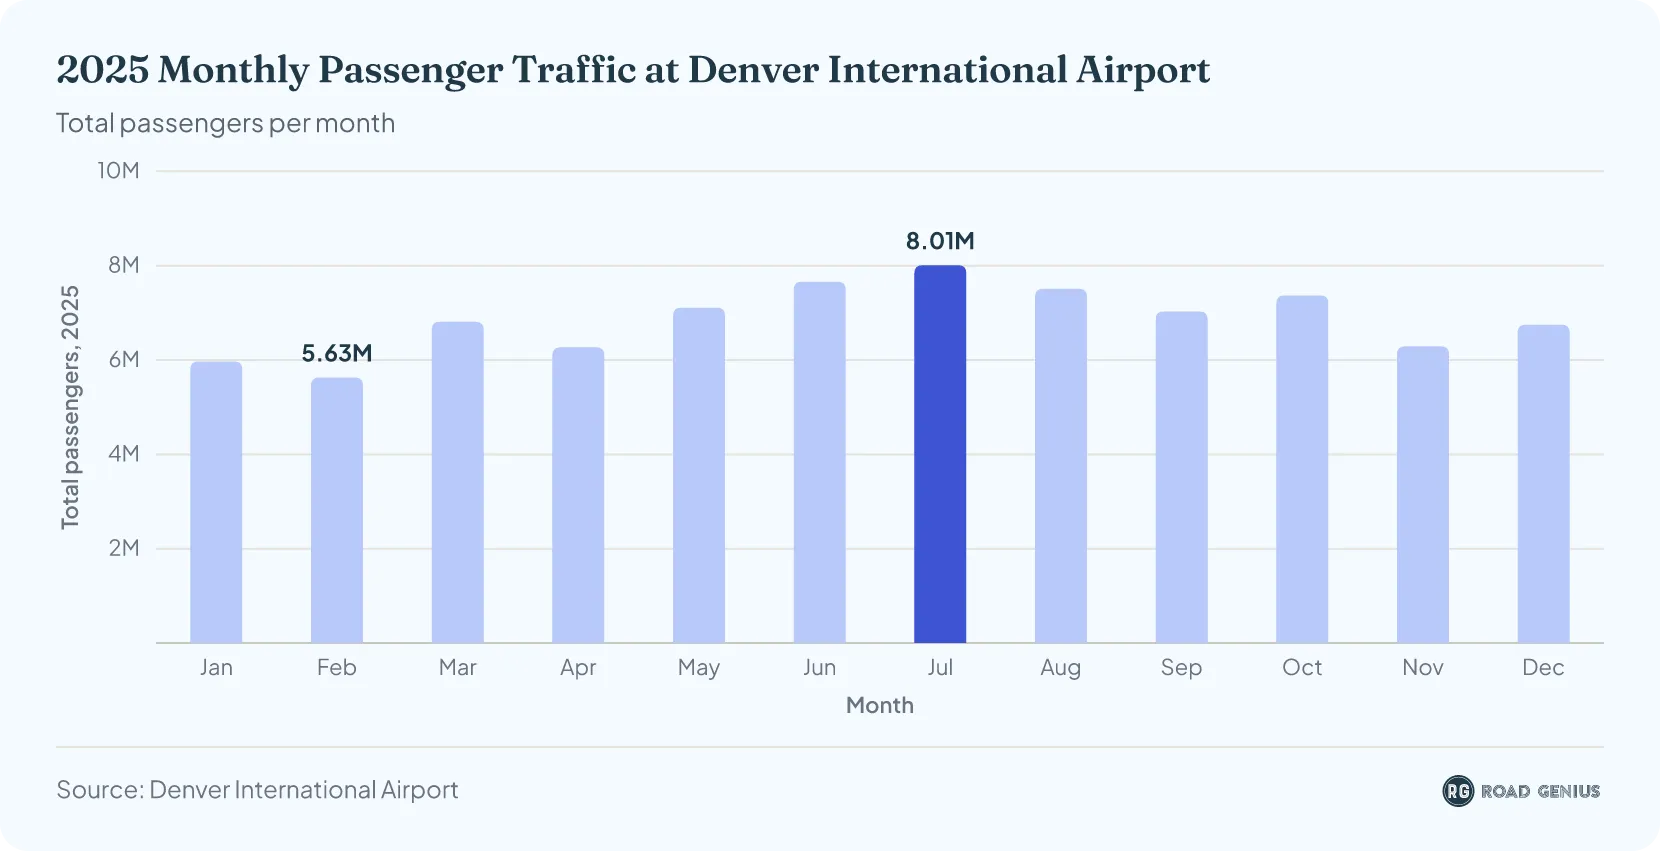
- July was the busiest month so far, with 7.99 million passengers, just short of the 8.01 million in July 2025.5
- February was the quietest month, with 5.75 million passengers5.
- Aircraft operations reached 414,504 by the end of July, up 1.5% on 20255.
- Cargo totaled 414 million lb, down 0.5% on 2025.5
Latest available: July 2026; the airport has not yet published its August figures.
| Denver International Airport traffic by month, 2026 | ||||||
|---|---|---|---|---|---|---|
| Month | Passengers | Passengers vs 2025 | Domestic passengers | International passengers | Aircraft operations | Cargo (lb) |
| January | 5,908,930 | -1.1% | 5,538,669 | 370,261 | 54,201 | 54,954,421 |
| February | 5,745,132 | +2.0% | 5,416,987 | 328,145 | 51,400 | 56,554,530 |
| March | 6,998,313 | +2.8% | 6,579,487 | 418,826 | 60,027 | 60,883,796 |
| April | 6,367,686 | +1.5% | 5,986,261 | 381,425 | 56,858 | 61,310,303 |
| May | 7,212,119 | +1.4% | 6,774,143 | 437,976 | 61,139 | 59,432,044 |
| June | 7,836,735 | +2.3% | 7,342,307 | 494,428 | 64,129 | 59,741,982 |
| July | 7,989,401 | -0.2% | 7,482,128 | 507,273 | 66,750 | 61,183,064 |
| January–July | 48,058,316 | +1.2% | 45,119,982 | 2,938,334 | 414,504 | 414,060,140 |
Source · Denver International Airport, Operations and Traffic reports, January–July 2026.
How many passengers use Denver airport a year?
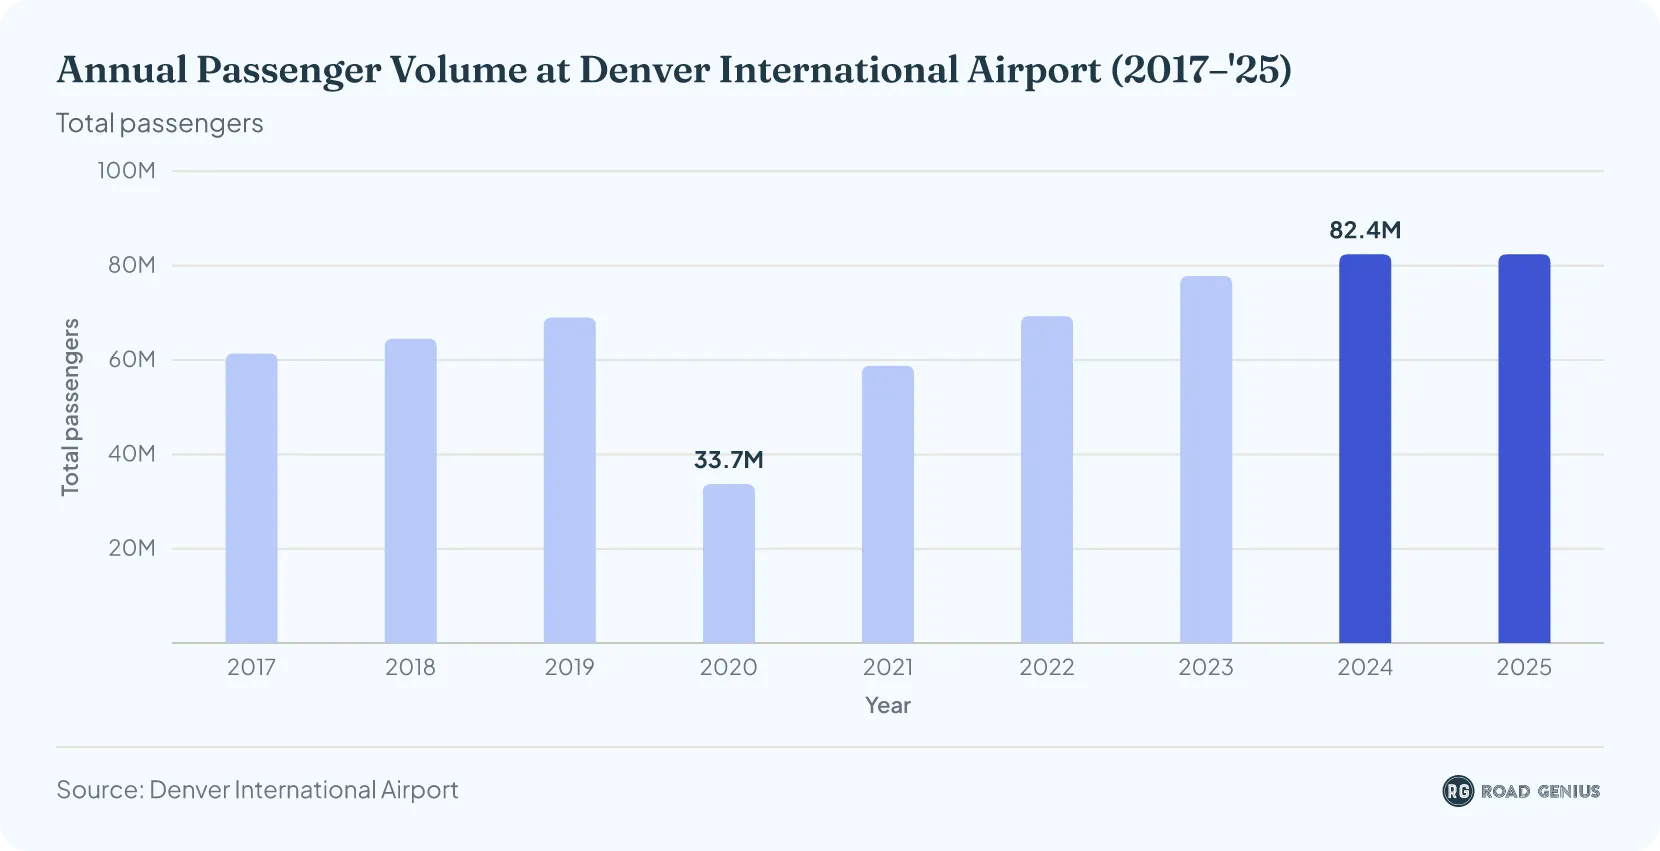
Denver International Airport handled over 80 million passengers in 2025, edging past its 2024 record and maintaining its position among the world’s busiest airports.
- The airport handled 82.4 million passengers in 2025, a new record just ahead of 2024's total.2
- That works out to an average of about 226,000 passengers a day.4
- Pre-pandemic levels were surpassed in 2022 with 69.3 million passengers7, above the 69 million recorded in 20198.
- Passenger volume fell to 33.7 million in 20209 at the height of the pandemic, then rebounded to 58.8 million in 20218 and 77.8 million in 20237.
Inbound vs Outbound Passengers
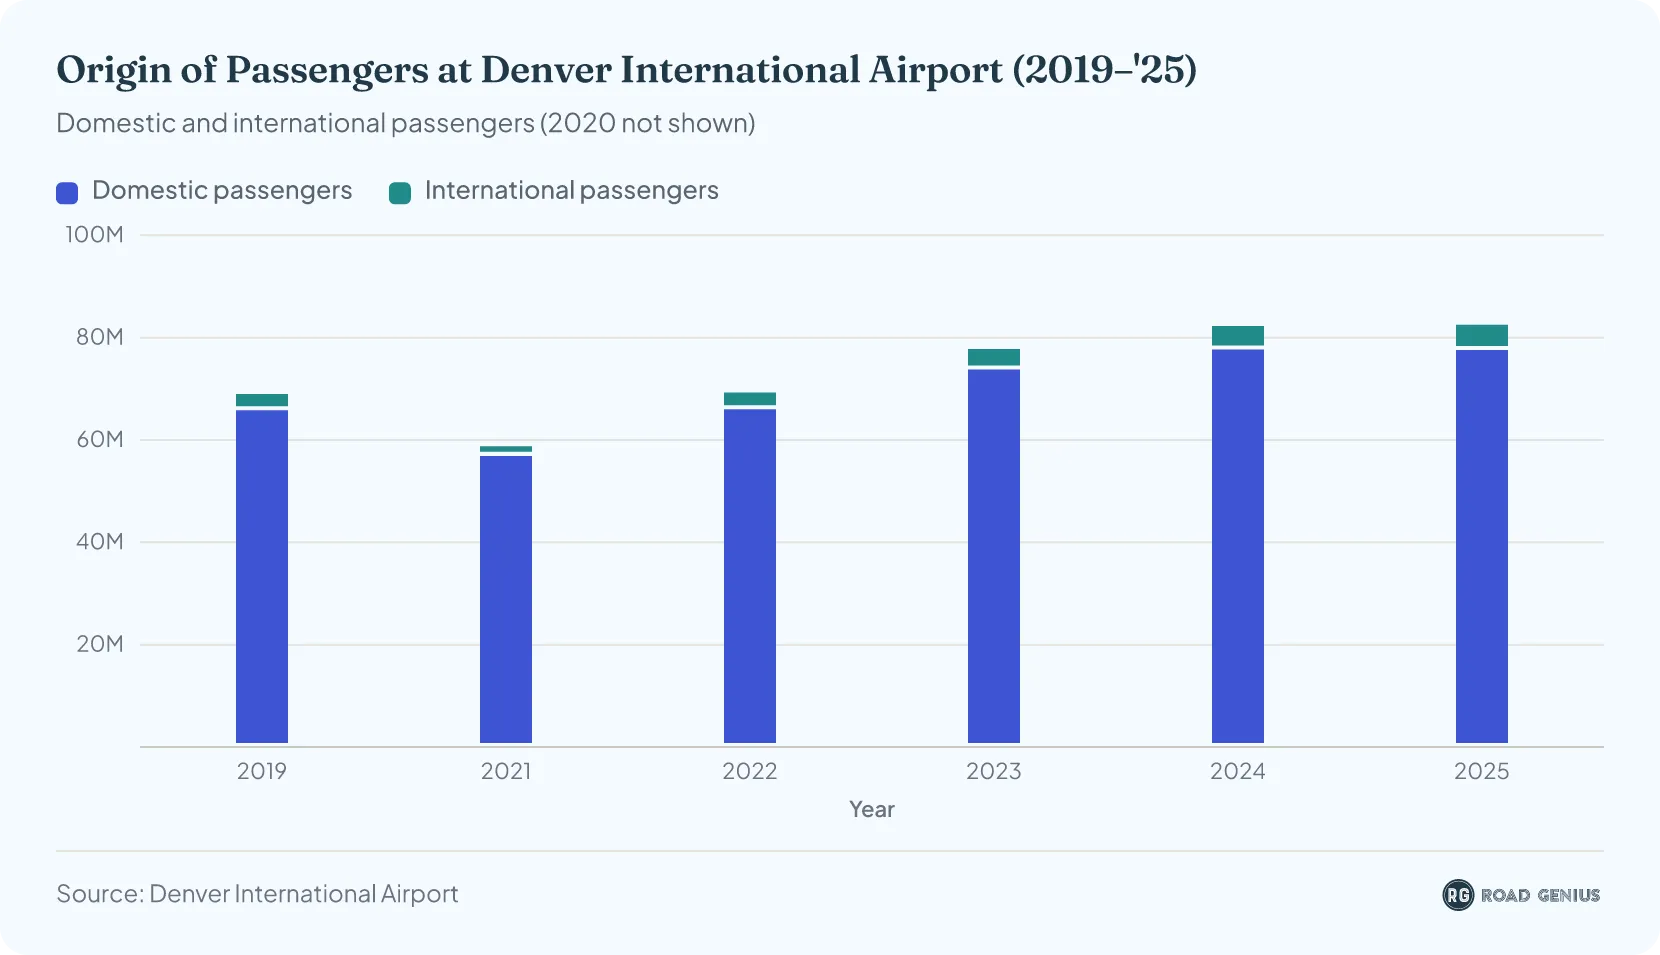
DEN demonstrates a relatively balanced flow of inbound and outbound traffic, reflecting its dual role as both a destination airport and a major connecting hub.
| Passenger Flow: Inbound vs Outbound (2022-2025) | ||||
|---|---|---|---|---|
| Year | Domestic Inbound | Domestic Outbound | International Inbound | International Outbound |
| 2022 | 32,970,000 | 33,000,000 | 1,680,000 | 1,640,000 |
| 2023 | 36,910,000 | 36,890,000 | 2,030,000 | 2,000,000 |
| 2024 | 38,890,000 | 38,830,000 | 2,330,000 | 2,320,000 |
| 2025 | 38,790,000 | 38,770,000 | 2,440,000 | 2,430,000 |
How has passenger traffic at Denver airport changed since 1995?
Denver International Airport opened on February 28, 199510, replacing Stapleton International Airport. It handled 31.1 million passengers that year, a total that includes the first two months of 1995 at Stapleton11.
- Traffic grew through the late 1990s to 38.8 million passengers in 200012, then fell back to 35.7 million in 200213 after the September 11 attacks.
- DEN passed 50 million passengers for the first time in 2008, with 51.2 million14.
- It passed 60 million in 2017, with 61.4 million15, and reached 69.0 million in 2019, a record that stood until 202216.
- The pandemic cut traffic to 33.7 million in 20209, about the same as in the airport's second year.
- DEN has set a new record every year since: 69.3 million in 2022, 77.8 million in 20237, 82.4 million in 2024 and 82.4 million again in 20253.
- In 2025 the airport handled more than two and a half times as many passengers as in 199611, its first full year of operation.
| Denver International Airport passengers by year, 1995–2025 | ||
|---|---|---|
| Year | Total passengers | Change on previous year |
| 1995 | 31.1 million | — |
| 1996 | 32.3 million | +4.0% |
| 1997 | 35.0 million | +8.3% |
| 1998 | 36.8 million | +5.3% |
| 1999 | 38.0 million | +3.3% |
| 2000 | 38.8 million | +1.9% |
| 2001 | 36.1 million | −6.9% |
| 2002 | 35.7 million | −1.2% |
| 2003 | 37.5 million | +5.2% |
| 2004 | 42.3 million | +12.7% |
| 2005 | 43.4 million | +2.6% |
| 2006 | 47.3 million | +9.1% |
| 2007 | 49.9 million | +5.4% |
| 2008 | 51.2 million | +2.8% |
| 2009 | 50.2 million | −2.1% |
| 2010 | 52.2 million | +4.1% |
| 2011 | 52.8 million | +1.2% |
| 2012 | 53.2 million | +0.6% |
| 2013 | 52.6 million | −1.1% |
| 2014 | 53.5 million | +1.7% |
| 2015 | 54.0 million | +1.0% |
| 2016 | 58.3 million | +7.9% |
| 2017 | 61.4 million | +5.3% |
| 2018 | 64.5 million | +5.1% |
| 2019 | 69.0 million | +7.0% |
| 2020 | 33.7 million | −51.1% |
| 2021 | 58.8 million | +74.4% |
| 2022 | 69.3 million | +17.8% |
| 2023 | 77.8 million | +12.3% |
| 2024 | 82.4 million | +5.8% |
| 2025 | 82.4 million | +0.1% |
Source · Denver International Airport traffic reports (1995–2000), Denver Municipal Airport System financial reports (2001–2018) and DEN passenger traffic press releases (2015–2025). 1995 includes January and February at Stapleton International Airport.
How many flights does Denver airport handle a day?
| Aircraft Operations at Denver International Airport by Type (2022–'25) | ||||
|---|---|---|---|---|
| Type | 2022 | 2023 | 2024 | 2025 |
| Air Carrier | 510,345 | 579,760 | 609,341 | 610,489 |
| Air Taxi | 101,753 | 78,812 | 82,128 | 91,678 |
| General Aviation | 3,466 | 3,289 | 3,262 | 3,036 |
| Military | 169 | 149 | 169 | 266 |
Source · Air taxi operations are flights for hire, carrying passengers or cargo on aircraft with 60 or fewer seats, including many commuter flights. General aviation covers all other civil flights, such as private and business aircraft, and is counted separately.
How many runways does Denver International Airport have?
Denver International Airport has six runways: four run north–south and two run east–west.1
How does Denver International Airport compare with other major US airports?
Denver was the fourth-busiest US airport by passengers in 2025, behind Atlanta, Dallas/Fort Worth and Chicago O'Hare, and it ranked fourth in the world for aircraft movements.4
- Atlanta (ATL) led with 106.3 million passengers4, about 24 million more than Denver.
- Dallas/Fort Worth (DFW) (85.7 million) and Chicago O'Hare (ORD) (84.9 million)4 were each within 3.5 million passengers of Denver.
- Denver's passenger total was 19.4% higher than in 2019, the strongest growth of the five airports in the table.4
| Denver vs the busiest US airports, 2025 | ||||
|---|---|---|---|---|
| Airport | Passengers (2025) | World rank (passengers) | Aircraft movements (2025) | World rank (movements) |
| Atlanta (ATL) | 106,302,208 | 1 | 807,625 | 2 |
| Dallas/Fort Worth (DFW) | 85,660,127 | 4 | 743,394 | 3 |
| Chicago O'Hare (ORD) | 84,856,018 | 6 | 857,392 | 1 |
| Denver (DEN) | 82,427,962 | 10 | 701,335 | 4 |
| Los Angeles (LAX) | 73,709,594 | 13 | 580,996 | 6 |
Source · ACI World, World Airport Traffic Dataset 2026 edition (2025 data). ACI compiles movements under its own counting method, so Denver's figure here differs slightly from the airport's own count of 705,469 used elsewhere on this page.
Biggest airlines at Denver airport: market share 2025
In 2025, two carriers dominated DEN and together carried more than three‑quarters of all passengers.2
| Airlines at Denver International Airport by Passenger Volume (2022–'25) | ||||
|---|---|---|---|---|
| Airline | 2022 | 2023 | 2024 | 2025 |
| United | 32,100,000 | 36,400,000 | 38,900,000 | 41,400,000 |
| Southwest | 21,200,000 | 24,000,000 | 25,600,000 | 24,000,000 |
| Frontier | 6,800,000 | 7,500,000 | 8,300,000 | 7,600,000 |
| Delta | 3,400,000 | 3,700,000 | 3,600,000 | 3,300,000 |
| American | 2,700,000 | 2,700,000 | 2,800,000 | 2,800,000 |
| Other | 3,100,000 | 3,500,000 | 3,100,000 | 3,200,000 |
What is the busiest month at Denver International Airport?
Passenger numbers show clear seasonality. Traffic builds early in the year, peaks in mid‑summer, and tapers toward year‑end.
Busiest days and times at Denver airport
Beyond the summer peak in monthly traffic, DEN's busiest days fall on weekends and around public holidays, and its security checkpoints have three rush periods every day.
- Busiest day on record: Sunday, July 6, 2025, when 97,507 passengers went through DEN's TSA checkpoints3.
- Busiest month on record: July 2025, the first month in the airport's history with more than 8 million passengers3.
- Sundays: the TSA says Sundays are typically the busiest screening days at DEN throughout the summer17.
- Thanksgiving: more than 845,000 passengers were forecast over the 2025 Thanksgiving travel period, nearly 10% more than in 2024, with Sunday, November 30 expected to be the busiest day at more than 96,000 passengers18.
- Independence Day: more than 844,000 passengers were forecast from June 25 to July 6, 202619.
- Labor Day: more than 368,000 passengers were forecast over the 2026 Labor Day weekend, with more than 87,000 a day on the busiest days, Friday, September 4 and Monday, September 720.
- Busiest times of day: the airport's peak security times are 3 to 4:30 a.m., 8 to 10 a.m. and 3 to 5 p.m., and DEN advises arriving at least two hours before boarding20.
- Security lanes: the East and West security checkpoints each have 17 screening lanes21.
What are the most popular routes from Denver International Airport?
Domestic Destinations
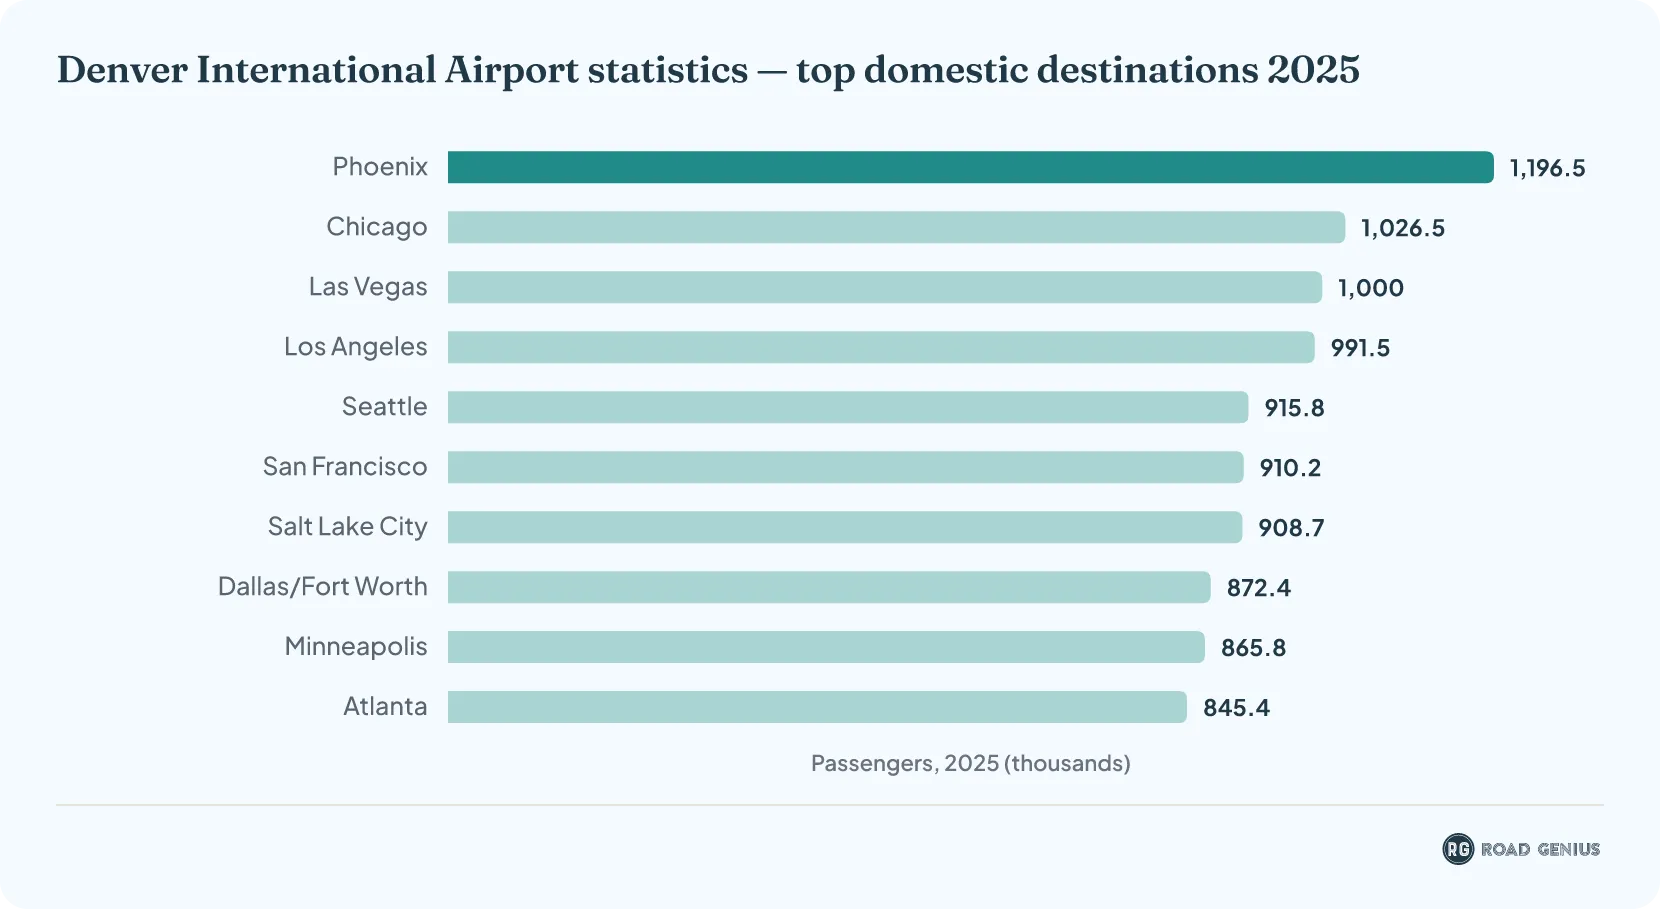
- Phoenix remained the most popular domestic destination from Denver International Airport (DEN) in 2025, with approximately 1.2 million passengers.22
- It was followed by Chicago, with around 1.03 million travelers22, and Las Vegas with just under 1 million.
- Los Angeles saw approximately 991,000 passengers22, while Seattle completed the top five with 915,820 travelers.
International Destinations
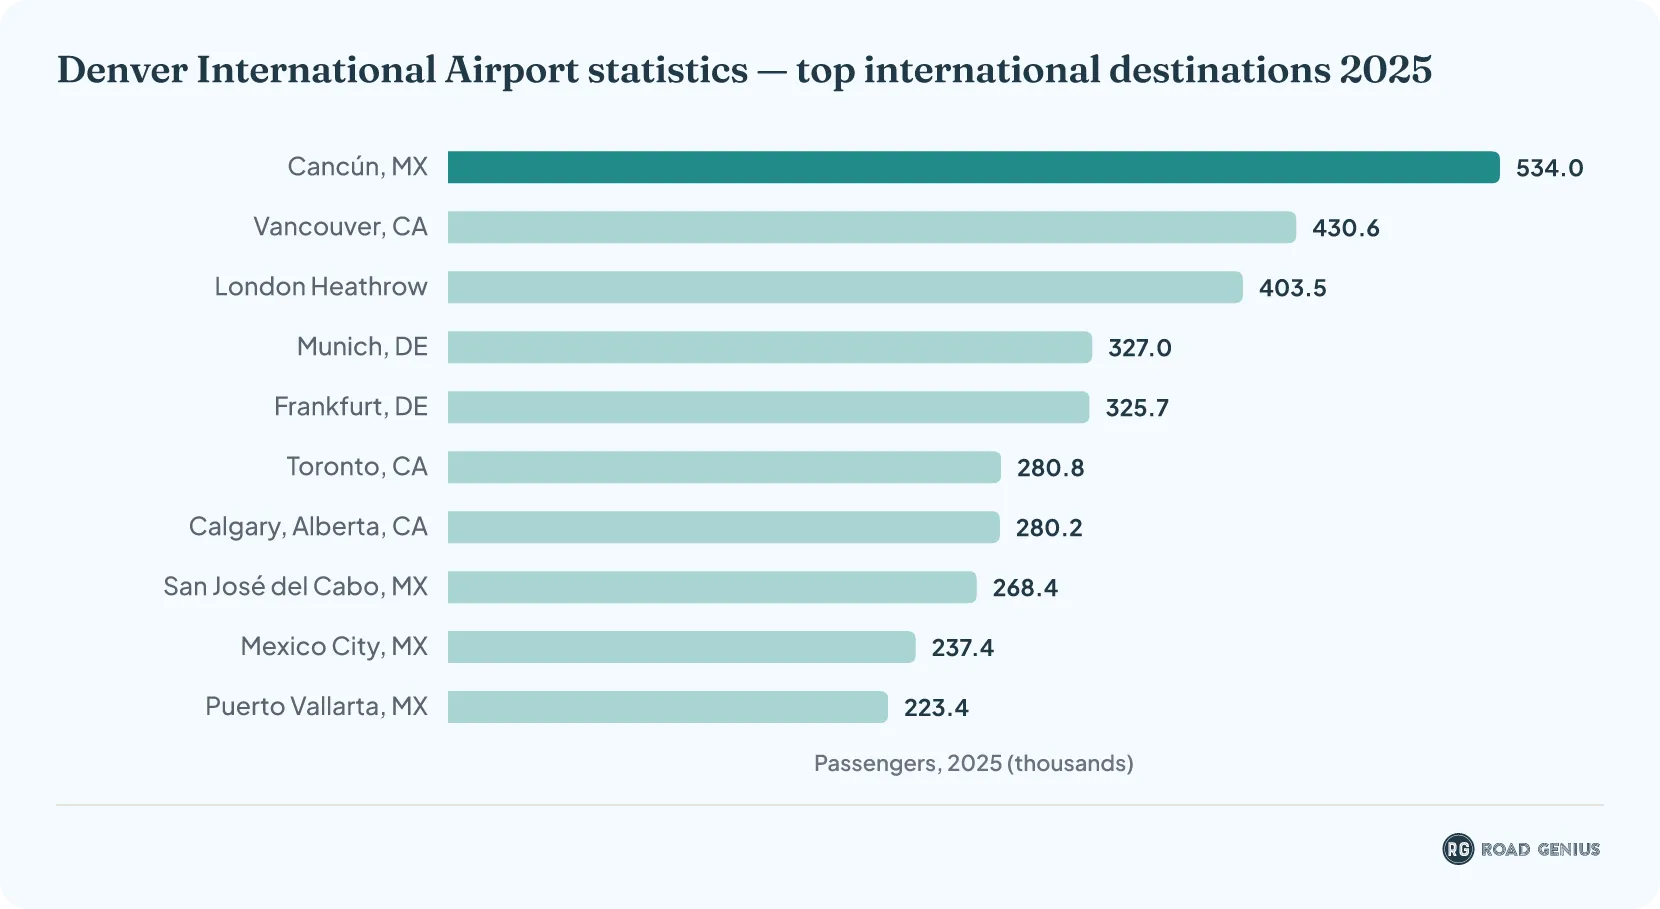
- Cancún, Mexico (CUN), with 534,046 passengers, was the most popular international destination from Denver International Airport (DEN) in 2025.23
- Vancouver, Canada (YVR) and London, United Kingdom (LHR) follow with 430,601 and 403,521 passengers, respectively23.
- Munich (327,022) and Frankfurt (325,695)23, both in Germany, complete the top five international destinations.
How do you get from Denver airport to downtown Denver?
Denver International Airport sits about 23 miles northeast of downtown Denver6, so the trip into the city takes roughly 25 to 40 minutes, depending on how you travel.
- Train: the RTD A Line leaves from the Transit Center on Level 1 of the terminal, next to the Westin hotel24, and runs to Denver Union Station.
- Journey time: the 23-mile train ride takes about 37 minutes, with trains every 15 minutes from 6 a.m. to 8 p.m. and every 30 minutes in the early morning and late evening25.
- Train fare: any trip starting or ending at the airport needs an airport fare. The Airport Day Pass costs $10, and young people aged 19 and under ride free26.
- Taxi: taxis pick up from Level 5, Island 1, and charge a flat fare of $72.04 to downtown Denver (Zone A), with the airport access fee included27.
- Ride-share: Uber and Lyft pick up from Island 5 on Level 5, on either side of the terminal28. DEN puts the drive downtown at 25 to 35 minutes, depending on traffic24.
- Rental car: more than 10 major rental car companies serve the airport. Their lots are on airport property and are reached by a courtesy shuttle from Level 5, Island 429.
How much does a rental car cost at Denver airport?
A rental car picked up at Denver International Airport typically costs $55 to $63 a day from October to December 2026, roughly half the $118 to $125 a day it costs from May to August 2027. These are the typical daily rates rental companies quoted for a seven-day hire at the airport when we checked prices on September 30, 2026.
- Cheapest month: December 2026, at a typical $55 a day, with budget cars at about $48 a day.
- Ski season: prices climb to $73 to $87 a day from January to March 2027, as winter visitors head for the Colorado mountains.
- Most expensive months: June to August 2027, at $122 to $125 a day, matching the airport's busiest months for passengers.
- Campervans: a campervan from Denver typically costs $119 to $134 a day from October 2026 to May 2027, rising to $208 a day in July and $229 a day in August 2027.
Prices for later months were quoted many months ahead of pick-up, so they mix seasonal demand with the effect of booking early.
| Denver airport rental car and campervan prices per day by month | ||||
|---|---|---|---|---|
| Pick-up month | Typical car | Budget car | Premium car | Typical campervan |
| October 2026 | $63 | $51 | $93 | $127 |
| November 2026 | $57 | $49 | $84 | $131 |
| December 2026 | $55 | $48 | $78 | $131 |
| January 2027 | $73 | $57 | $176 | $134 |
| February 2027 | $82 | $68 | $105 | $134 |
| March 2027 | $87 | $76 | $120 | $134 |
| April 2027 | $70 | $66 | $103 | $119 |
| May 2027 | $118 | $83 | $140 | $127 |
| June 2027 | $122 | $101 | $153 | $149 |
| July 2027 | $123 | $94 | $152 | $208 |
| August 2027 | $125 | $115 | $154 | $229 |
Source · Typical daily rate (median of all quotes) for a seven-day hire picked up on a Wednesday, in US dollars, from our price checks of rental companies at Denver International Airport (cars) and in Denver (campervans) on September 30, 2026. Later months were priced further ahead of pick-up.
Car and Campervan Rental in Denver
- Car Rental Boulder
- Car Rental Colorado Springs
- Car Rental Denver International Airport (DEN)
- Car Rental Denver
- Campervan Rental Denver
- Car Rental Fort Collins
- Car Rental Denver to Aspen (One-Way)
- Car Rental Denver to Breckenridge (One-Way)
- Car Rental Denver to Las Vegas (One-Way)
- Car Rental Denver to Salt Lake City (One-Way)
- Car Rental Denver to Vail (One-Way)
- Car Rental Colorado
How much cargo does Denver International Airport handle annually?
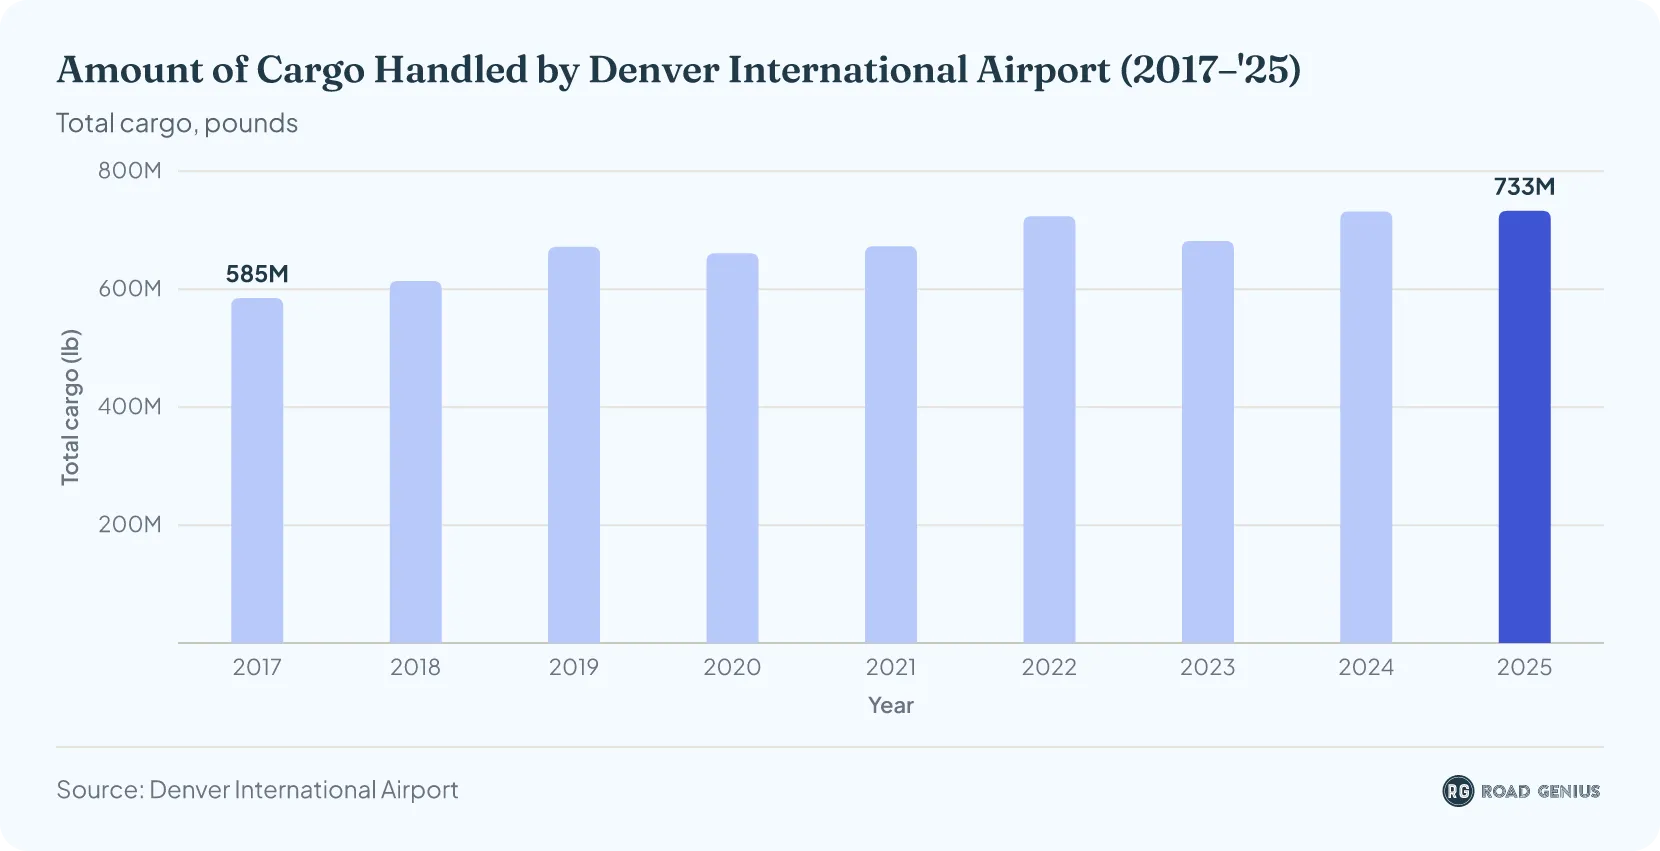
Denver International Airport handled 733 million lb of cargo in 20252, edging past 2024's 732 million lb.
- Cargo tonnage has grown from 672 million lb in 201930 to 733 million lb in 2025.
- Cargo dipped slightly to 661 million lb in 202030, then rose to 673 million lb in 20218 and 724 million lb in 20227.
- Volumes eased to 682 million lb in 20237 before reaching 732 million lb in 2024 and 733 million lb in 2025.2
How often are flights delayed at Denver International Airport?
In 2025, fewer flights at DEN ran on time than in 2024, but cancellations fell. Figures cover domestic flights by major U.S. airlines.22
How much money does Denver International Airport make?
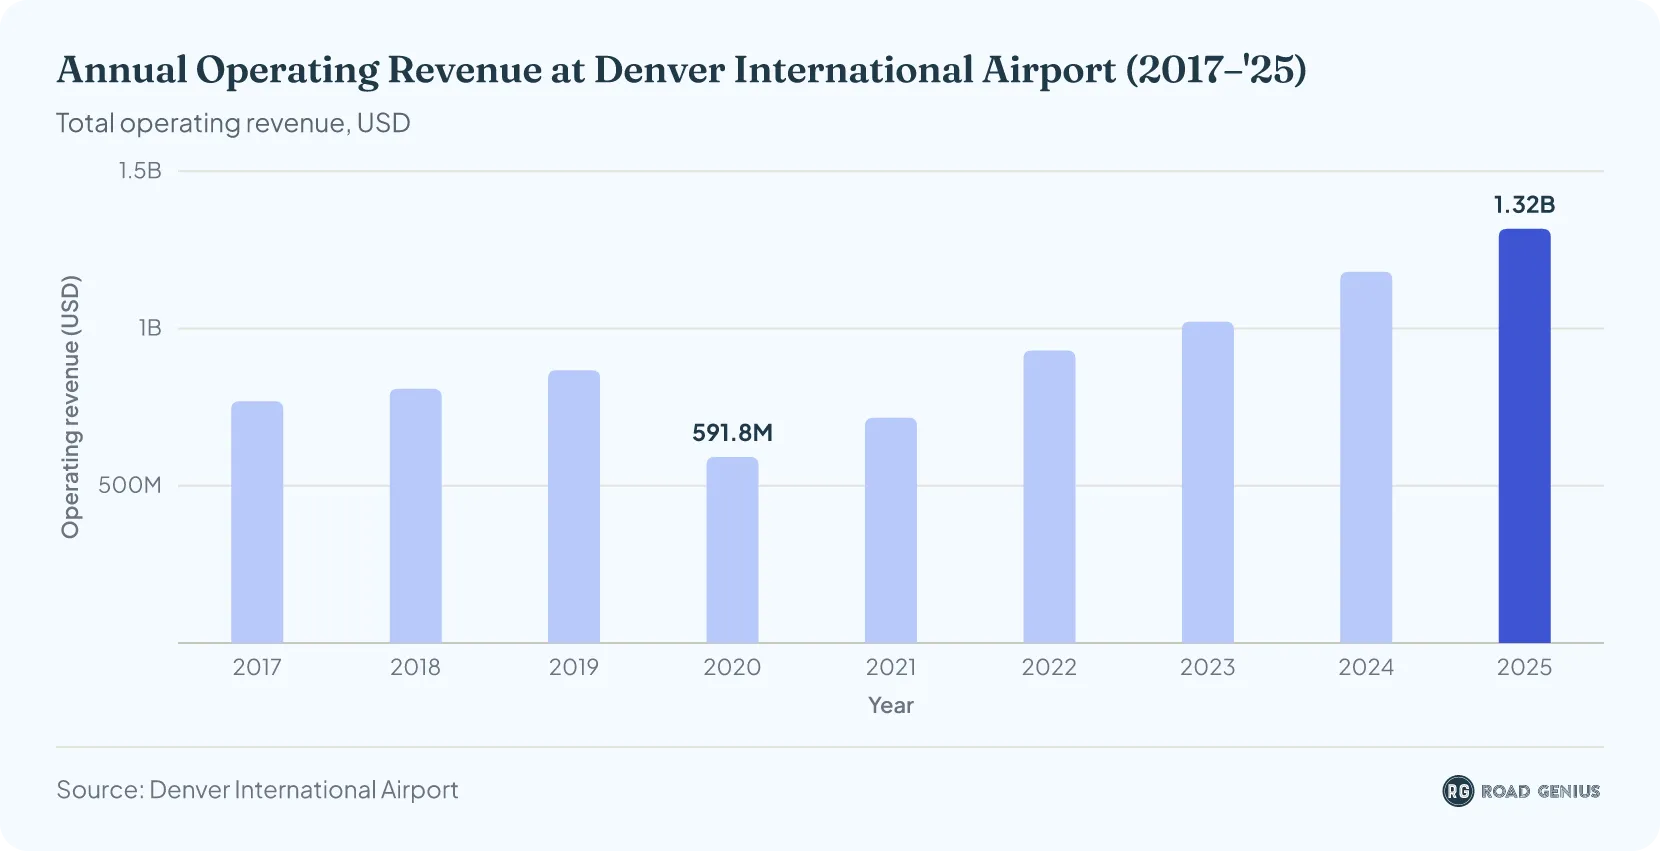
Denver International Airport has earned more than $1 billion in annual operating revenue every year since 2023, setting a new record of $1.32 billion in 2025.1
- Denver International Airport generated a total operating revenue of $1.32 billion in 20251, reflecting continued growth from $1.18 billion in 2024 and $1.02 billion in 2023.
- The upward trend followed a recovery from the pandemic-impacted years, with $591.8 million in 2020, $716.4 million in 2021 and $930.2 million in 20221.
- Prior to the pandemic, the airport had earned $867.8 million in 20191.
More Statistics
- Atlantic City International Airport Statistics
- Bangor International Airport (BGR) Statistics
- Daytona Beach International Airport Statistics
- Piedmont Triad Airport Statistics
- Harry Reid Airport (LAS) Statistics
- Indianapolis International Airport Statistics
- Miami International Airport Statistics
- Midway International Airport Statistics
- Missoula Montana Airport (MSO) Statistics
- Pensacola International Airport Statistics
- T.F. Green International Airport Statistics
- Westchester County Airport (HPN) Statistics
Accidents and incidents at Denver International Airport
- February 16, 2007: At least 21 windshields cracked on 14 aircraft; investigators blamed foreign object debris, possibly sand blown by strong winds, but could not pin down exactly what it was.31
- December 20, 2008: Continental Flight 1404 veered off Runway 34R and caught fire; 47 injuries, no fatalities.32
- April 3, 2012: ExpressJet Flight 5912 landed hard and short of the runway after smoke filled the cockpit; passengers evacuated and one was taken to hospital.33
- February 20, 2021: United Flight 328 returned after engine damage; debris fell over Broomfield, but the aircraft landed safely and no injuries were reported.34
How big is Denver International Airport?
- DEN covers 53 square miles (33,600 acres)1, making it the largest airport in North America by land area6.
- The “Vision 100” expansion plan aims to prepare the airport to serve 100 million passengers annually within the next eight to 10 years1.
- In 2025 traffic rankings, DEN was fourth in the United States, tenth worldwide1, and fourth worldwide for aircraft operations4.
References
- Denver Municipal Airport System — Annual Comprehensive Financial Report for the fiscal years ended December 31, 2025 and 2024 · flydenver.com ↑ b c d e f g h i j k l m n o p
- Denver International Airport — Operations and Traffic Report, December 2025 (Airline Dashboard) · flydenver.com ↑ b c d e f g h i j k l m n o p q r s t u v w
- Denver International Airport Sees Slight Growth in Passenger Traffic Over Previous Year · flydenver.com ↑ b c d e
- World's Busiest Airports: Atlanta Holds, Asia Climbs (2026 ACI World Airport Traffic Dataset) · aci.aero ↑ b c d e f g h i
- Denver International Airport — Operations and Traffic Report, July 2026 (Airline Dashboard) · flydenver.com ↑ b c d e f
- Denver International Airport | EROS (USGS Earthshots) · eros.usgs.gov ↑ b c
- Denver International Airport — Operations and Traffic Report, December 2023 · flydenver.com ↑ b c d e
- Denver International Airport Reports 2021 Passenger Traffic · flydenver.com ↑ b c
- Denver International Airport Sees Passenger Traffic Fall 51% in 2020 · flydenver.com ↑ b
- Denver International Airport Celebrates 25 Years of Success and Growth · flydenver.com ↑
- Denver International Airport Monthly Traffic Report, December 1996 (archived) · web.archive.org ↑ b
- Denver International Airport Monthly Traffic Report, December 2000 (archived) · web.archive.org ↑
- Denver Municipal Airport System Financial Report 2003 · cdn.flydenver.com ↑
- Denver Municipal Airport System Financial Report 2008 · cdn.flydenver.com ↑
- Denver Municipal Airport System Audited Financial Statements 2018 · cdn.flydenver.com ↑
- Denver International Airport Sets All-Time Passenger Traffic Record in 2022 · flydenver.com ↑
- TSA ready for busy summer travel season at Colorado airports · tsa.gov ↑
- Thanksgiving Holiday Travel Surge Expected at Denver International Airport · flydenver.com ↑
- DEN Welcomes Peak Summer Crowds for Independence Day Holiday Travel Period · flydenver.com ↑
- Summer Travel Season Wraps Up With Busy Labor Day Weekend at Denver International Airport · flydenver.com ↑ b
- DEN Celebrates Opening of East Security Checkpoint · flydenver.com ↑
- BTS TranStats — Airport profiles (route information by airport) · transtats.bts.gov ↑ b c d e f g h
- US DOT International Report: Passengers (T-100, nonstop traffic between US and foreign airports) · data.transportation.gov ↑ b c
- DEN Ground Transportation: Trains, Taxis, Ride-Share, Vans · flydenver.com ↑ b
- A Line facts and figures · rtd-denver.com ↑
- Fares | RTD-Denver · rtd-denver.com ↑
- Taxi | Denver International Airport · flydenver.com ↑
- Ride Share | Uber & Lyft | Denver International Airport · flydenver.com ↑
- Rental Cars at Denver Airport (DEN) · flydenver.com ↑
- Denver Municipal Airport System — Annual Comprehensive Financial Report for the years ended December 31, 2021 and 2020 · flydenver.com ↑ b
- Flying Sand May Have Caused Windshield Damage in Denver (The Denver Post, via AviationPros) · aviationpros.com ↑
- NTSB Aircraft Accident Report AAR-10/04: Runway Side Excursion During Attempted Takeoff in Strong and Gusty Crosswind Conditions, Continental Airlines Flight 1404, Denver, December 20, 2008 · ntsb.gov ↑
- Accident: ExpressJet E145 at Denver on Apr 3rd 2012, smoke in cockpit, hard short landing (The Aviation Herald) · avherald.com ↑
- NTSB Aviation Investigation Final Report DCA21FA085: United Airlines Flight 328 engine failure, Broomfield, Colorado (hosted copy) · flightradar24.com ↑
- Denver International Airport — Reports and Financials (Fly Denver) · flydenver.com
- International Destinations of Passengers from Raleigh-Durham International Airport · data.transportation.gov
- Incidents at Jackson–Medgar Wiley Evers International Airport — NTSB · ntsb.gov

