

 Popular Countries
 24/7 Support
Published Sep 9, 2026
Missoula Montana Airport (MSO) serves western Montana, and recorded more than 1 million total passengers in 2025. It operates as one of Montana’s small hub commercial service airports.
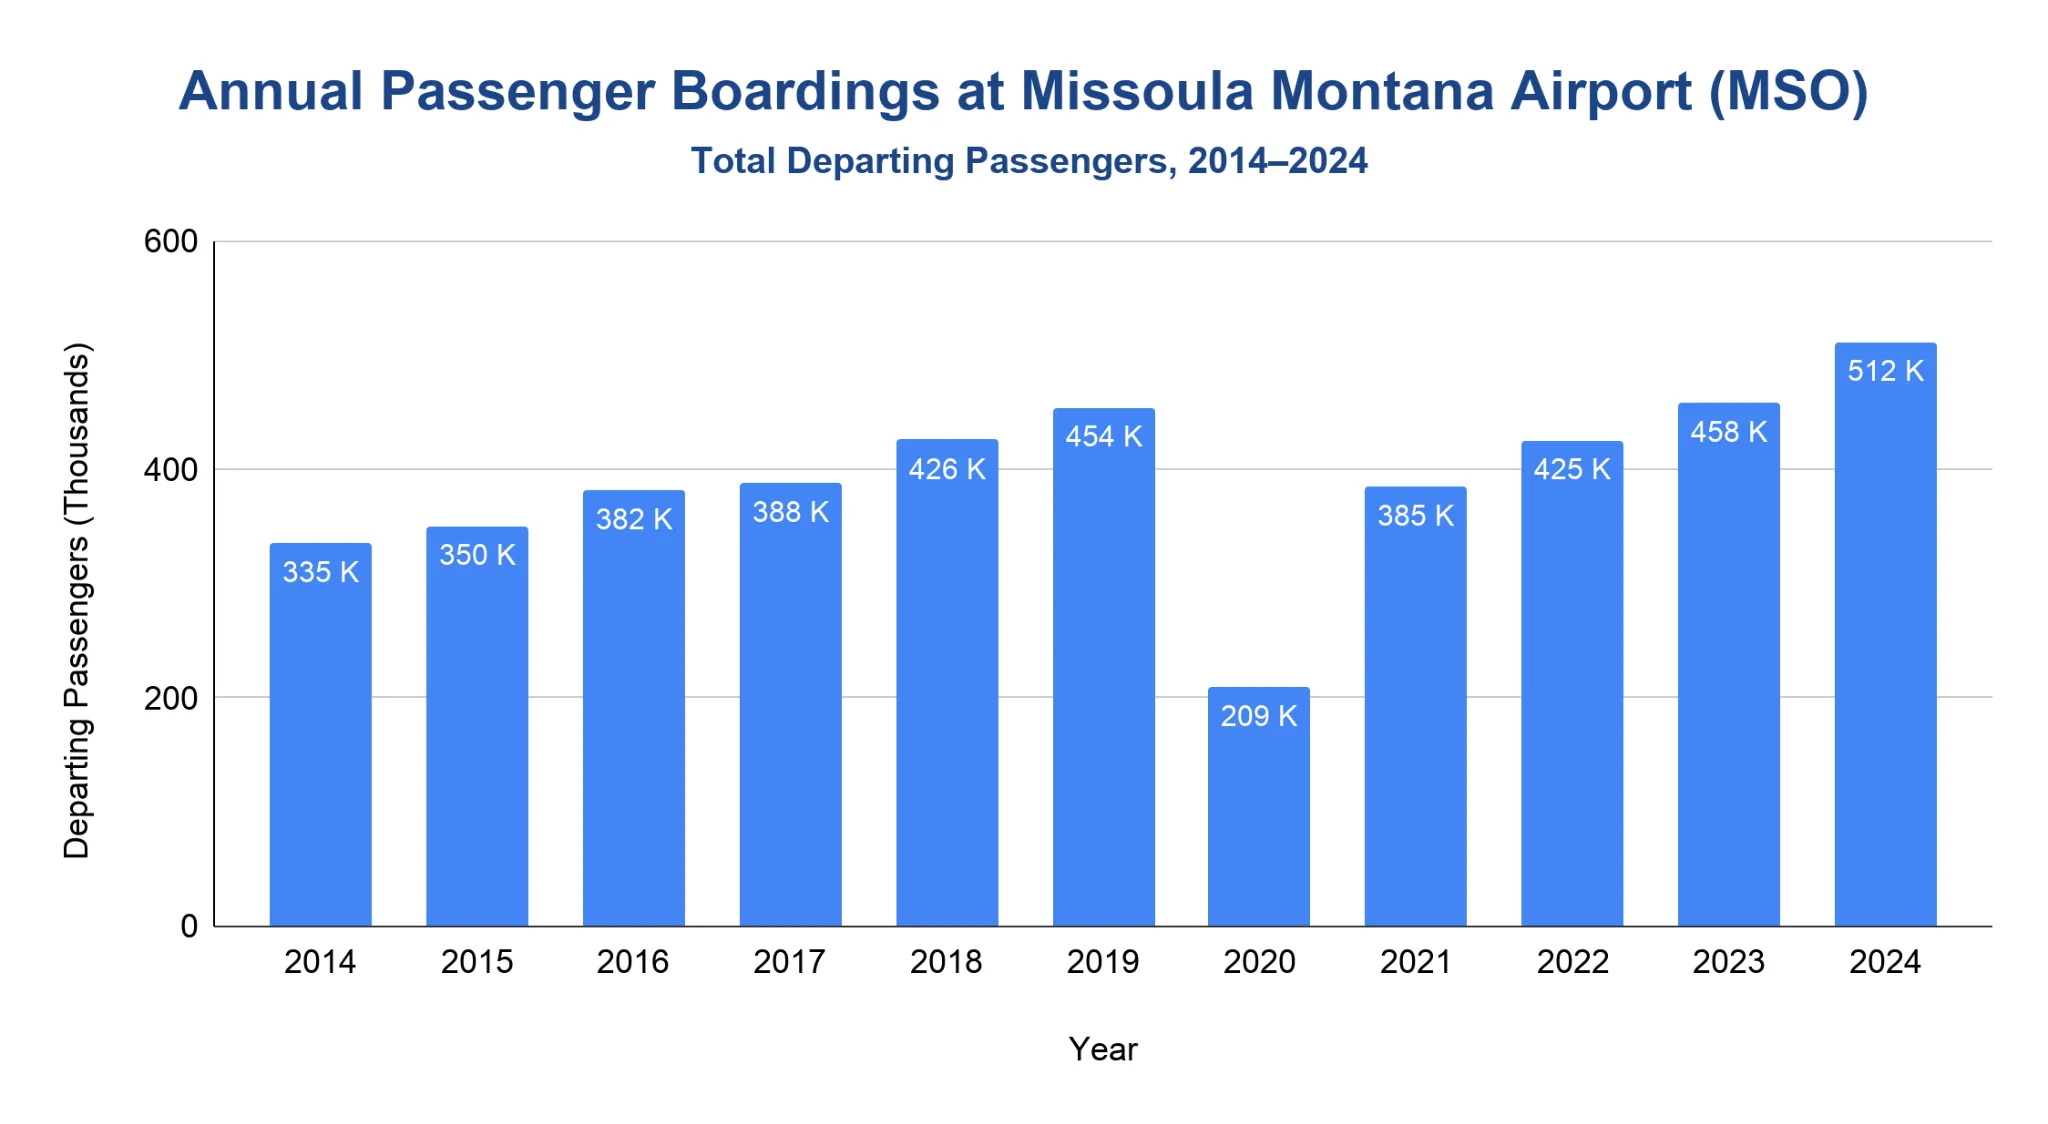
How many passengers boarded from Missoula Montana Airport each year?
MSO recorded 511,553 official passenger boardings in 2024.
- From 2014 through 2018, passenger boardings rose from 334,948 to 425,563, a 27.1% gain.
- The pre-pandemic peak came in 2019, when MSO reached 453,754 passenger boardings.
- The pandemic drop was severe, with boardings falling to 209,035 in 2020, down 53.9% from 2019.
- The recovery moved quickly after that, reaching 384,925 boardings in 2021 and 425,093 in 2022.
- MSO then surpassed its pre-pandemic level, rising to 458,429 boardings in 2023 and 511,553 in 2024.
Note: Passenger boardings count departing passengers only. The Federal Aviation Administration (FAA) annual series used here is available through 2024; the later monthly peak-travel section uses 2025 total passengers from The Bureau of Transportation Statistics (BTS) data.
Does Missoula Montana Airport handle domestic or international flights?
MSO’s published scheduled passenger network currently lists United States destinations only.
- The airport’s scheduled airline page lists year-round service to Portland, Seattle, Las Vegas, Phoenix/Mesa, Chicago/O’Hare, Dallas/Fort Worth, Salt Lake City, Minneapolis, and Denver.
- Seasonal scheduled service includes markets such as San Diego, Orange County, Los Angeles, Minneapolis, Chicago/O’Hare, and San Francisco.
- The airport authority adopted the “Missoula Montana Airport” branding in 2021 because the former “International” designation was not representative of current airport operations.
Note: This section describes published scheduled passenger routes.
How many aircraft operations occur at Missoula Montana Airport each year?
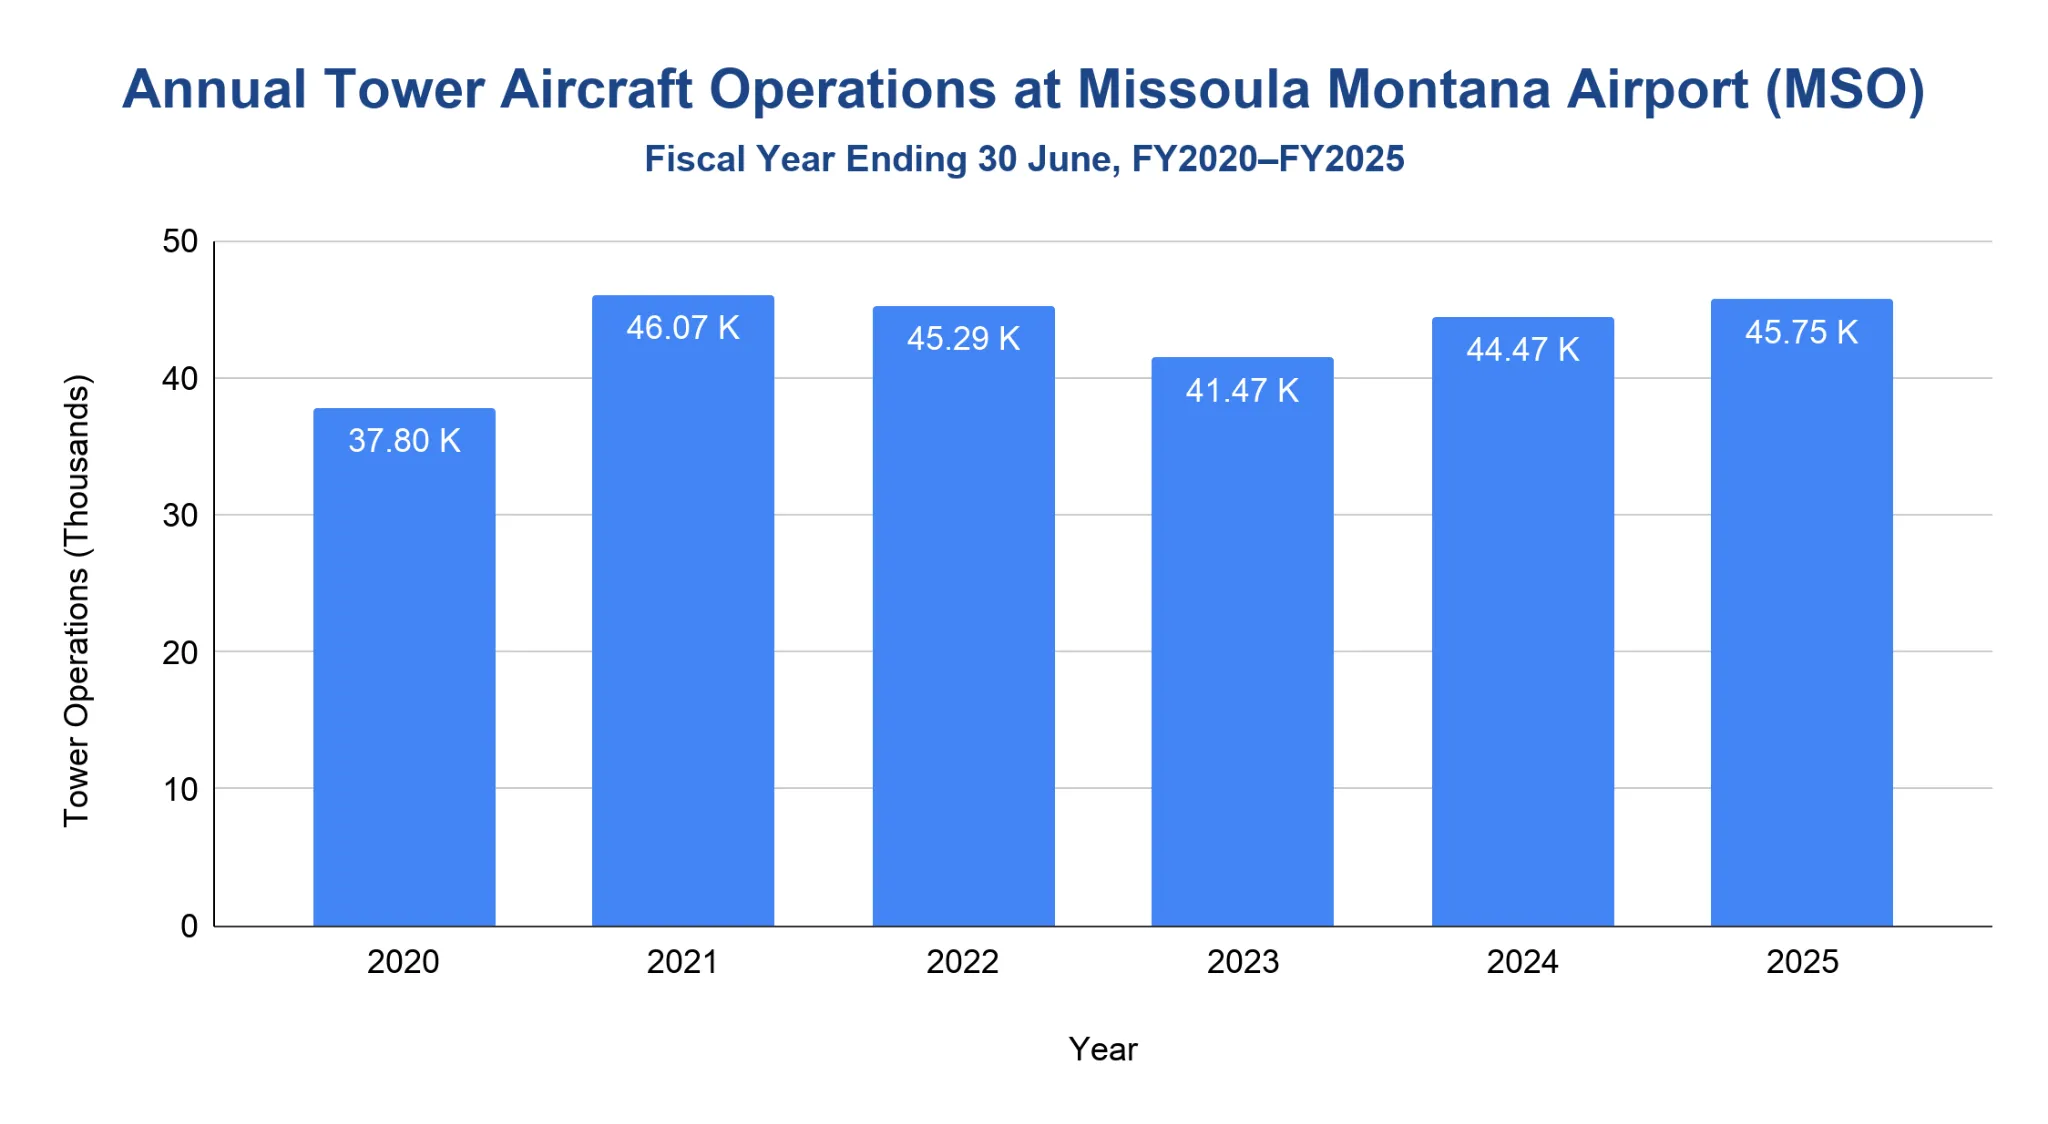
MSO recorded 45,746 tower aircraft operations in fiscal 2025.
- Total tower aircraft operations were 37,801 in fiscal 2020, then rose to 46,072 in fiscal 2021.
- Tower operations stayed elevated at 45,289 in fiscal 2022, before easing to 41,468 in fiscal 2023.
- MSO logged 44,465 tower operations in fiscal 2024 and 45,746 in fiscal 2025.
- Fiscal 2025 operations were up 2.9% from fiscal 2024.
- Compared with fiscal 2020, MSO handled 21% more tower aircraft operations by fiscal 2025.
Note: Tower aircraft operations count total operations handled by the airport tower.
Which airlines carry the most passengers at Missoula Montana Airport?
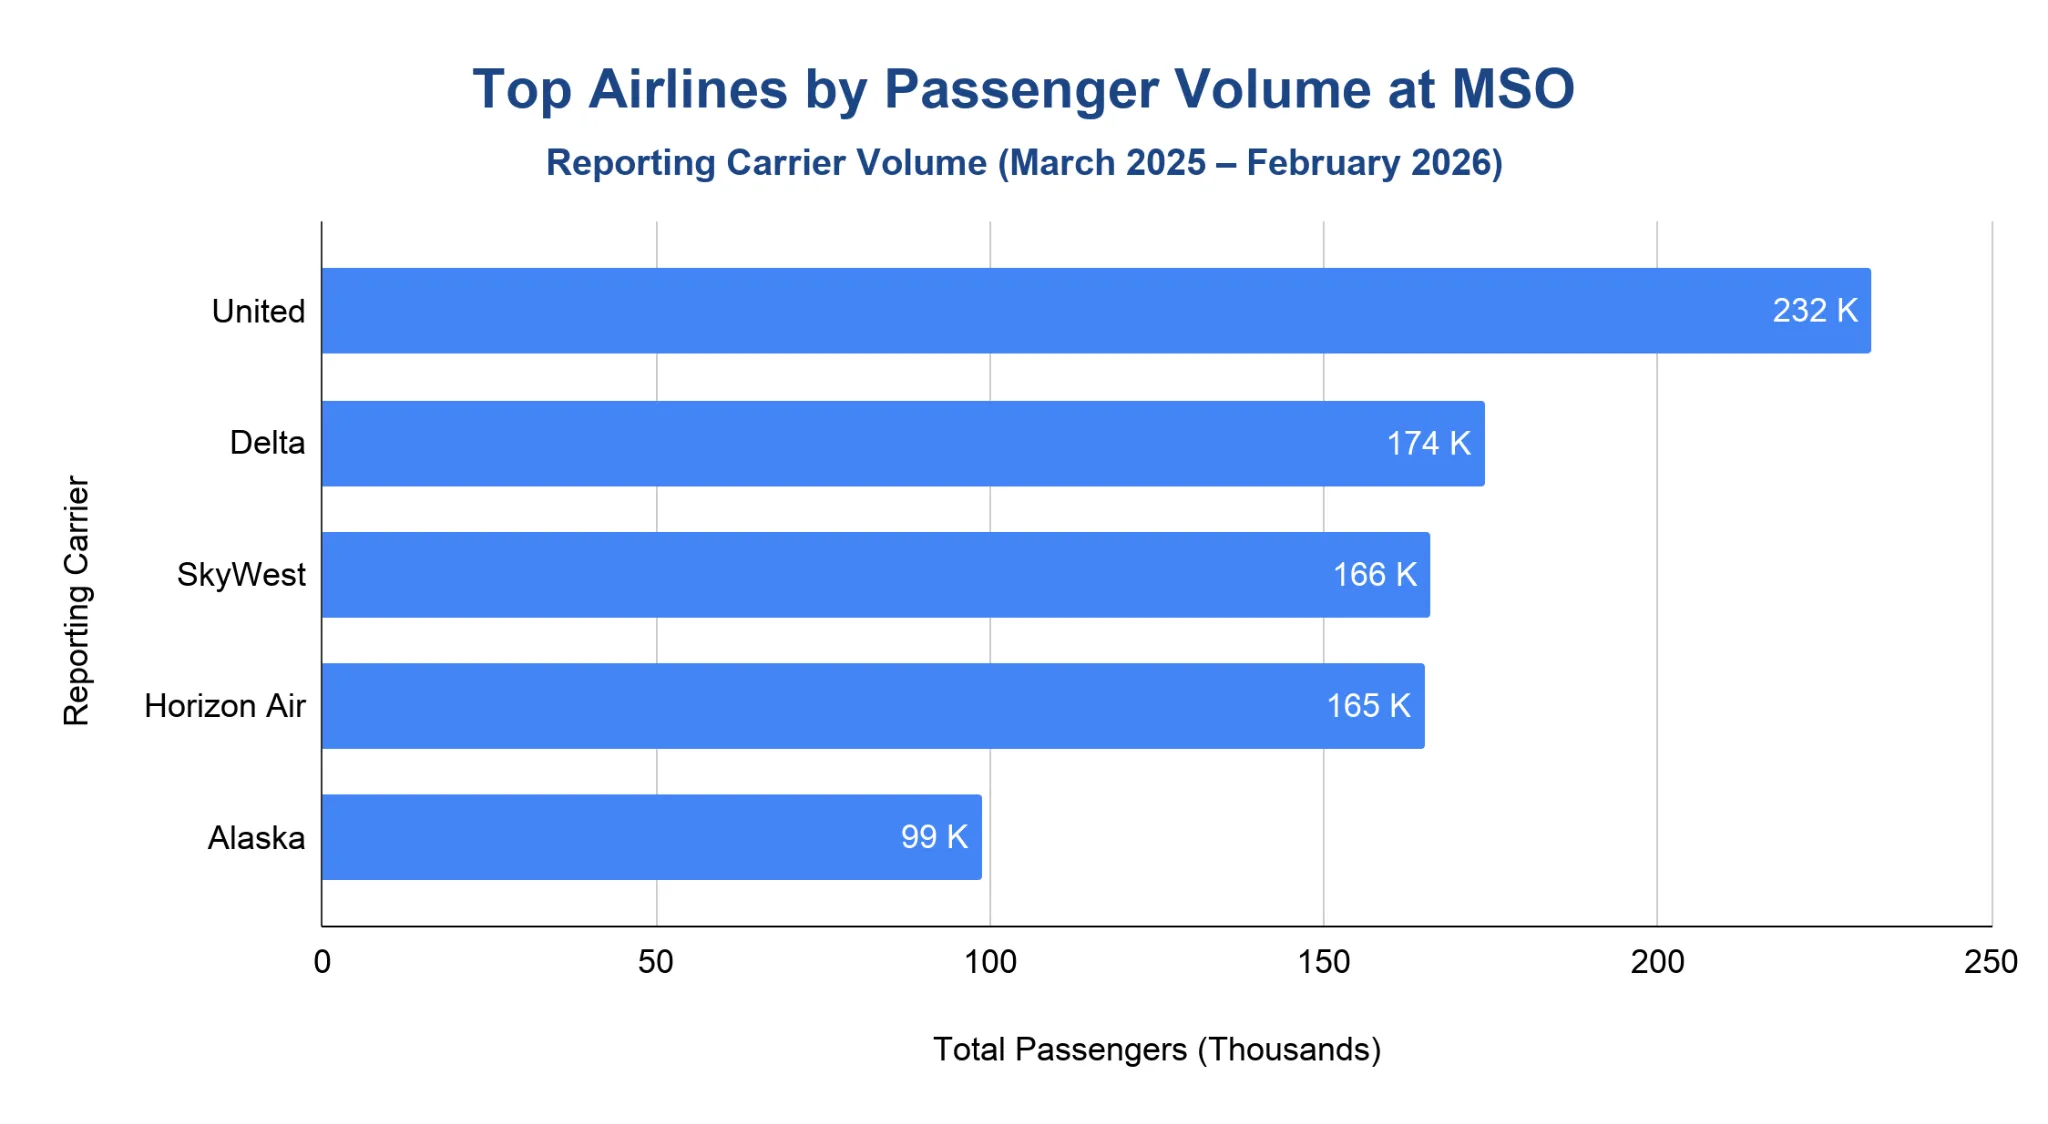
United was the largest Bureau of Transportation Statistics reporting carrier at MSO for March 2025 through February 2026, with about 232,000 passengers.
- Delta ranked second with about 174,000 passengers.
- SkyWest followed with about 166,000 passengers.
- Horizon Air (operating for Alaska Airlines) was close behind at about 165,000 passengers.
- Alaska accounted for about 98,690 passengers.
- Other reporting carriers together carried about 216,000 passengers.
Note: Carrier figures are reported by operating or reporting carrier, so some regional flights may appear under carriers such as SkyWest or Horizon Air rather than only under the ticketing airline.
What are the most popular destinations from Missoula Montana Airport?
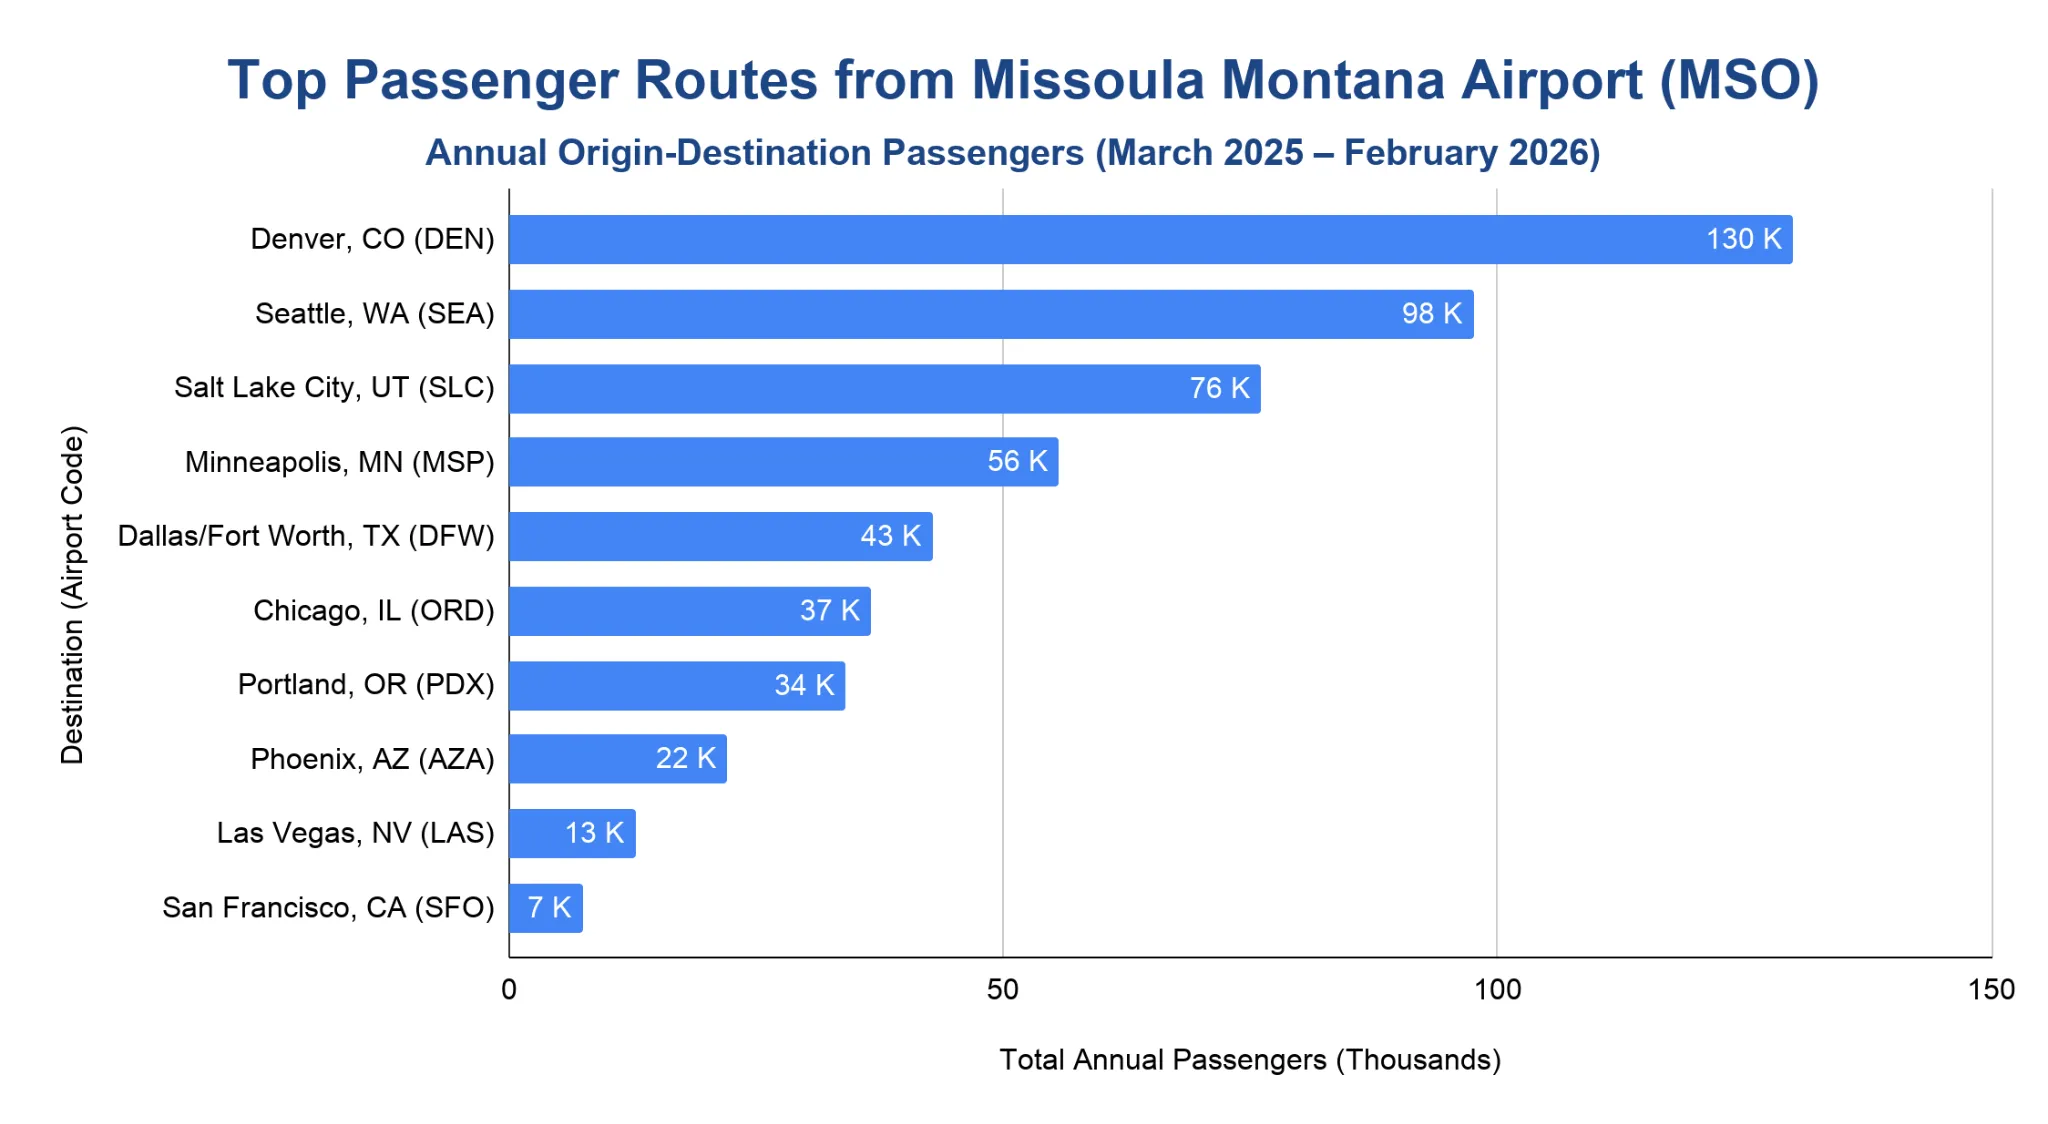
Denver International Airport was MSO’s busiest listed domestic destination for March 2025 through February 2026, with 129,910 passengers.
- Seattle/Tacoma International Airport ranked second with 97,630 passengers.
- Salt Lake City International Airport followed with 76,100 passengers.
- Minneapolis-St Paul International Airport handled 55,660 passengers.
- Dallas/Fort Worth International Airport rounded out the top five with 42,850 passengers.
- Chicago O’Hare International Airport and Portland International Airport were the next largest listed markets, with 36,640 and 34,100 passengers, respectively.
Note: Destination figures are U.S.-only passengers in thousands from the BTS T-100 Domestic Market series.
Peak Travel Months at Missoula Montana Airport
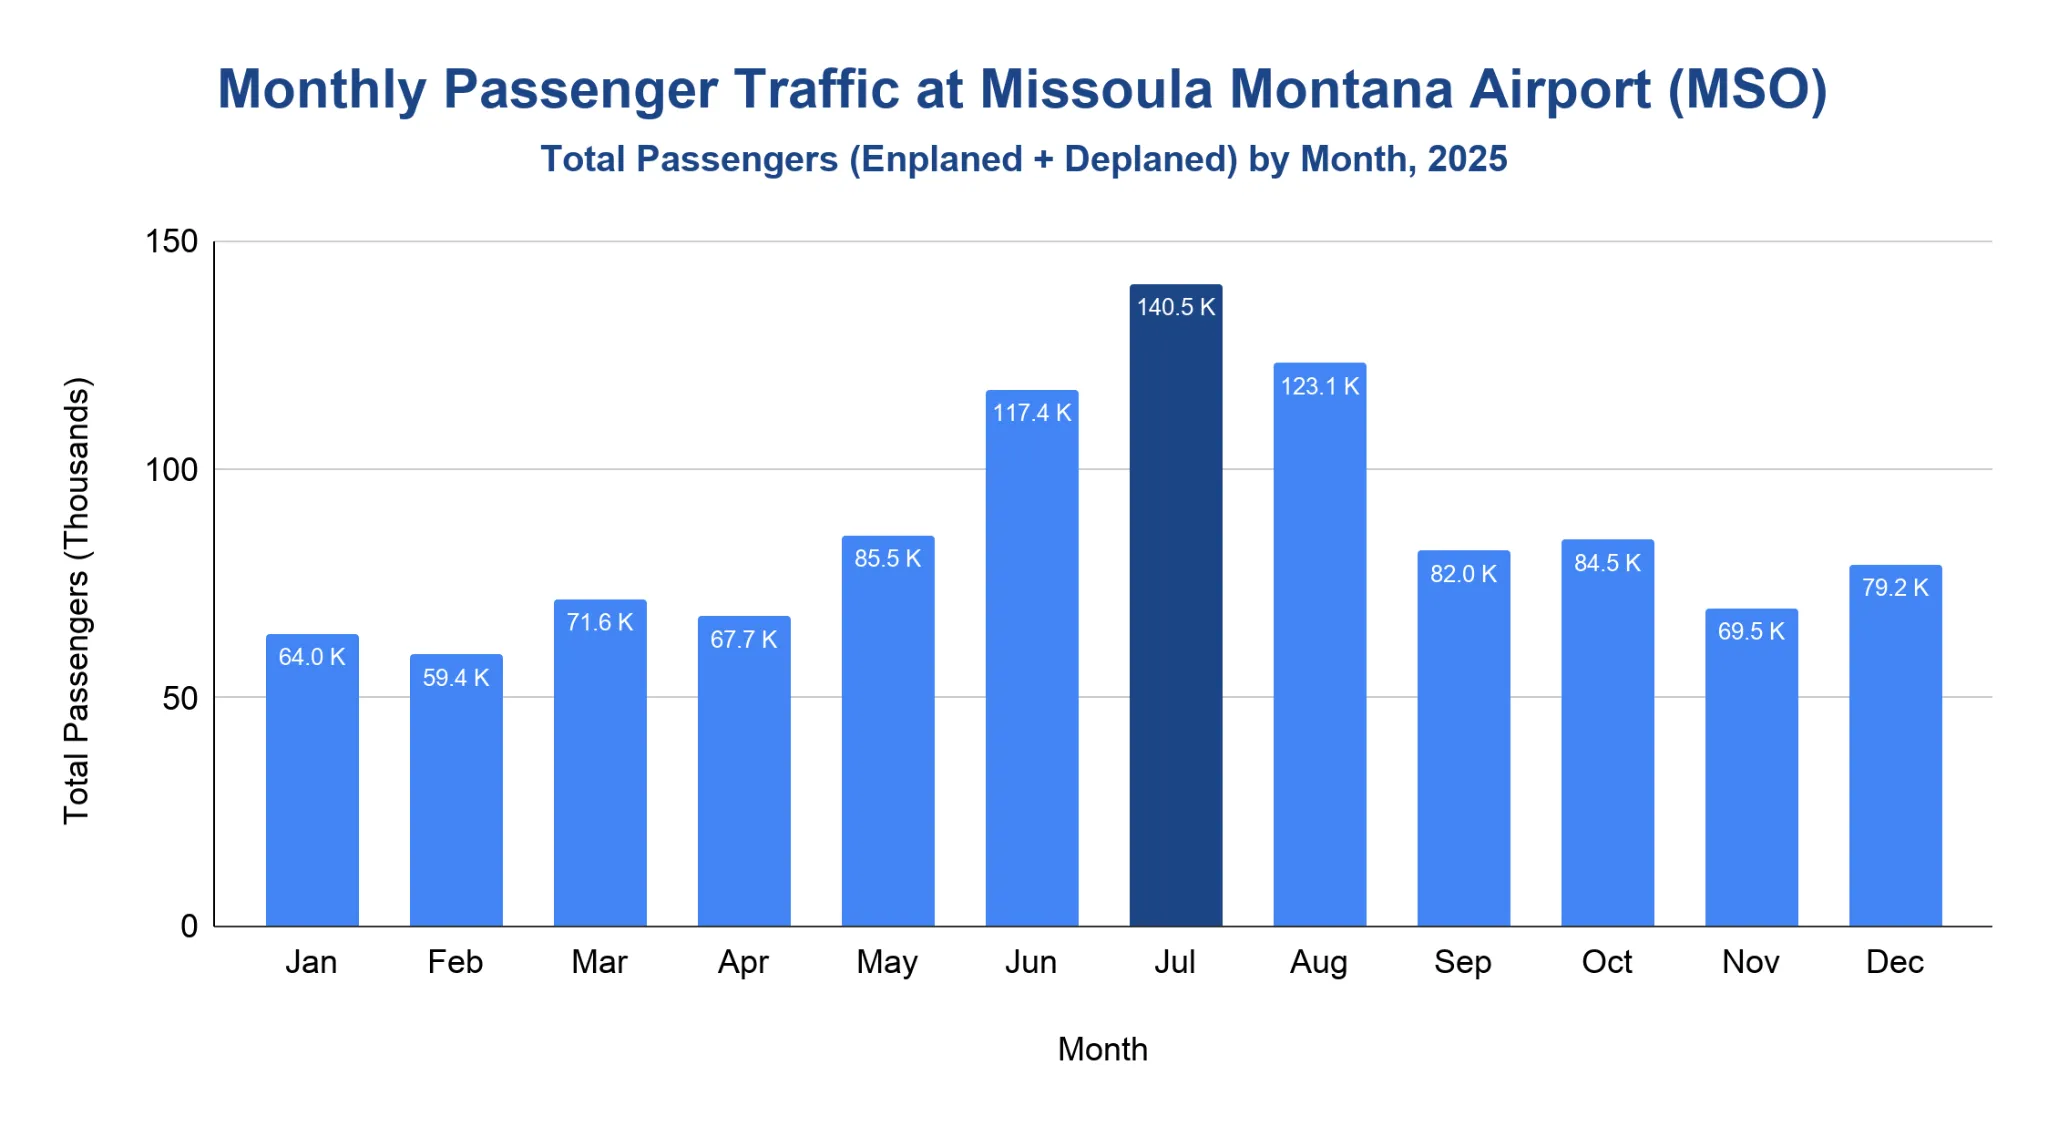
July was MSO’s busiest month in 2025, with 140,543 total passengers.
- Summer drove the peak season, with June, July, and August combining for 381,107 total passengers.
- July led the year with 70,790 enplanements and 69,753 deplanements.
- August ranked second with 123,149 total passengers.
- June followed with 117,415 total passengers as summer travel built up.
- February was the slowest month, with 59,392 total passengers.
Note: Enplanements are departing passengers, while deplanements are arriving passengers. Total passengers are calculated by adding the two monthly figures.
How much revenue does Missoula Montana Airport generate each year?
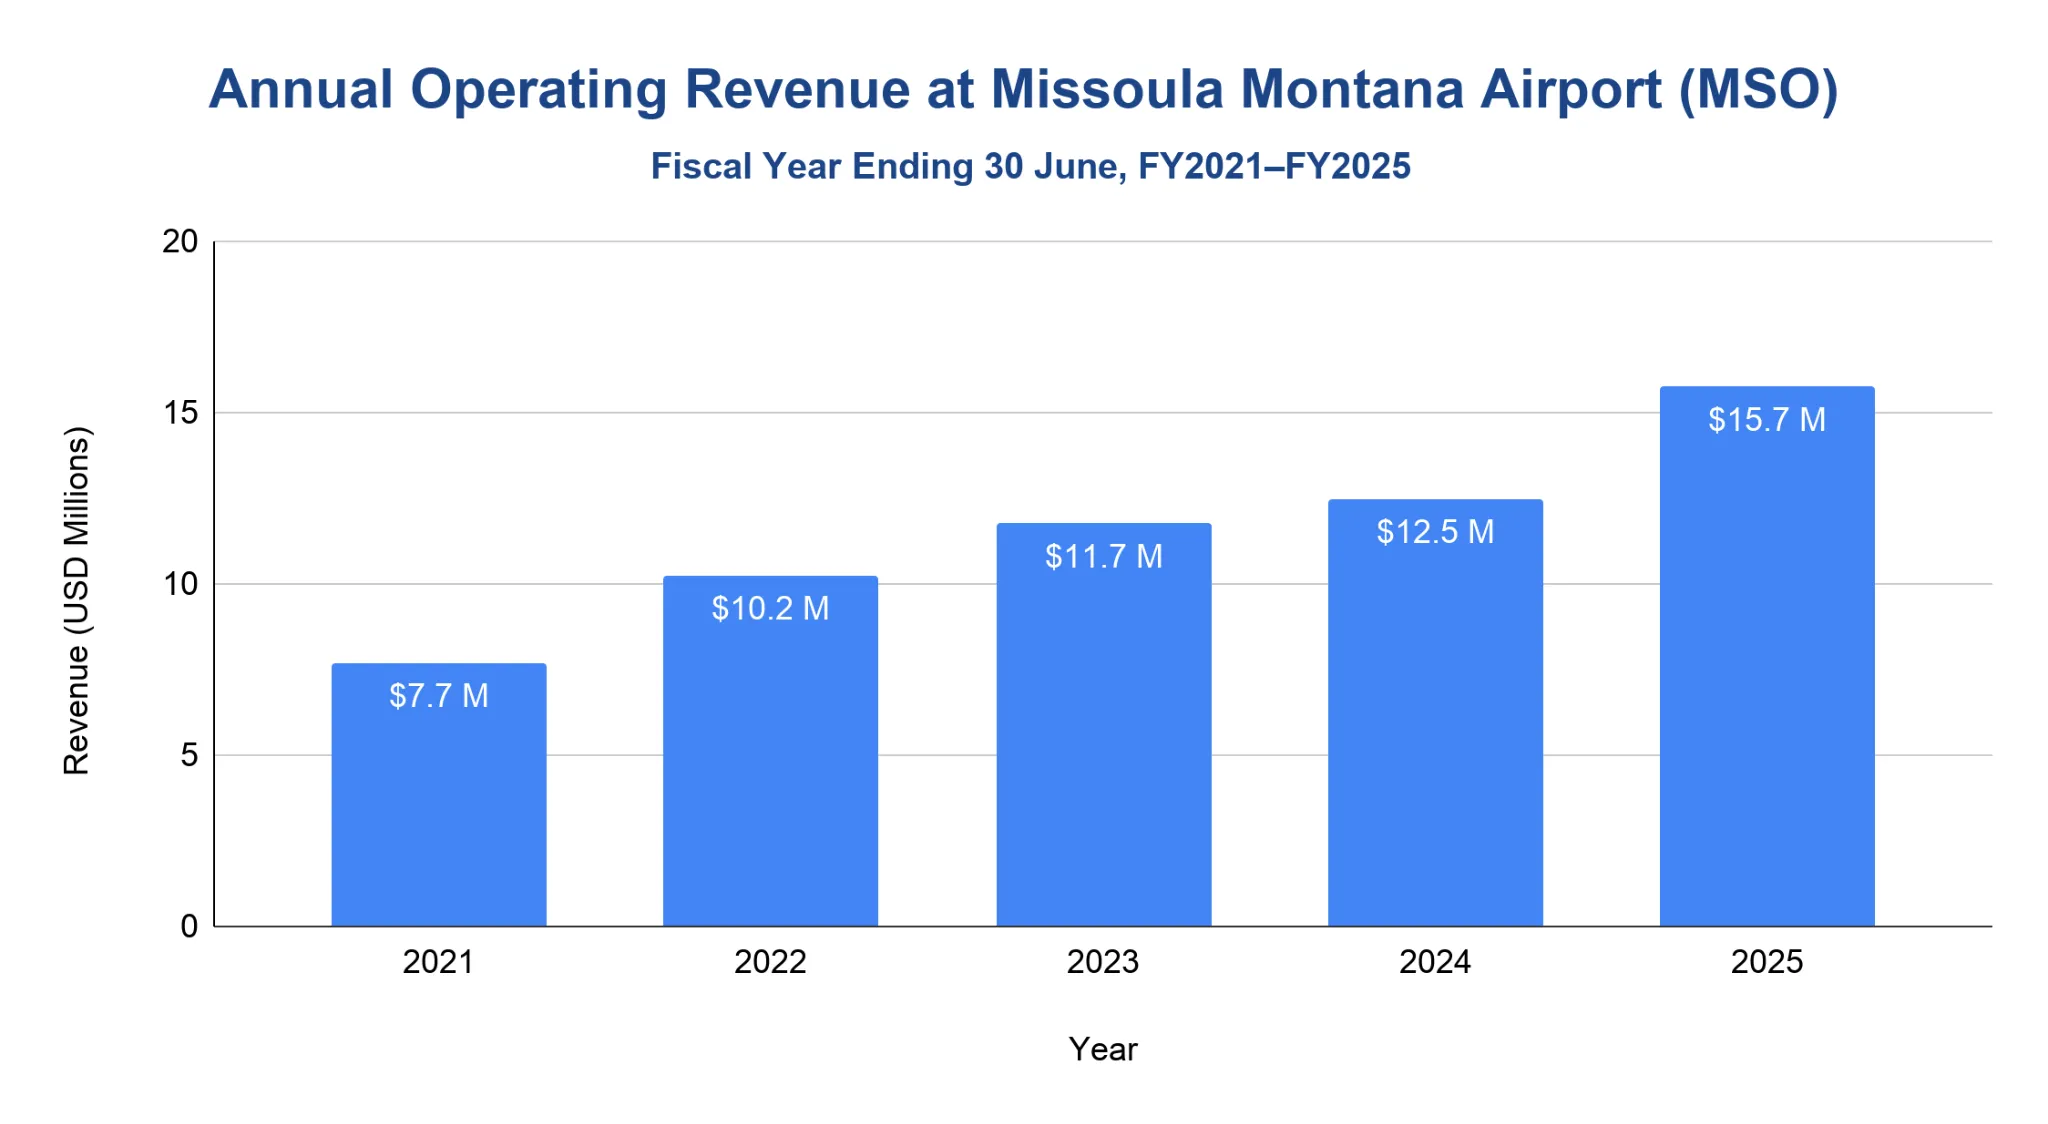
MSO generated $15.73 million in operating revenue in fiscal 2025.
- Operating revenue was $7.69 million in fiscal 2021, then climbed to $10.24 million in fiscal 2022.
- Revenue continued rising to $11.75 million in fiscal 2023 and $12.46 million in fiscal 2024.
- Fiscal 2025 marked the strongest year in the available official series, with operating revenue up 26.3% from fiscal 2024.
- Compared with fiscal 2021, operating revenue more than doubled by fiscal 2025.
Note: Fiscal years end on June 30.
What is Missoula Montana Airport's on-time performance?
For March 2025 through February 2026, 82% of MSO departures and 80% of arrivals were on time.
- Departure on-time performance stayed in a narrow 81% to 83% range from 2021 through the rolling 2026 period.
- Arrival on-time performance held at 83% in 2021, slipped to 82% in 2022 and 2023, then stood at 80% in 2024, 2025, and the rolling 2026 period.
- Cancellations peaked at 1.51% in 2022, then dropped to 0.57% in 2023.
- The cancellation rate was 0.68% in the rolling 2026 period, lower than every full year shown except 2023.
- MSO had 3,946 reportable domestic flights in the rolling 2026 period, compared with 4,490 in 2025.
| Metric | 2021 | 2022 | 2023 | 2024 | 2025 | 2026* |
|---|---|---|---|---|---|---|
| On-time departures | 83% | 82% | 82% | 81% | 82% | 82% |
| On-time arrivals | 83% | 82% | 82% | 80% | 80% | 80% |
| Avg. departure delay (min.) | 91.92 | 86.84 | 95.21 | 87.20 | 92.09 | 88.54 |
| Avg. arrival delay (min.) | 61.04 | 61.73 | 71.00 | 66.06 | 64.82 | 64.99 |
| Cancellation rate | 1.23% | 1.51% | 0.57% | 1.18% | 0.71% | 0.68% |
| Flights | 6,034 | 4,772 | 3,830 | 4,170 | 4,490 | 3,946 |
| Reporting carriers | 9 | 8 | 6 | 8 | 8 | 6 |
Source · BTS defines a delayed flight as one arriving or departing 15 or more minutes after schedule. The 2026 period covers March 2025 through February 2026. BTS publishes average delays in decimal-minute format. As such, the values have been kept exactly as reported to avoid altering the underlying data.
Major Expansion Projects at Missoula Montana Airport
MSO’s East Concourse project was budgeted at approximately $59 million and designed to add 4 boarding gates.
- Phase 1, the South Concourse, opened in June 2022 as the official opening of the airport’s new facility.
- Phase 1 added a new and expanded ticketing, screening, and boarding experience.
- Phase 2/3 was planned to expand baggage claim, rental car counters, concessions, and passenger gates.
- The East Concourse project includes 4 additional boarding gates, a permanent baggage claim area, and space for rental car operations.
- As of June 30, 2025, about $6.4 million remained on the East Concourse budget.
Related Travel Statistics
- Meadows Field Airport (BFL) Statistics
- Daytona Beach International Airport Statistics
- El Paso International Airport (ELP) Statistics
- Flagstaff Pulliam Airport Statistics
- Flint Bishop International Airport Statistics
- Monterey Regional Airport (MRY) Statistics
- Norfolk International Airport (ORF) Statistics
- Eppley Airfield (OMA) Statistics
- Pensacola International Airport Statistics
- Reno-Tahoe International Airport Statistics
- Roanoke-Blacksburg Regional Airport Statistics
- San Antonio International Airport Statistics
Missoula Montana Airport Safety Record
The two verified National Transportation Safety Board cases supported here involve general aviation aircraft, not scheduled airline service.
- On 5 December 2016, a Piper PA-31T made an emergency landing at MSO after a left windshield fracture and separation; the 2 people aboard were not injured.
- On 1 July 2021, a Cessna 172R was involved in a fatal accident near MSO; the pilot and passenger were fatally injured.
How does Missoula Montana Airport rank nationally?
The Federal Aviation Administration ranked MSO 138th among United States commercial service airports in 2024, with 511,553 passenger boardings.
- MSO was classified as a small hub airport in the 2024 Federal Aviation Administration ranking.
- Among Montana commercial service airports, MSO ranked 2nd by 2024 passenger boardings.
- Bozeman Yellowstone International Airport led Montana with 1.32 million passenger boardings, while MSO’s 511,553 placed it just ahead of Glacier Park International Airport’s 503,816.
Note: FAA passenger boardings count departing passengers only, so this ranking should not be described as a total-passenger ranking.
References
- FAA Passenger Boarding and All-Cargo Data Master · faa.gov
- BTS Airline, Destination, Monthly Passenger, and On-Time Data (2021–2026) · transtats.bts.gov
- Missoula Montana Airport Audits and Financial Data (FY2020–FY2026) · flymissoula.com
- NTSB Aviation Accident Reports (2016–2021) · ntsb.gov

