

 Popular Countries
 24/7 Support
Published Sep 9, 2026
Reno-Tahoe International Airport (RNO) is Nevada’s second-busiest airport and the primary gateway for the Reno-Sparks metro area and the Lake Tahoe region. It connects Northern Nevada to destinations across the U.S. and a few international locations through multiple airline partners.
How many passengers pass through Reno-Tahoe International Airport each year?
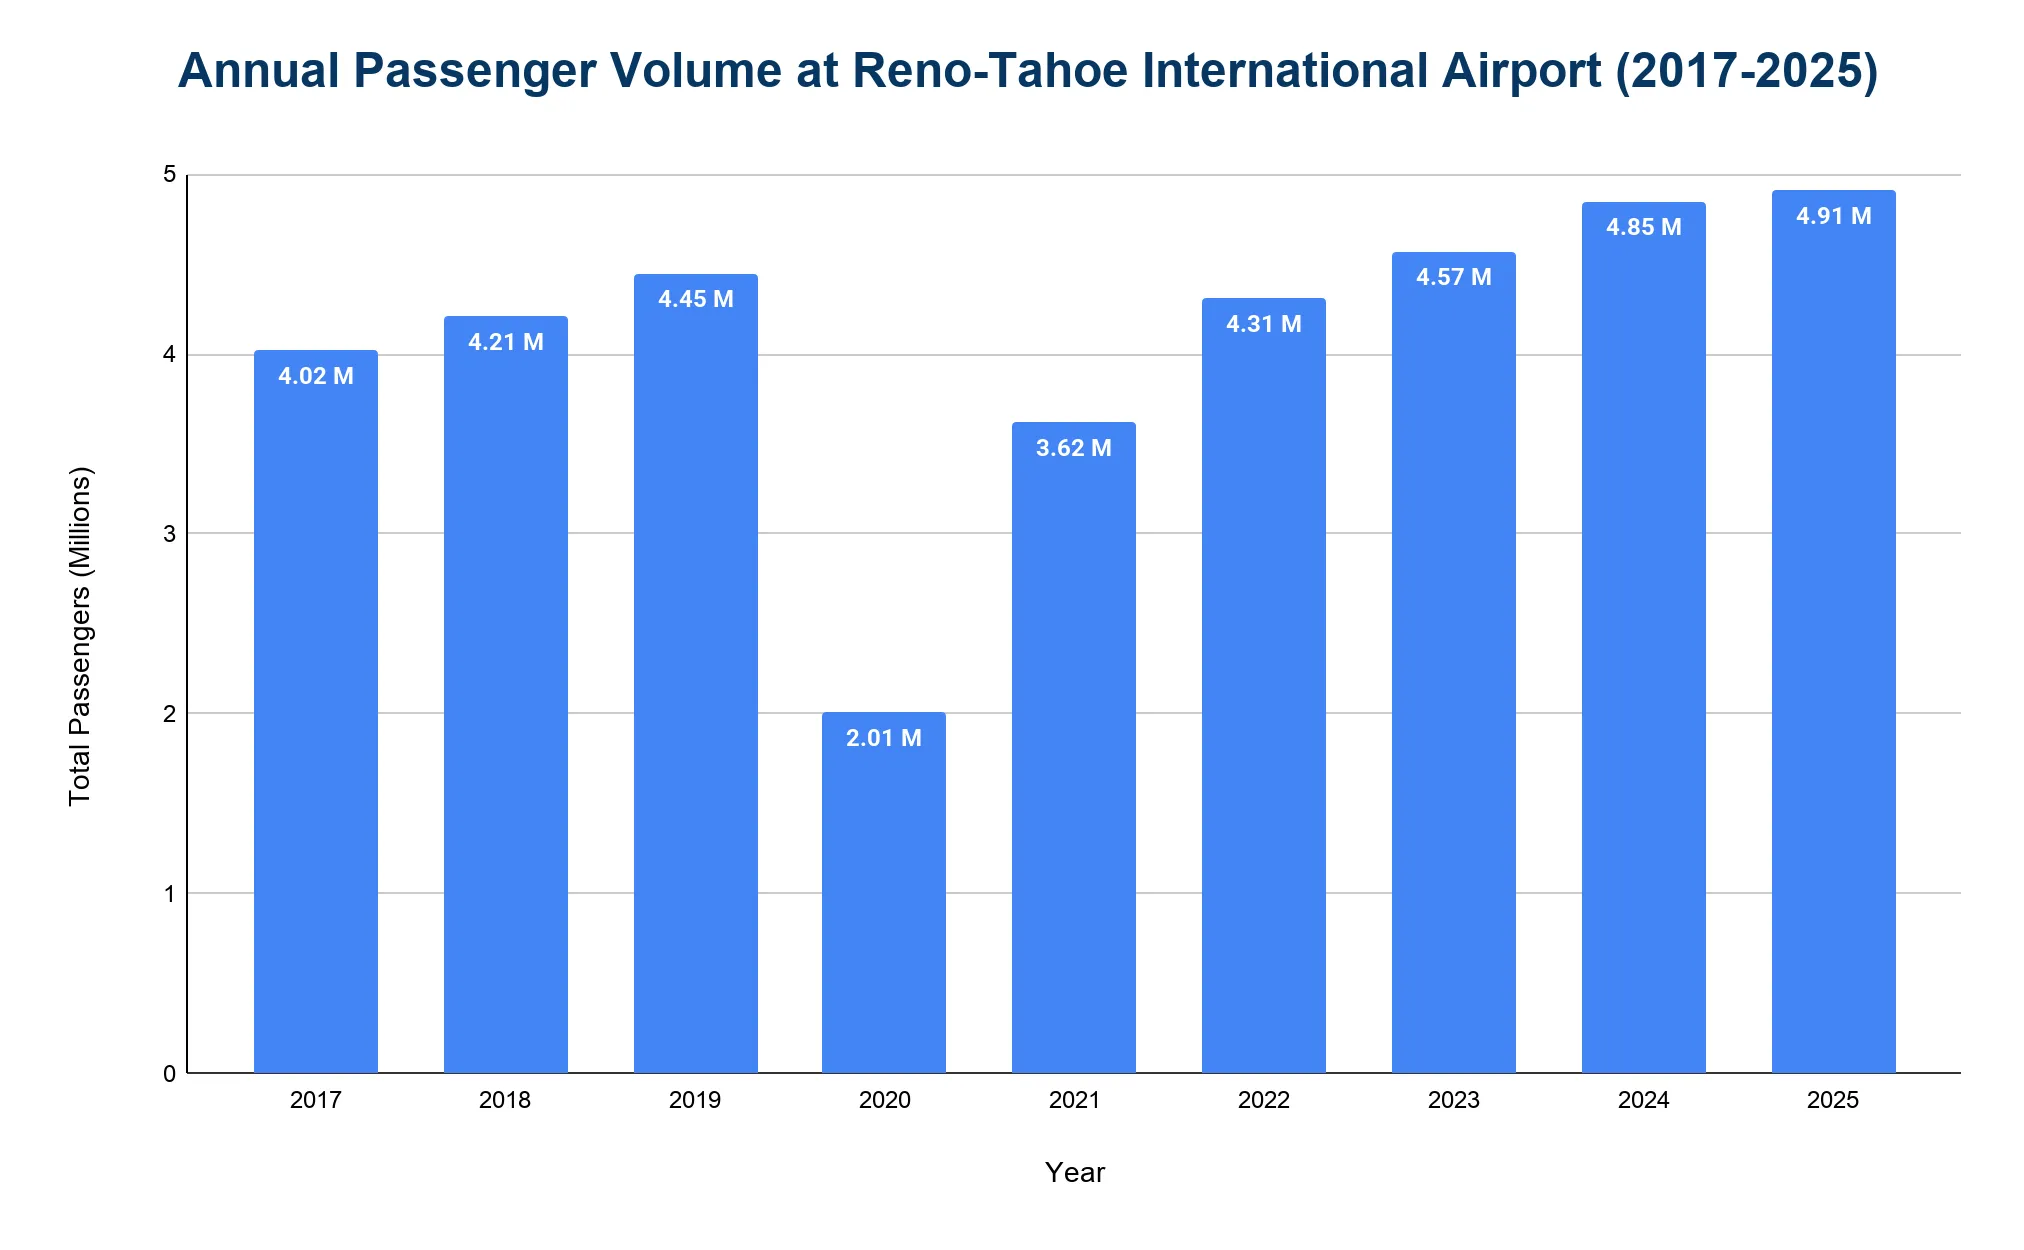
Reno-Tahoe International Airport handles approximately 4 to 5 million passengers annually.
- The airport served 4.91 million passengers in 2025, a 1.2% increase over 4.85 million in 2024.
- In 2019, before the pandemic, the airport saw 4.45 million passengers.
- Passenger volume dropped to 2.01 million in 2020, a 54.9% decline.
- Traffic rebounded to 3.62 million in 2021, then rose to 4.31 million in 2022 and 4.57 million in 2023.
What is the total number of aircraft operations at Reno-Tahoe International Airport each year?
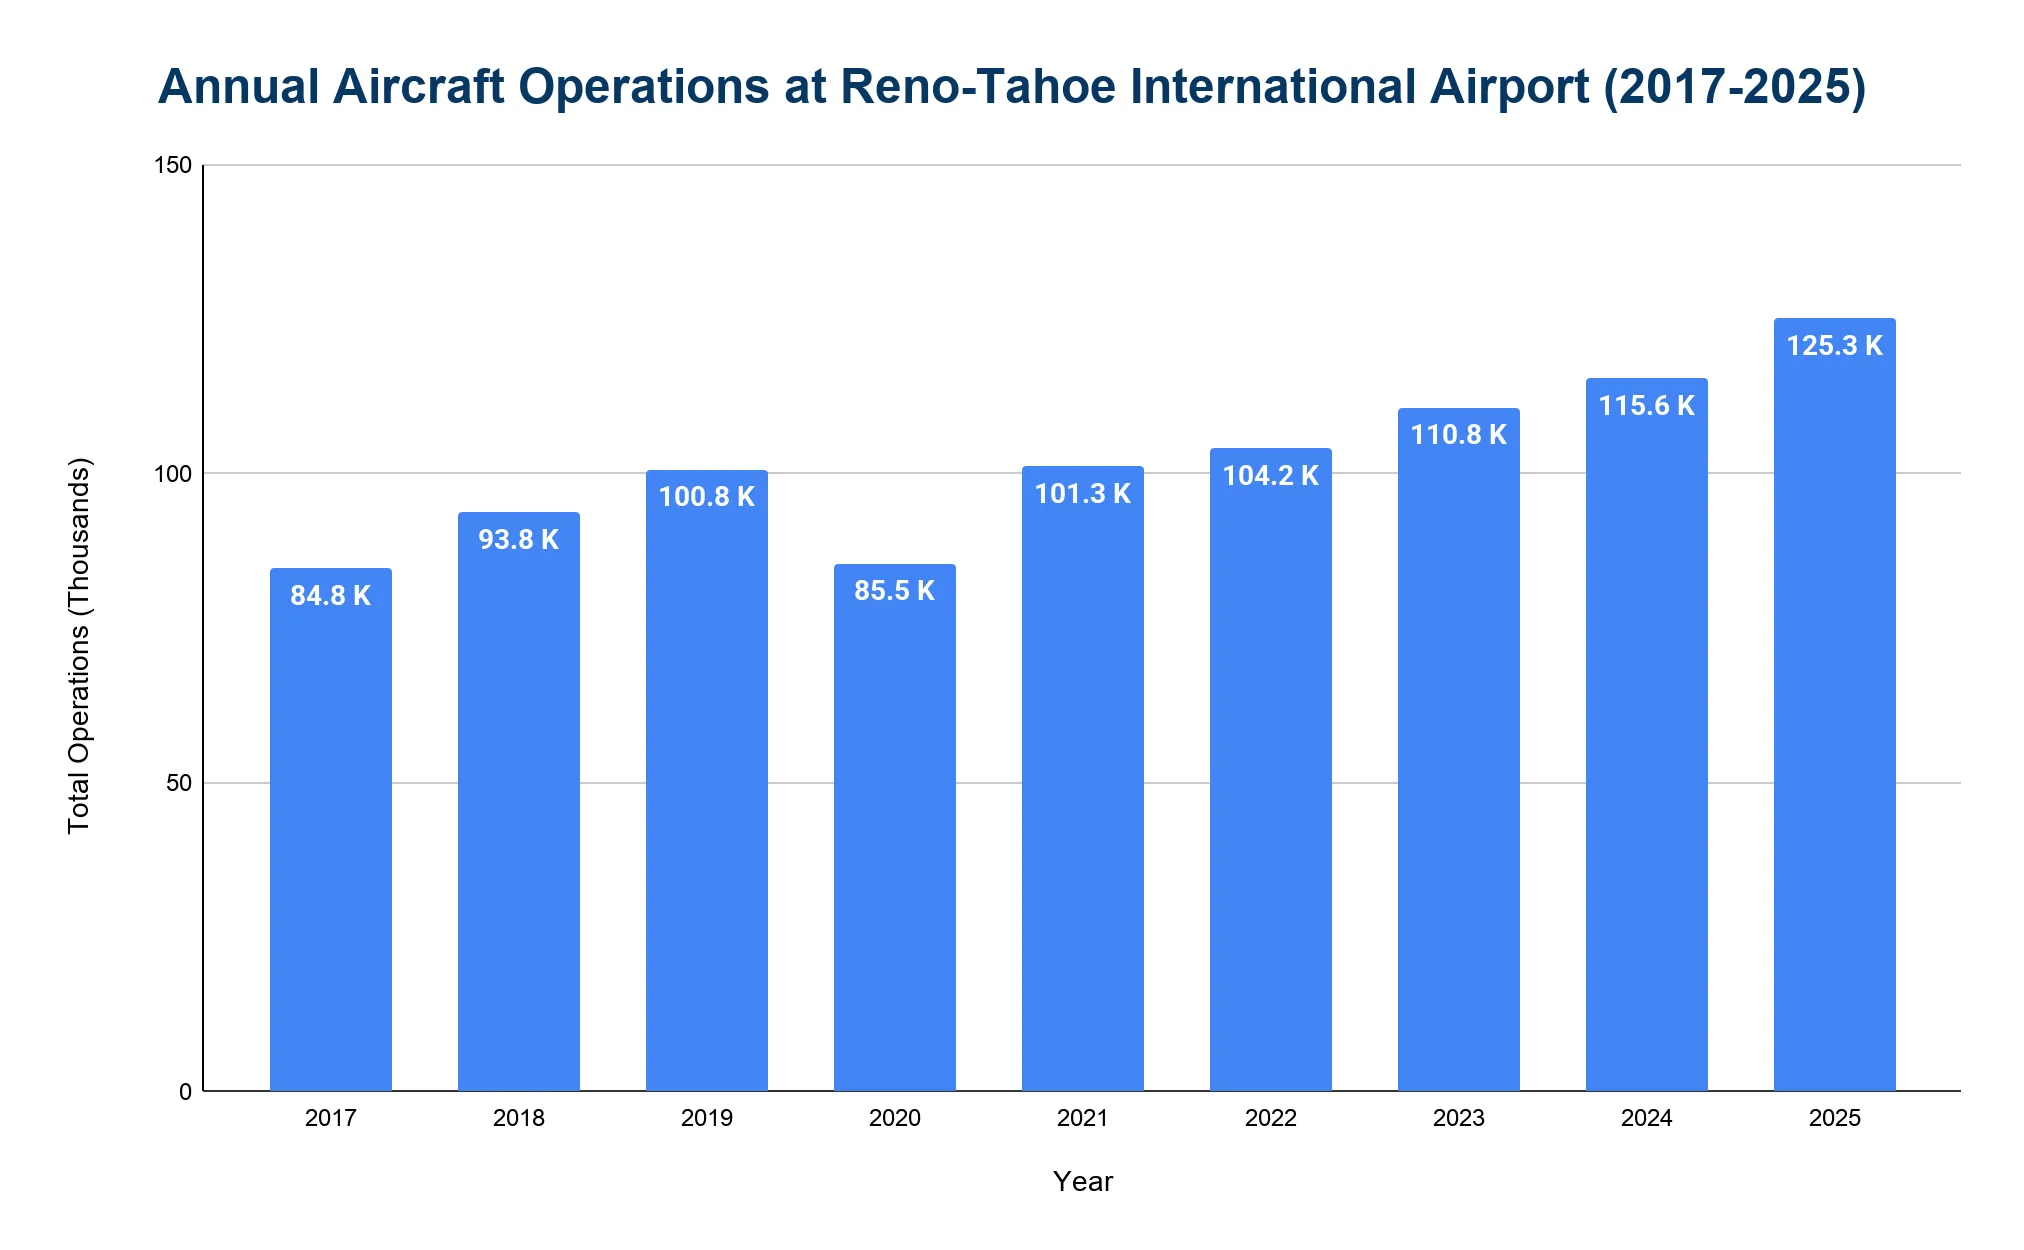
The airport records over 100,000 aircraft movements per year, including commercial, general aviation and military operations.
- In 2025, total aircraft movements reached 125,300, representing an 8.4% increase from 115,614 movements in 2024.
- The airport reported 100,755 operations in 2019.
- Activity dropped to 85,542 in 2020, the lowest point during the pandemic.
- Operations recovered to 101,289 in 2021, then 104,192 in 2022 and 110,774 in 2023.
Which airlines operate the most flights out of Reno-Tahoe International Airport?
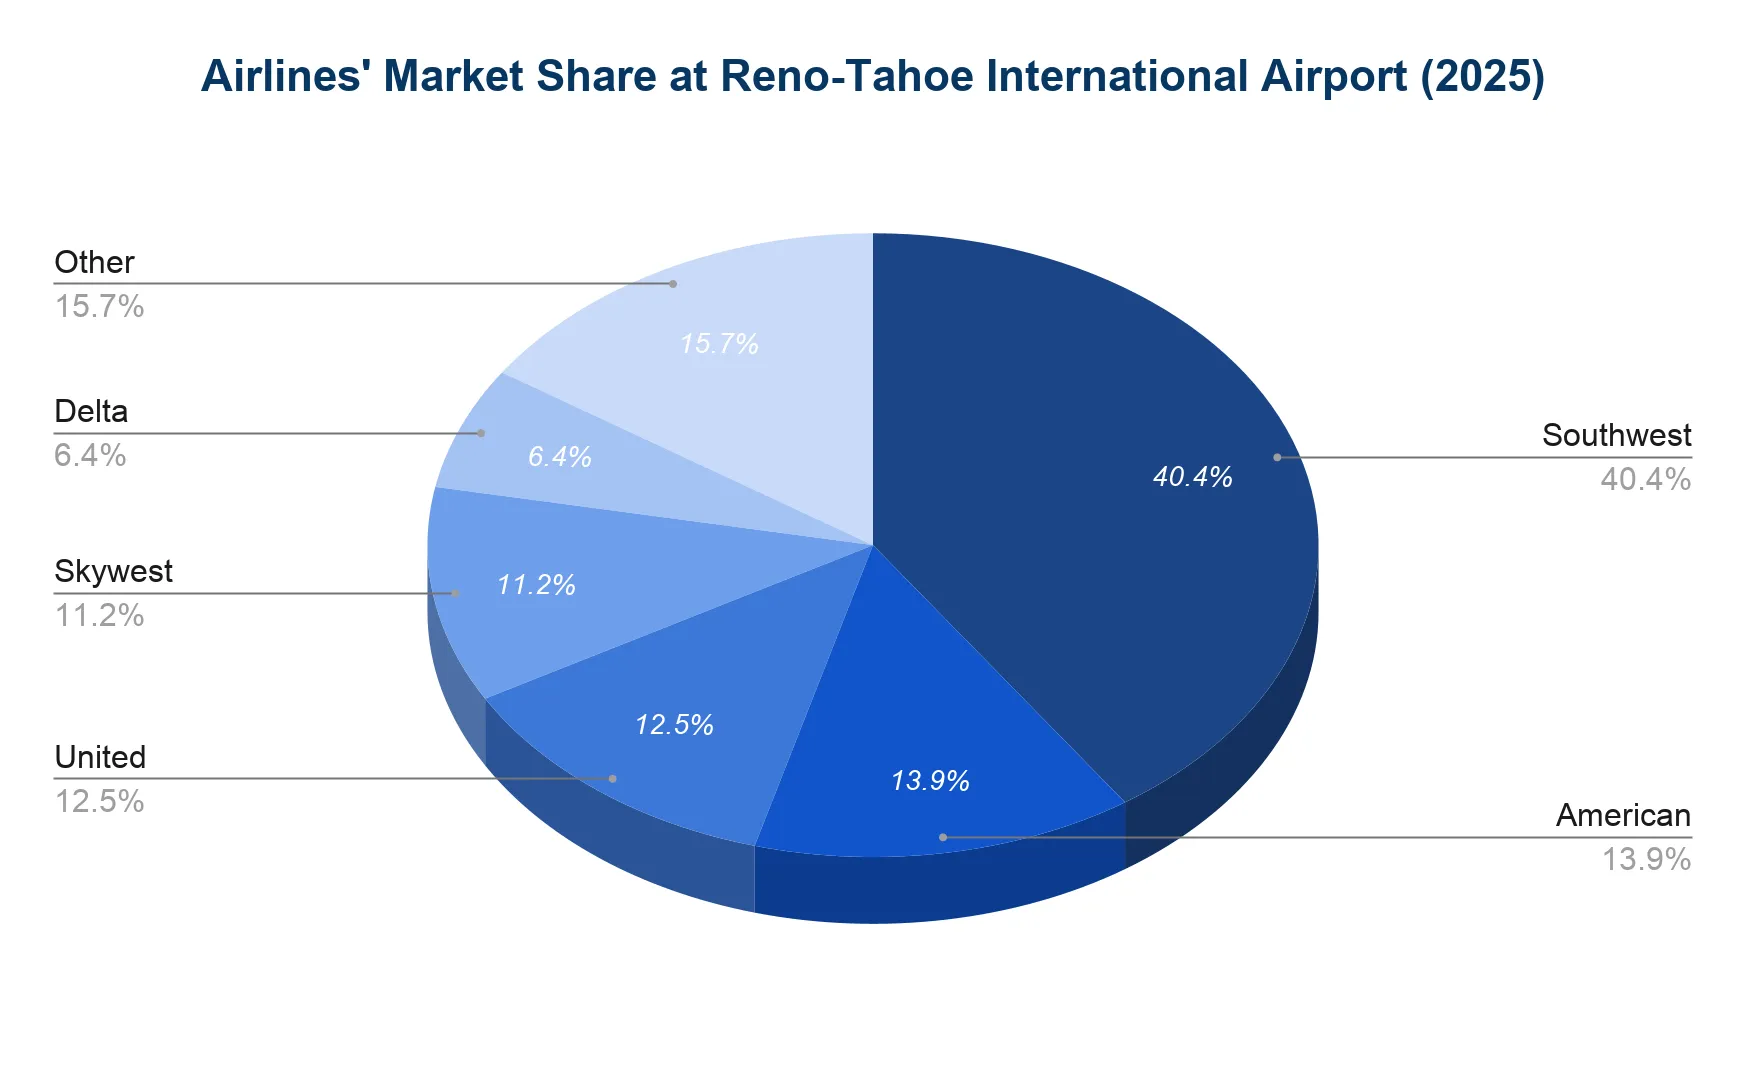
Both low-cost and major carriers serve RNO, with Southwest Airlines leading in passenger volume.
- In 2025, Southwest Airlines carried 40.4% of RNO’s passengers.
- American Airlines accounted for 13.9%, making it the second-largest carrier.
- United Airlines held 12.5%, maintaining a notable share.
- Skywest made up 11.2% and Delta Airlines represented 6.4%.
What are the monthly trends in passenger traffic at Reno-Tahoe International Airport?
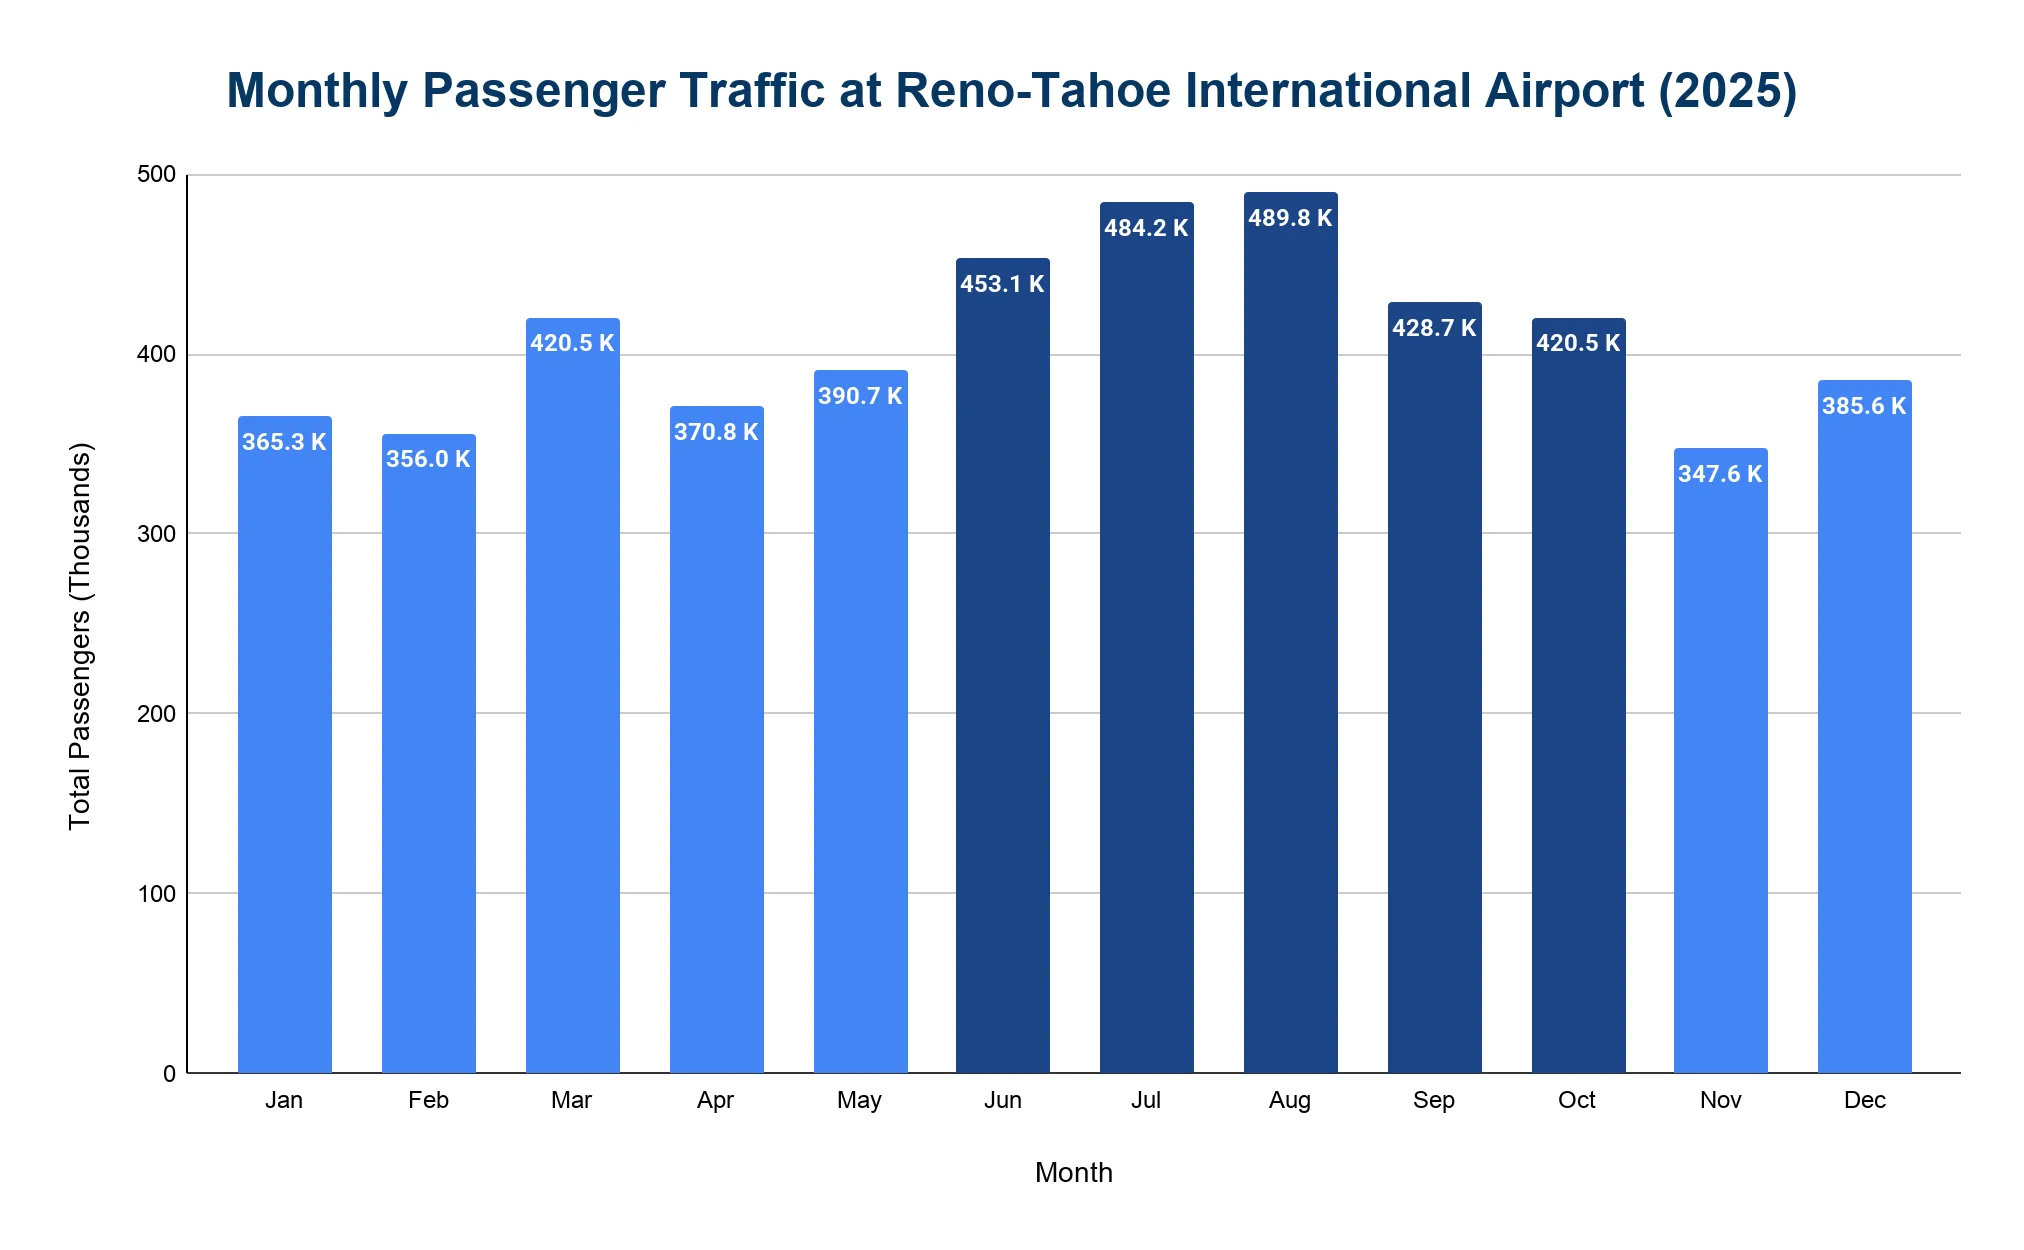
Passenger numbers at RNO reflect strong seasonal demand, peaking during summer and holiday travel periods.
- August 2025 was the busiest month with 489,751 passengers, followed closely by July with 484,244.
- June recorded 453,113 passengers.
- September saw 428,712 passengers and October had 420,541.
- November was the slowest month with 347,609, followed by February with 356,037.
How many routes are there at Reno-Tahoe International Airport?
RNO offers over 20 nonstop domestic routes with limited international service.
- International flights include seasonal service to Guadalajara, Mexico (Volaris) and occasional charter flights.
- Key U.S. destinations include Las Vegas, Denver, Phoenix, Los Angeles, Dallas/Fort Worth and other major West Coast and hub cities.
Which destinations are the most popular from Reno-Tahoe International Airport?
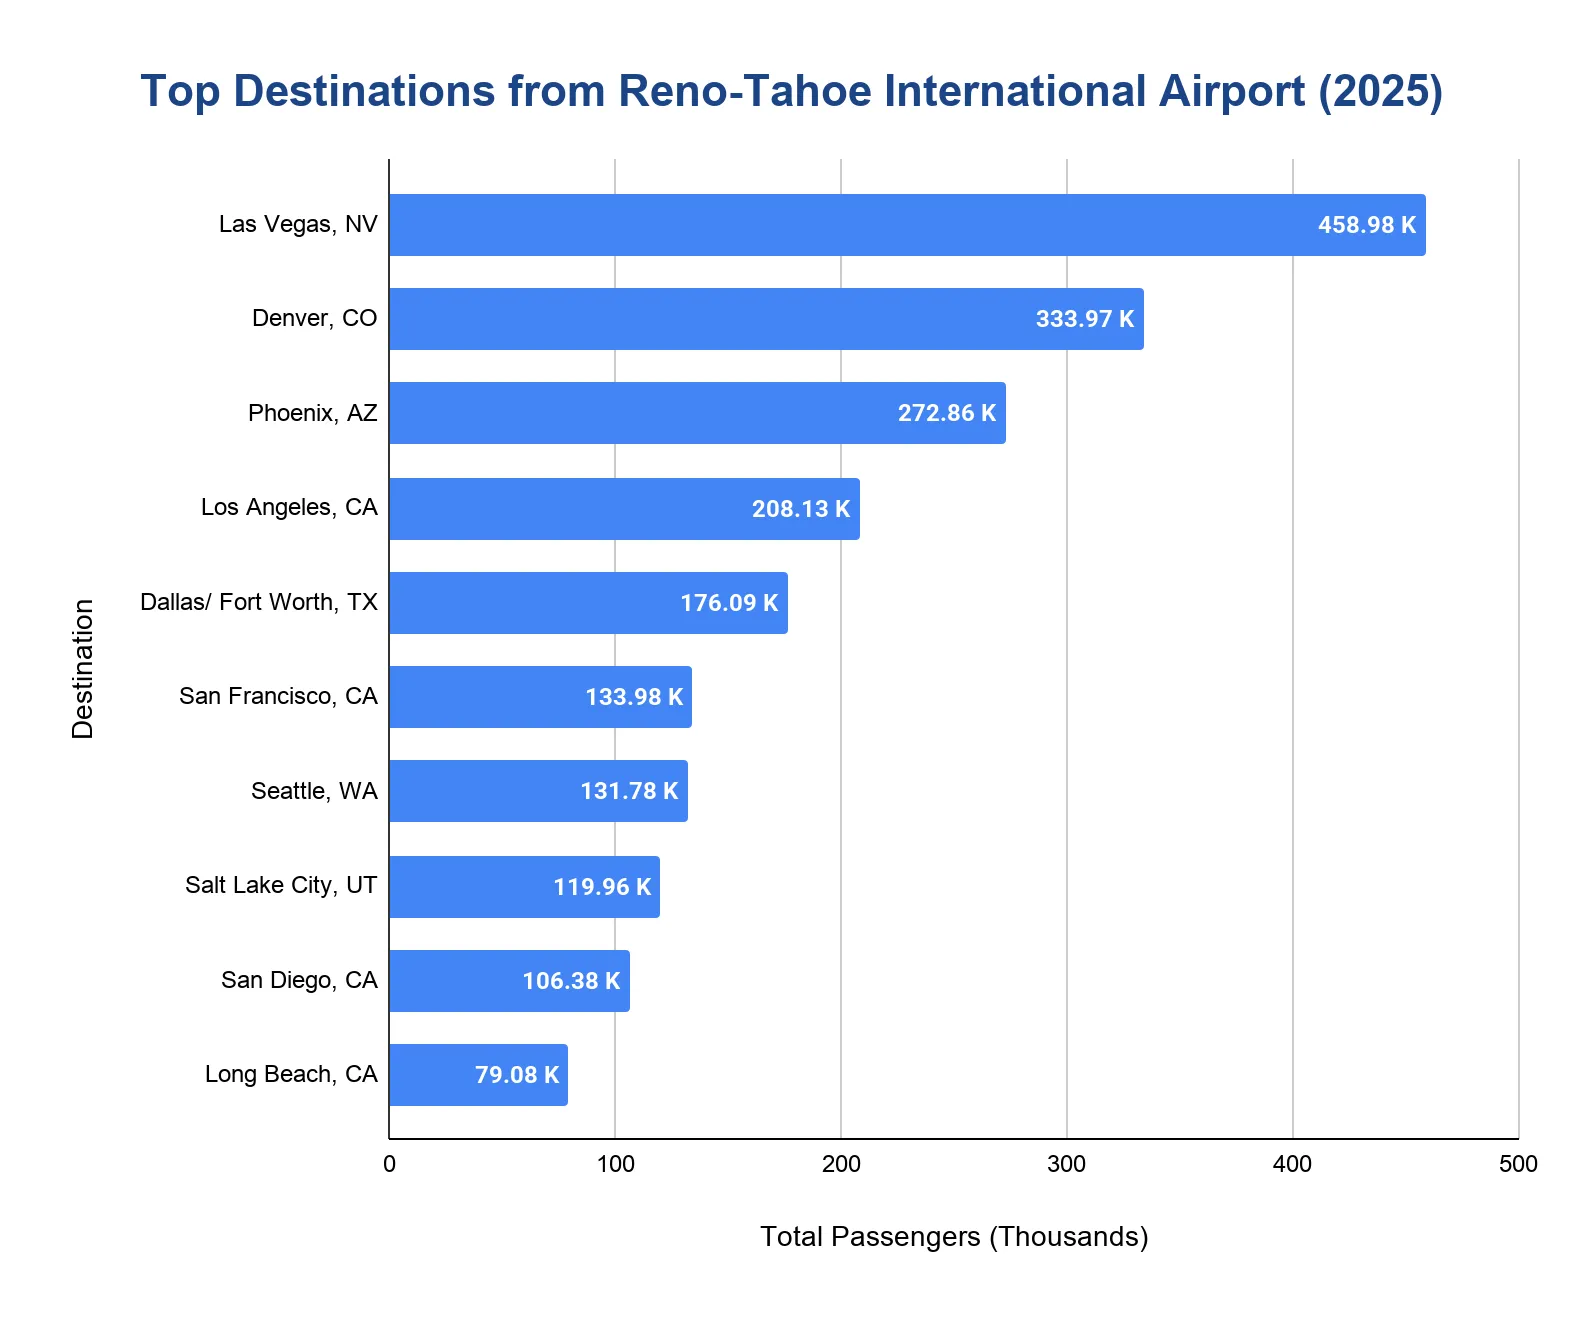
- Las Vegas, NV (LAS) carried 458,980 passengers in 2025, making it the busiest route.
- Denver, CO (DEN) served 333,970 passengers, maintaining its position as the second-busiest route with important hub connections.
- Phoenix, AZ (PHX) handled 272,860 passengers, providing essential connectivity to the Southwest.
- Los Angeles, CA (LAX) served 208,130 passengers, offering connections to international flights and serving the large Southern California market.
- Dallas/Fort Worth, TX (DFW) carried 176,090 passengers, providing access to American Airlines' major hub and Texas markets.
How much cargo does Reno-Tahoe International Airport handle annually?
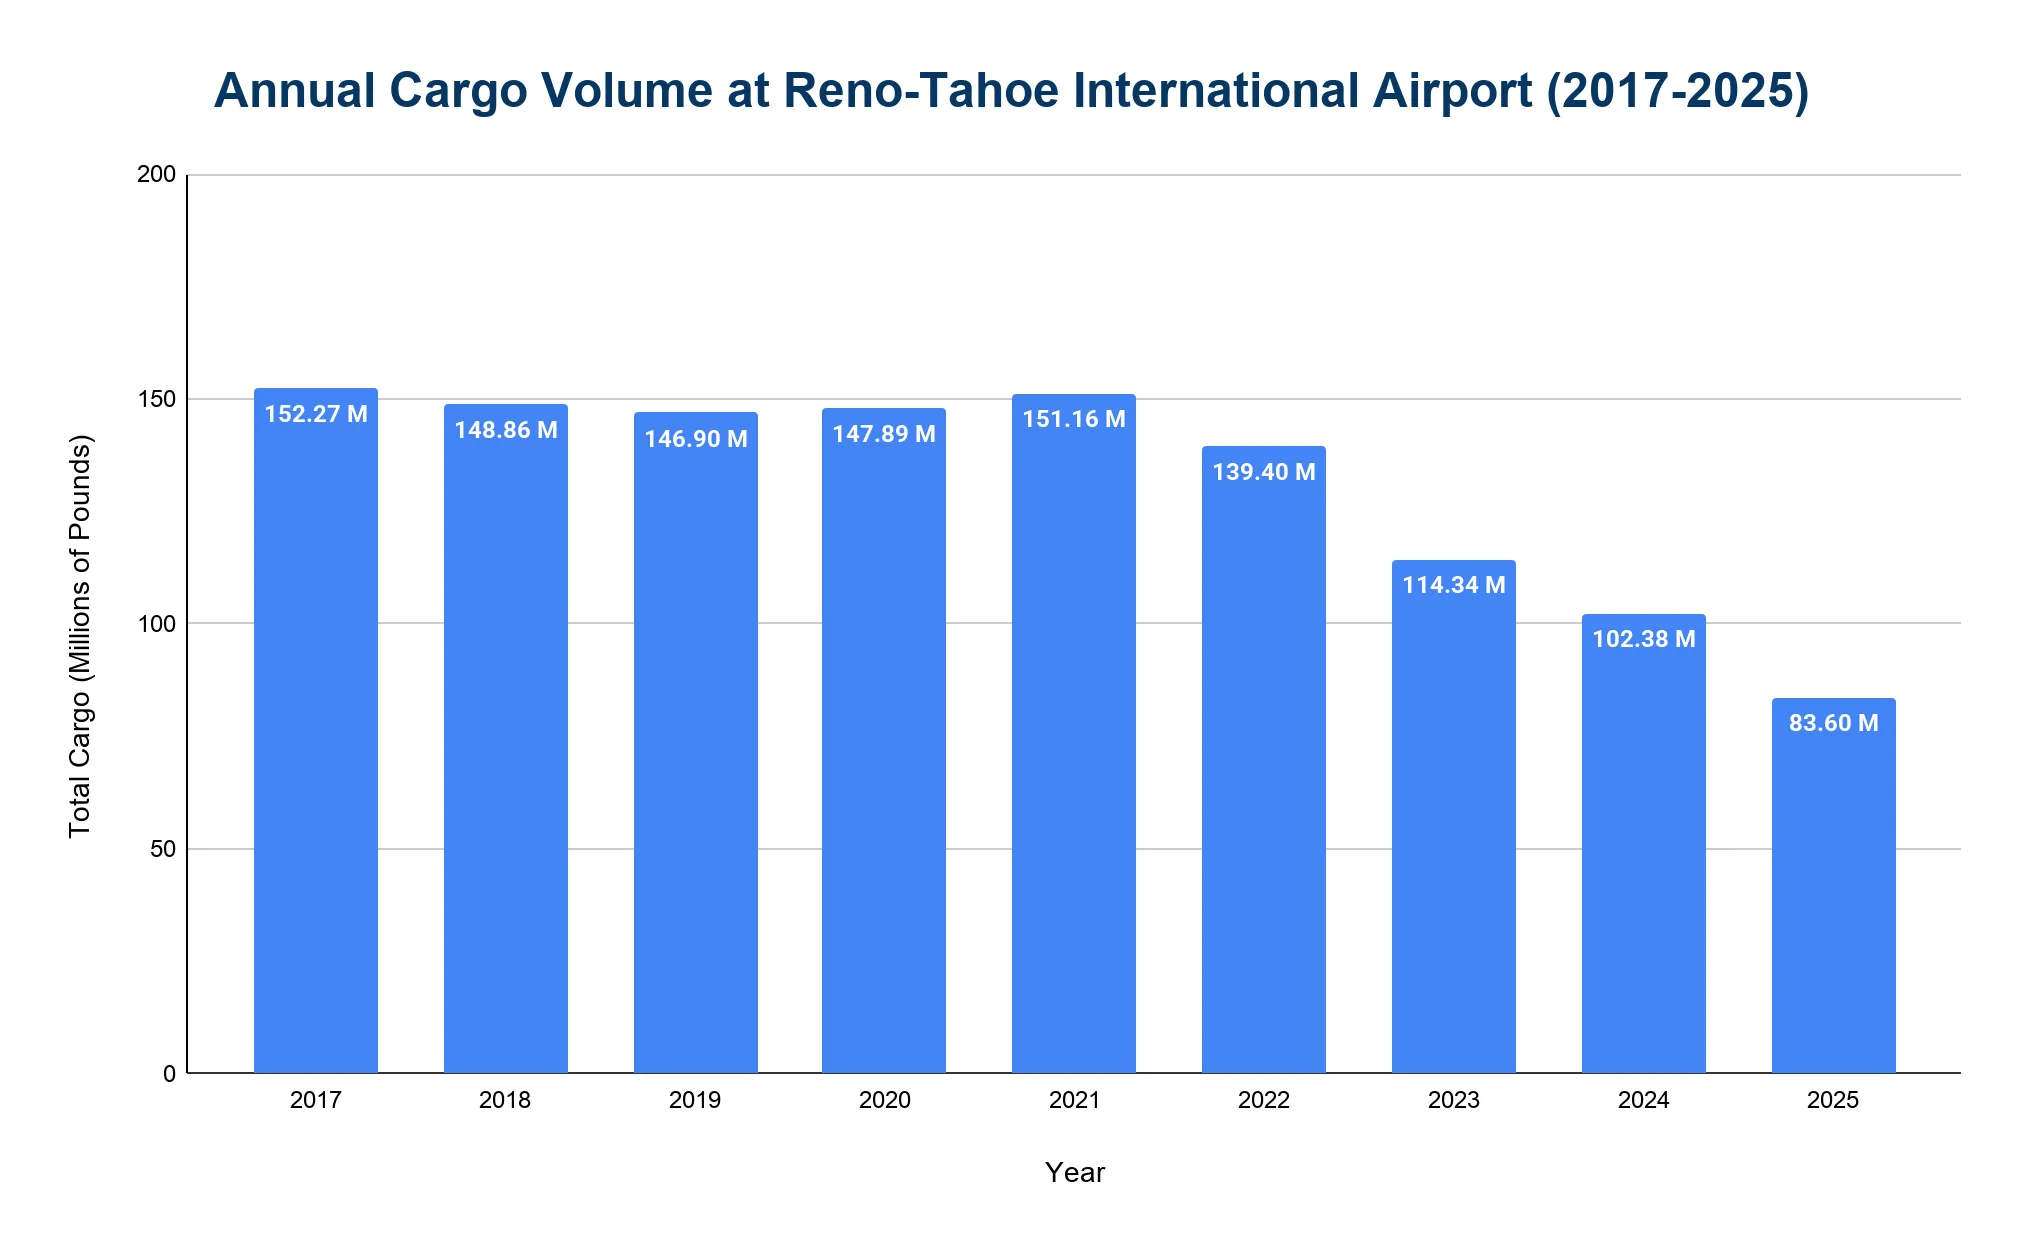
Cargo volume at RNO has declined over the past few years, with the 2025 figure going below 100 million pounds.
- The airport handled 83.60 million pounds in 2025, down from pandemic peaks.
- In 2019, cargo totaled 146.90 million pounds.
- Volumes surged during the pandemic to 147.89 million in 2020 and peaked at 151.16 million in 2021.
- As supply chains normalized, volumes dropped to 139.40 million in 2022, 114.34 million in 2023 and 102.38 million in 2024.
How many cancellations occur at Reno-Tahoe International Airport annually?
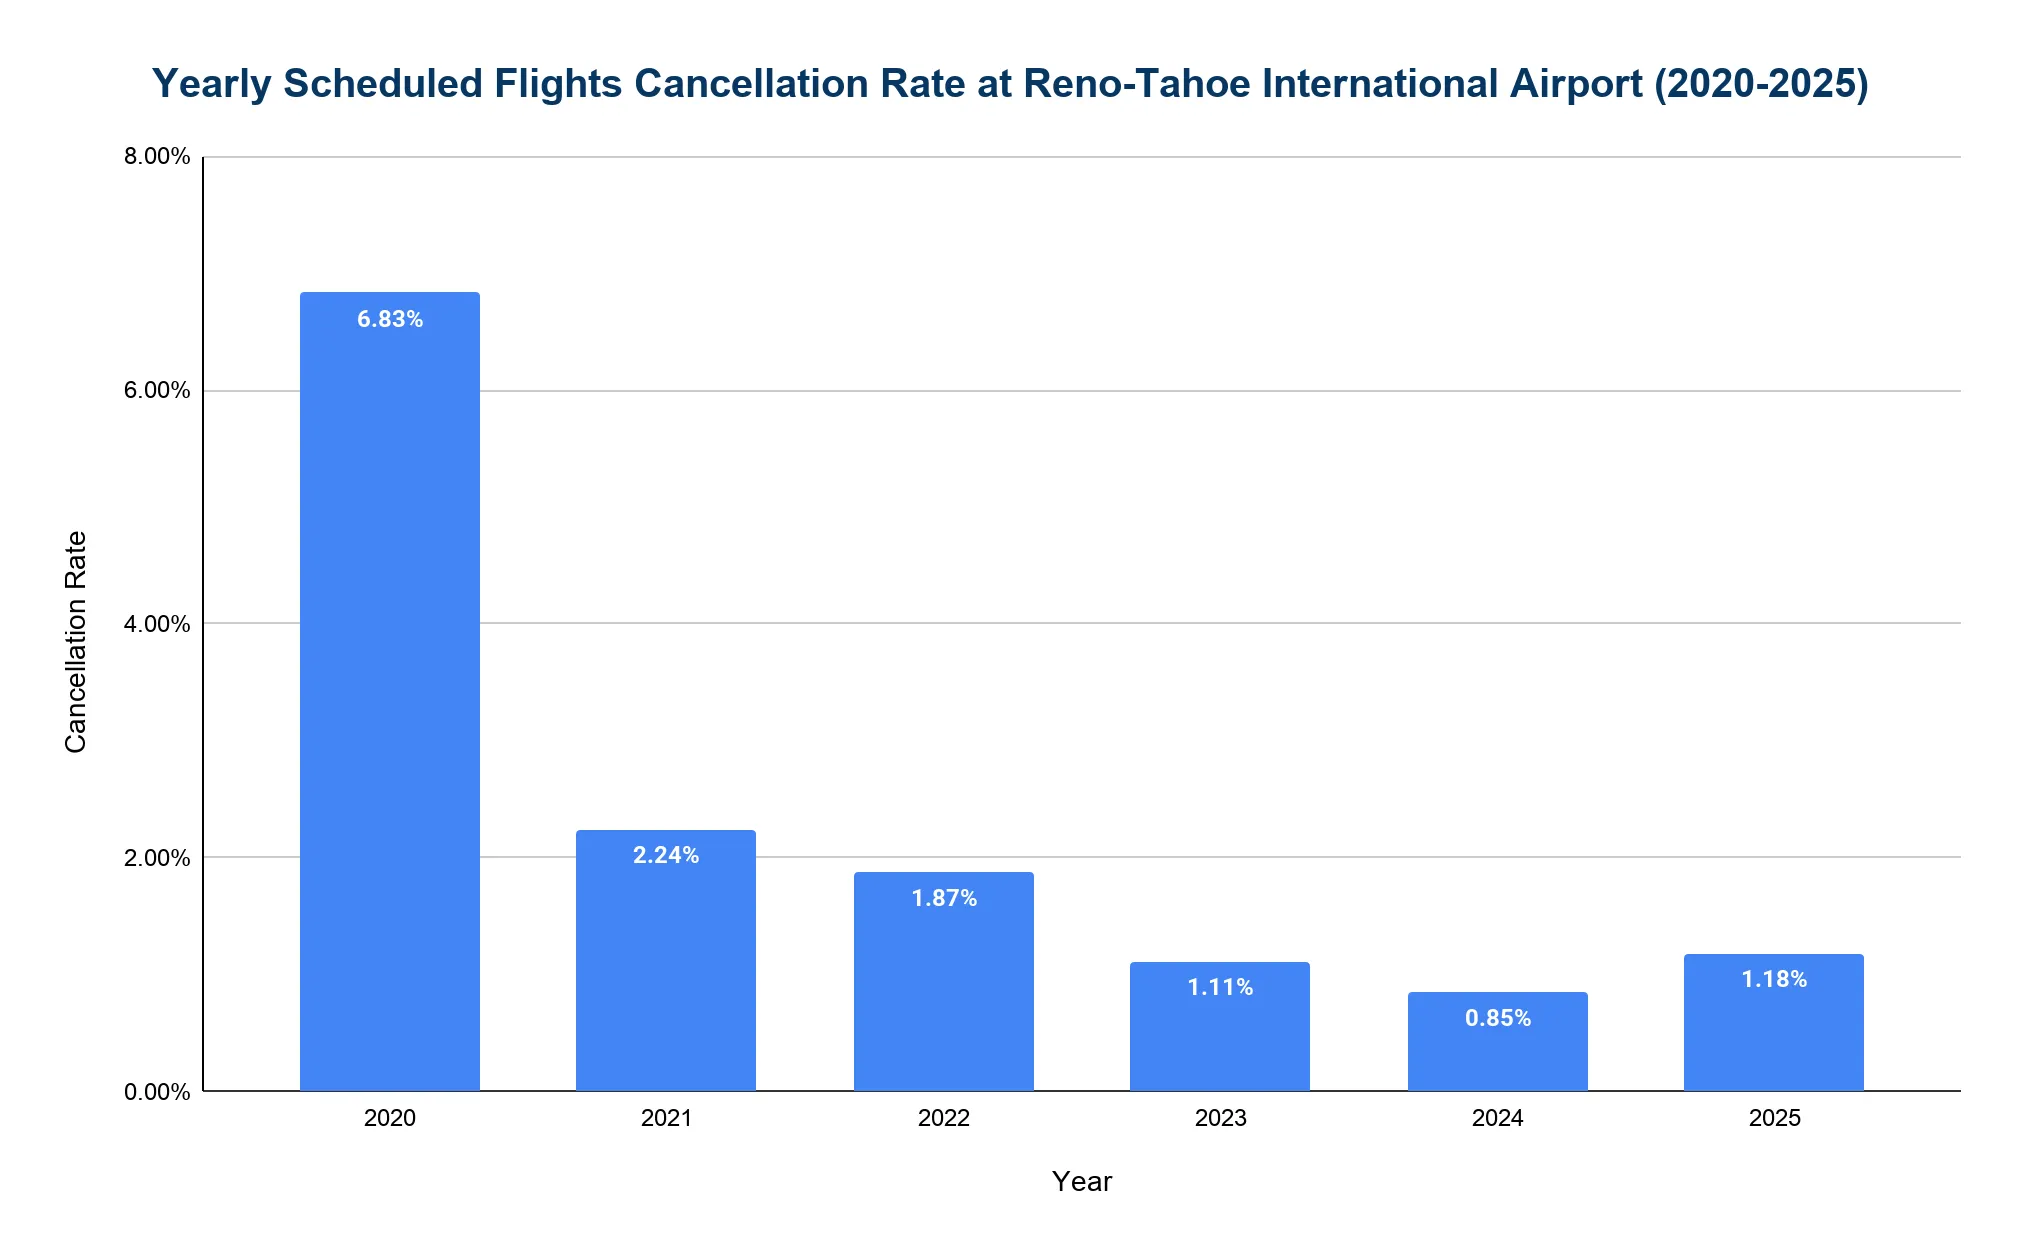
- In 2025, 1.18% of flights were canceled, a slight increase from 0.85% in 2024.
- The highest rate was 6.83% in 2020, due to COVID-19 disruptions.
- In 2021, the rate improved to 2.24%, then 1.87% in 2022 during industry staffing challenges and 1.11% in 2023, continuing a downward trend.
What are the main causes of flight disruptions at Reno-Tahoe International Airport?
- Winter weather from December to February can require de-icing and runway clearing, though the area’s high desert climate often brings VFR (Visual Flight Rules) conditions.
- Wildfire smoke during summer can reduce visibility.
- Air traffic control delays at West Coast hubs like San Francisco (fog) and Los Angeles (congestion) affect RNO flights.
- High elevation and summer heat (4,415 feet) may lead to occasional weight restrictions.
- Upstream delays from hubs, especially San Francisco, which often reports 12 to 15% delay rates on flights to RNO.
How much revenue has Reno-Tahoe International Airport generated each year?
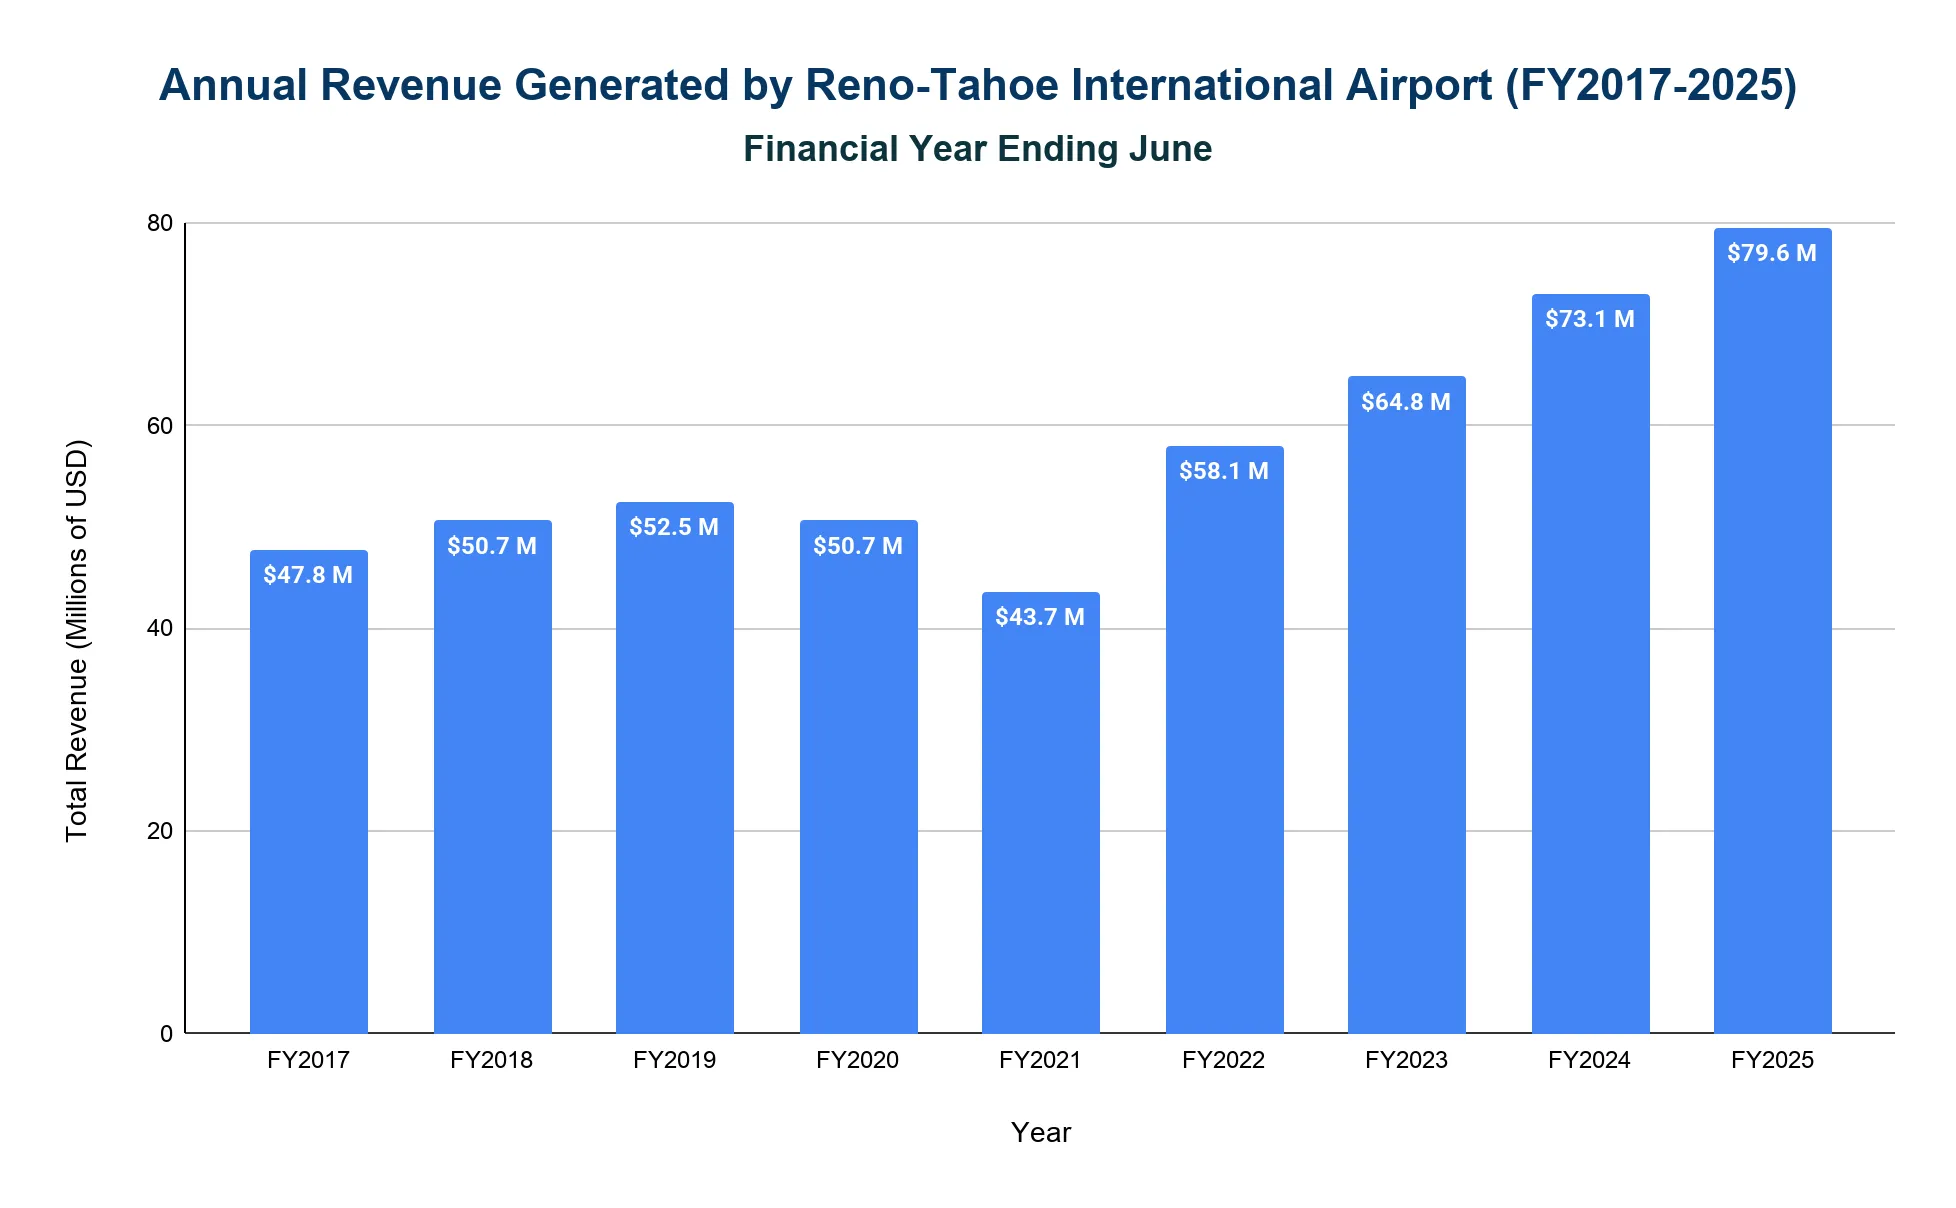
RNO generates $60 to $80 million in annual operating revenue and is financially self-sufficient.
- In FY2025 (ending June 2025), revenue reached $79.6 million, a record high and 8.9% increase from $73.1 million in FY2024.
- Revenue in FY2019 was $52.5 million, dropping to $50.7 million in FY2020 and $43.7 million in FY2021 due to the pandemic.
- Revenue rebounded in FY2022 to $58.1 million and increased to $64.8 million in FY2023, exceeding pre-pandemic levels by 23%.
Related Travel Statistics
- Bangor International Airport (BGR) Statistics
- Boise Airport Statistics
- Bozeman Airport (BZN) Statistics
- Burlington Airport (BTV) Statistics
- Cleveland Hopkins Airport Statistics
- Harrisburg Airport (MDT) Statistics
- Harry Reid Airport (LAS) Statistics
- Jacksonville International Airport Statistics
- Tweed–New Haven Airport (HVN) Statistics
- Newark Airport (EWR) Statistics
- Pittsburgh Airport (PIT) Statistics
- Wilmington International Airport Statistics
What are the notable incidents at Reno-Tahoe International Airport?
- November 24, 1971: The hijacked Northwest Orient Flight 305 later landed in Reno after D.B. Cooper parachuted from the aircraft. Cooper was never found1.
- January 21, 1985: Galaxy Airlines Flight 203 crashed shortly after takeoff, killing 70 of 71 people aboard2.
- March 22, 1995: A Cessna 208B cargo flight crashed during an instrument approach near Reno, killing the pilot.3
- April 13, 2011: A Reno-Tahoe tower controller fell asleep during an overnight shift while a medical flight was landing safely4.
References
- FBI — D.B. Cooper Hijacking · fbi.gov ↑
- NTSB Aviation Accident Report — Galaxy Airlines Flight 203 (1985) · data.ntsb.gov ↑
- NTSB Aviation Accident Report — Cessna 208B near Reno (1995) · data.ntsb.gov ↑
- U.S. DOT — FAA Announces Additional Staffing for 27 Control Towers · transportation.gov ↑
- RTIA — Reno-Tahoe International Airport Monthly Activity Data · renoairport.com
- BTS TranStats — Airport profiles (route information by airport) · transtats.bts.gov
- NSLA — Reno-Tahoe International Airport Comprehensive Annual Financial Reports · epubs.nsla.nv.gov
- Incidents at Jackson–Medgar Wiley Evers International Airport — NTSB · ntsb.gov

