

 Popular Countries
 24/7 Support
Published Sep 9, 2026
Patrick Leahy Burlington International Airport (BTV) sits about 3 miles east of downtown Burlington in South Burlington, Vermont. It is Vermont’s largest commercial airport and operates as a joint civil-military facility, with the Vermont Air National Guard’s 158th Fighter Wing sharing the airfield alongside commercial flights.
How many passengers use Burlington International Airport each year?
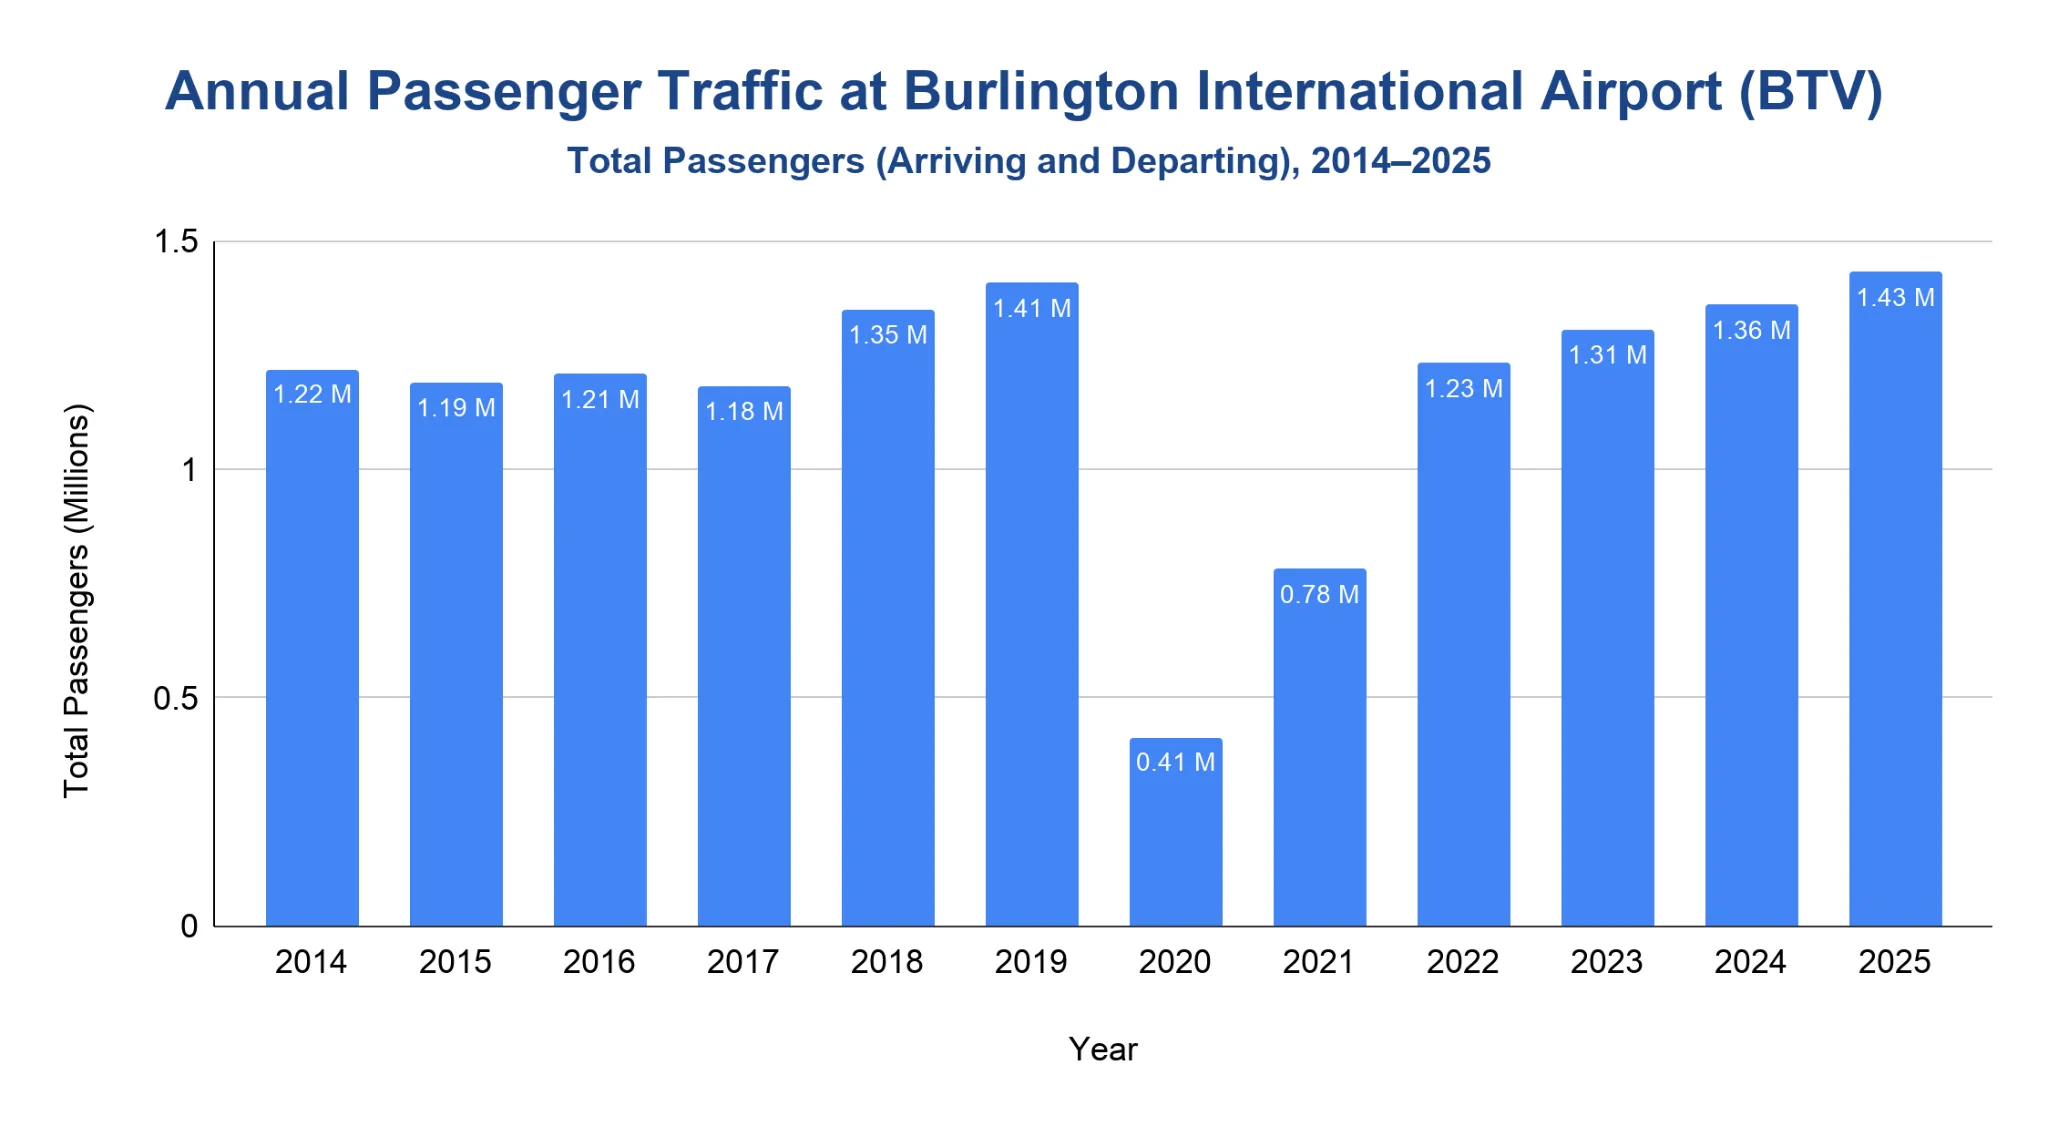
Burlington International Airport handled 1.43 million calculated total passengers in 2025.
- From 2014 through 2018, traffic moved from 1.22 million to 1.35 million total passengers.
- The pre-pandemic peak came in 2019, when BTV handled 1.41 million total passengers.
- The pandemic cut traffic to 413,018 in 2020, followed by 781,341 in 2021.
- Post-pandemic recovery lifted traffic to 1.23 million in 2022, 1.31 million in 2023, 1.36 million in 2024, and 1.43 million in 2025.
Note: Calculated total passengers add official enplanements and official deplanements, so the metric represents departing and arriving passengers combined.
Does Burlington International Airport handle domestic or international flights?
BTV’s current airport-published nonstop route list contains U.S. destinations only.
- The airport lists nonstop service to U.S. markets including Atlanta, Charlotte, Chicago, Detroit, Denver, New York, Philadelphia, Washington, and Florida leisure destinations.
- Seasonal service is identified separately on the airport route list, including destinations such as Charleston, Houston, Jacksonville, Minneapolis-St. Paul, and Raleigh-Durham.
- BTV is located about 70 km from the U.S. border, so Canadian travelers can use the airport even when scheduled nonstop routes are domestic.
- BTV’s Air Carrier Incentive Program identifies both international and domestic passenger air service as targets for air-service development.
Note: Domestic nonstop service can still connect passengers to international flights through larger hub airports.
How many aircraft operations occur at Burlington International Airport each year?
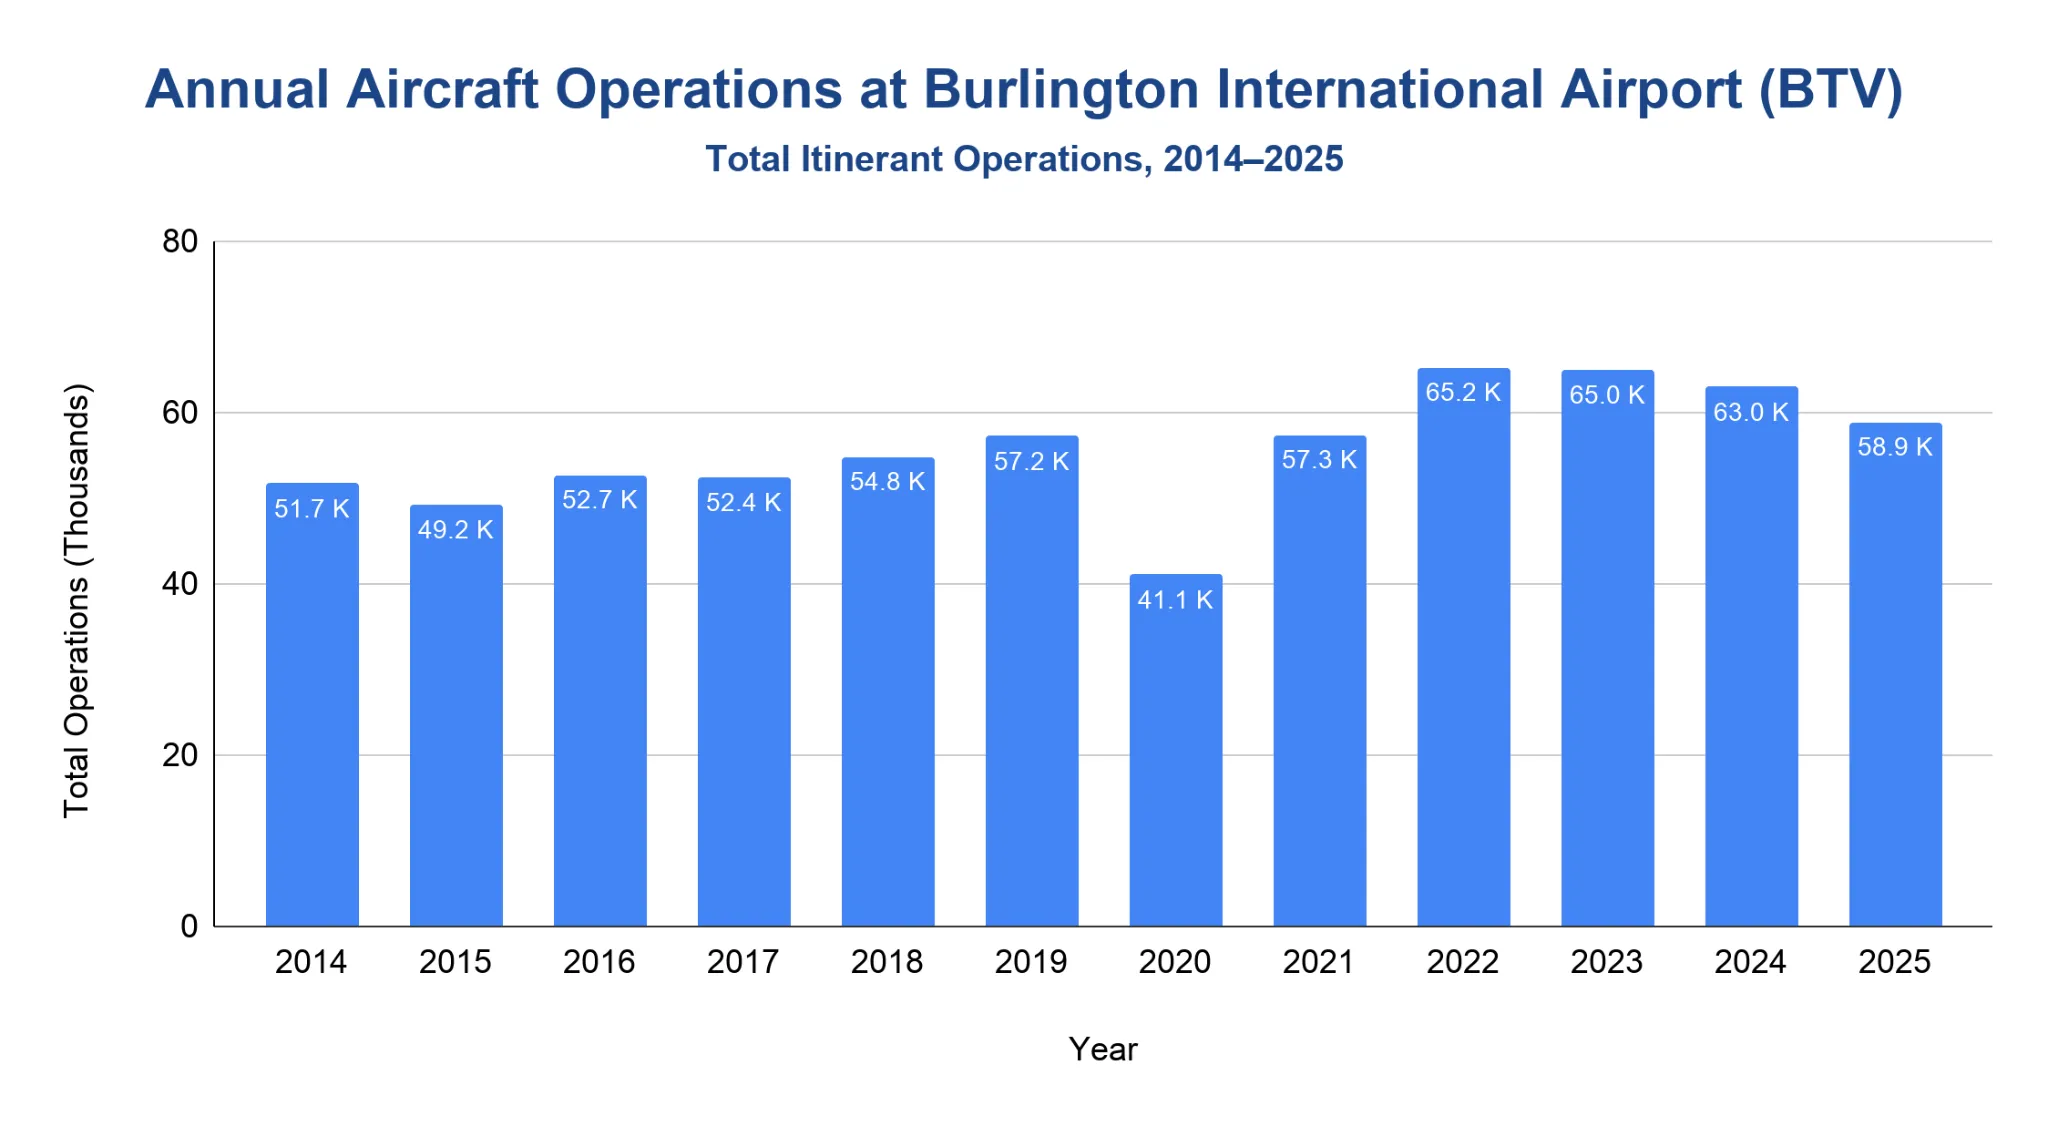
BTV recorded 58,858 itinerant aircraft operations in 2025.
- From 2014 through 2018, itinerant operations stayed in a narrow range, rising from 51,653 to 54,802.
- The pre-pandemic high came in 2019, when BTV recorded 57,185 itinerant operations.
- Operations fell to 41,063 in 2020, with air carrier and air taxi activity both dropping sharply.
- Post-pandemic activity peaked at 65,219 in 2022, then eased to 64,973 in 2023, 62,957 in 2024, and 58,858 in 2025.
- As of March 2026, BTV had recorded 12,207 itinerant operations.
| Aircraft Operations by Type at BTV | ||||
|---|---|---|---|---|
| Calendar Year | Air Carrier | Air Taxi | General Aviation | Military |
| 2014 | 13,409 | 12,648 | 21,118 | 4,478 |
| 2015 | 12,933 | 12,321 | 20,080 | 3,851 |
| 2016 | 11,563 | 14,842 | 21,743 | 4,521 |
| 2017 | 11,186 | 15,498 | 22,469 | 3,295 |
| 2018 | 13,987 | 14,624 | 23,476 | 2,715 |
| 2019 | 13,920 | 14,493 | 25,795 | 2,977 |
| 2020 | 6,917 | 7,935 | 22,857 | 3,354 |
| 2021 | 10,022 | 9,497 | 33,087 | 4,739 |
| 2022 | 16,827 | 7,223 | 37,255 | 3,914 |
| 2023 | 16,887 | 7,383 | 37,279 | 3,424 |
| 2024 | 17,491 | 7,622 | 34,716 | 3,128 |
| 2025 | 19,107 | 6,278 | 30,654 | 2,819 |
Source · Note: Itinerant operations are arrivals and departures that travel between BTV and another airport, rather than local flights that remain in the airport traffic pattern.
Which airlines operate the most flights out of Burlington International Airport?
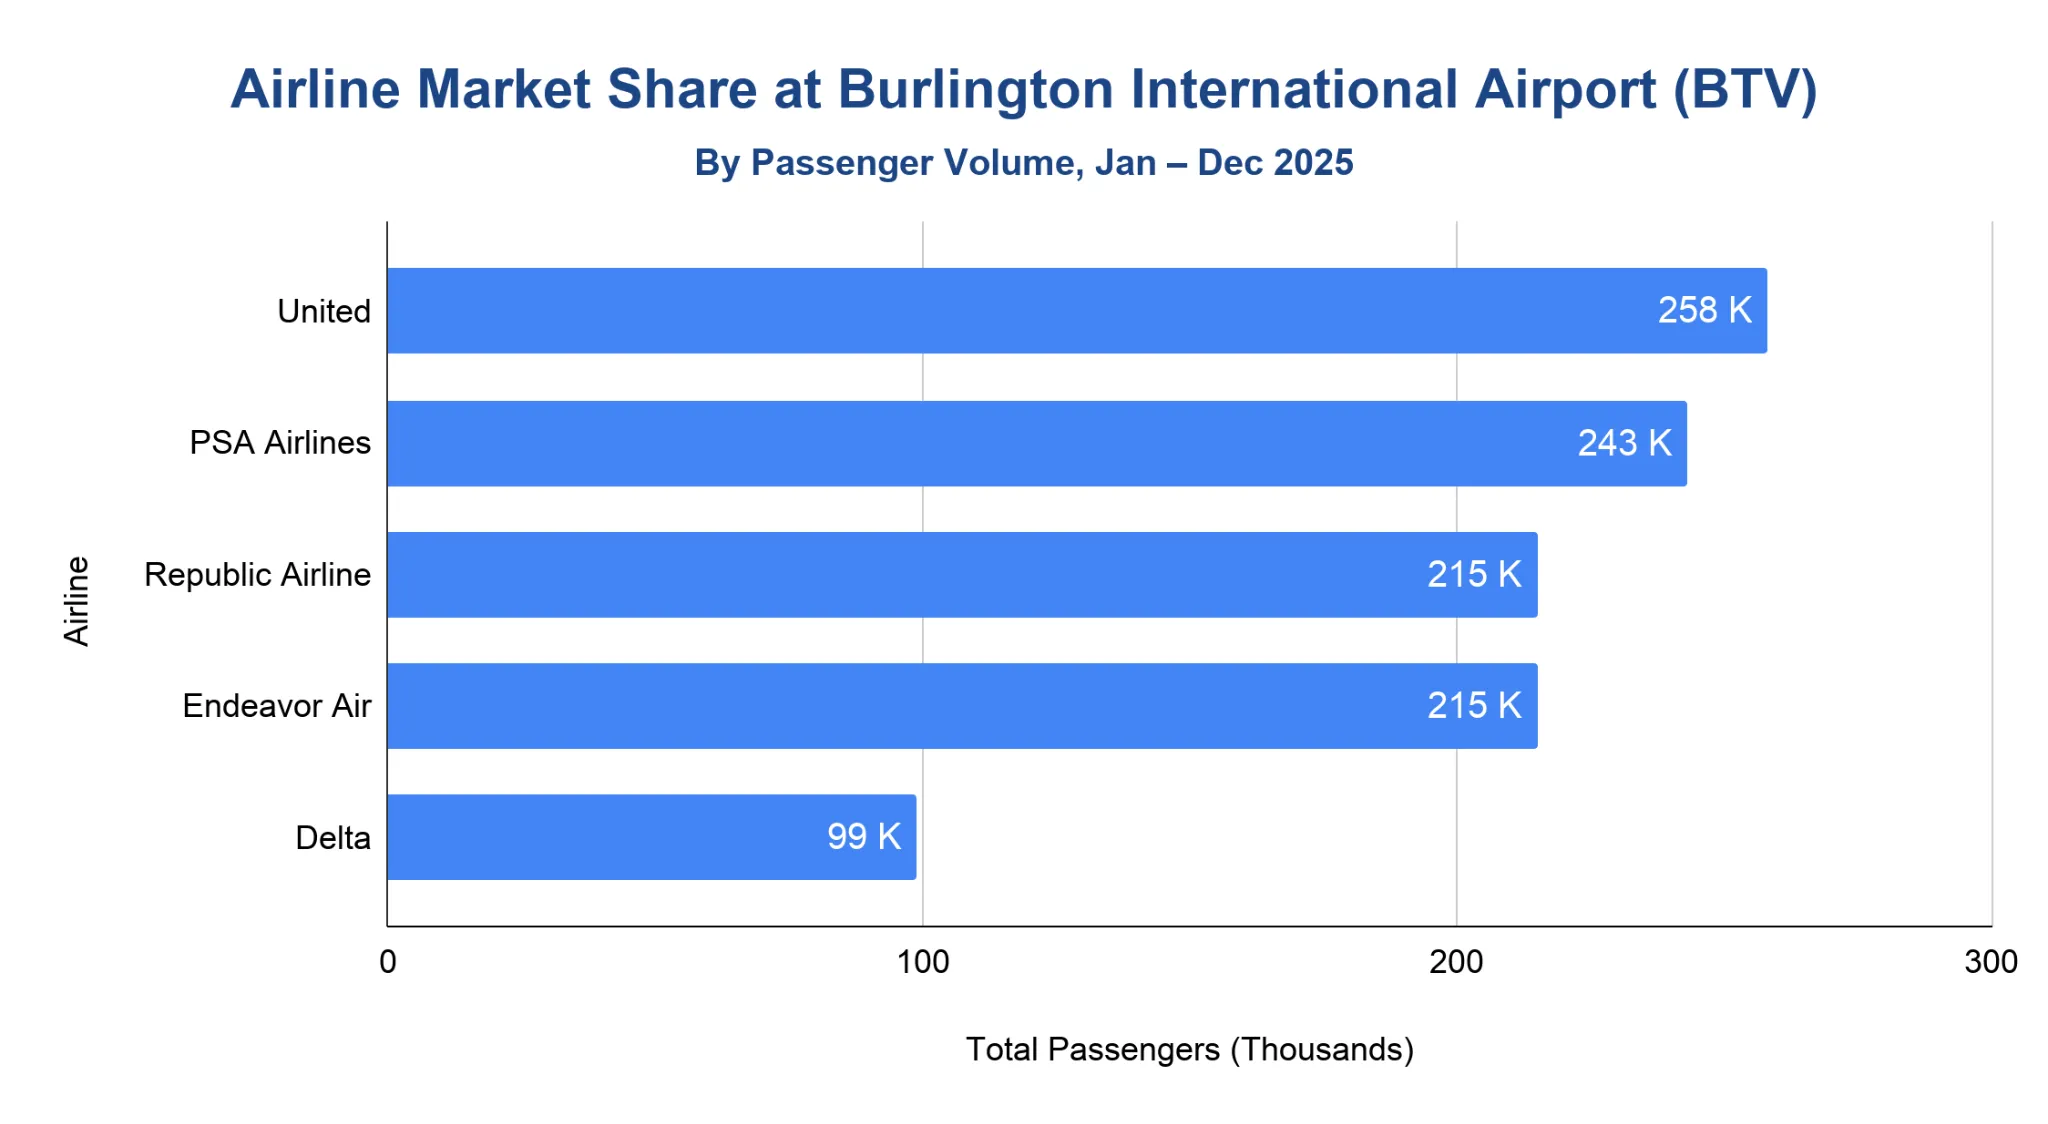
The Bureau of Transportation Statistics (BTS) carrier data counted 1.41 million BTV passengers across reporting carriers in 2025.
- United was the largest reporting carrier, with 258,000 passengers and an 18.26% share.
- PSA Airlines followed with 243,000 passengers and a 17.2% share.
- Republic Airline and Endeavor Air each carried about 215,000 passengers, with shares of 15.26% and 15.23%, respectively.
- Delta carried 98,950 passengers, equal to 7.02% of the BTS carrier total.
- Other carriers together accounted for 380,050 passengers, or 26.95% of the total.
Note: BTS carrier tables are organized by reporting carriers, so regional airlines may appear separately from the major airline brands shown to passengers during booking. BTS carrier data focuses on major reporting airlines and may differ from the airport’s total calculated passenger figures, which include all commercial, regional, and charter activity.
What are the most popular destinations from Burlington International Airport?
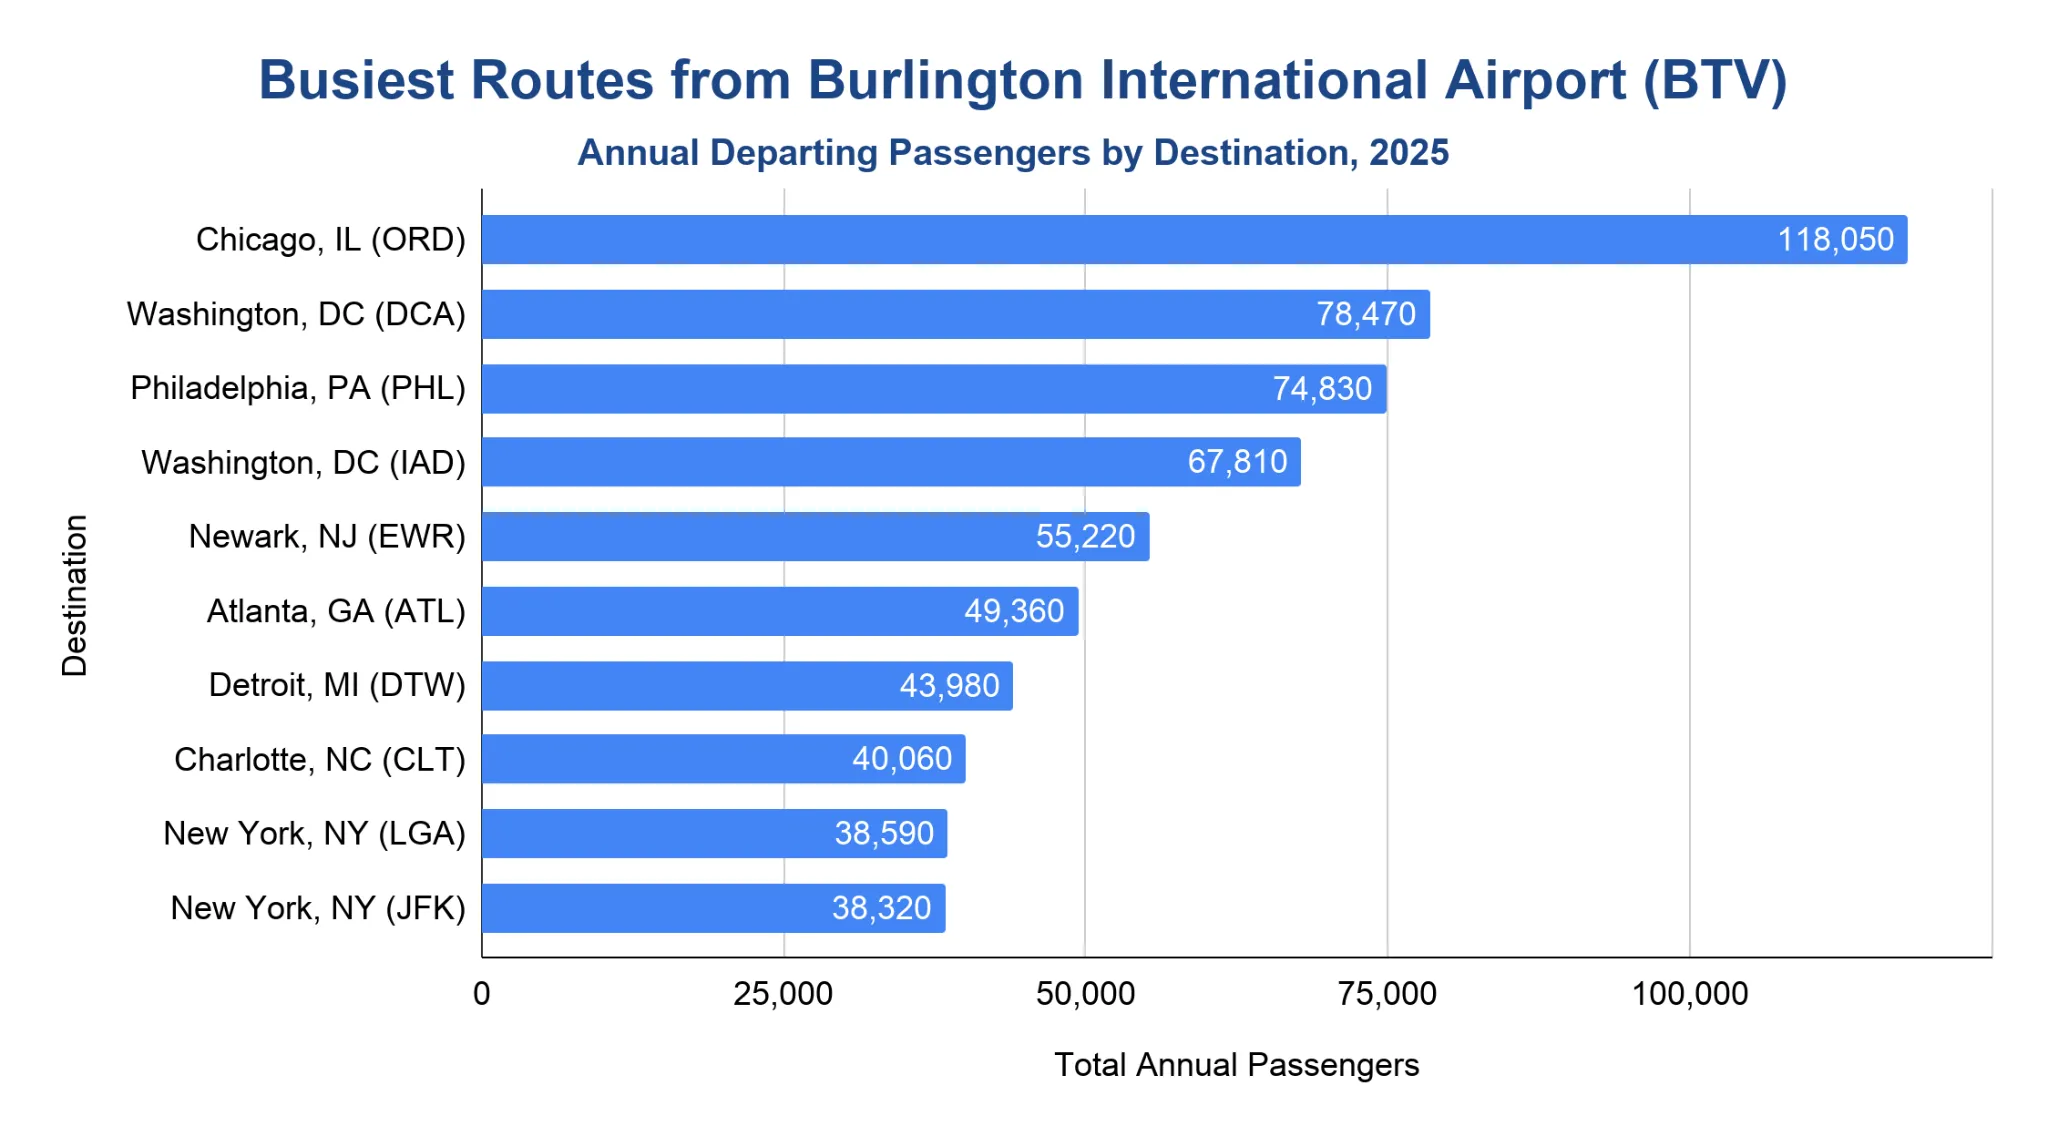
Chicago O’Hare was BTV’s busiest T-100 domestic market in 2025, with 118,050 departing passengers.
- Washington-Reagan followed with 78,470 departing passengers, while Philadelphia handled 74,830.
- Washington-Dulles ranked fourth with 67,810 departing passengers, giving the Washington, D.C. market two airports in BTV’s top 4.
- Newark recorded 55,220 departing passengers, followed by Atlanta with 49,360 and Detroit with 43,980.
- Charlotte, New York-LaGuardia, and New York-JFK rounded out the top 10, each with more than 38,000 departing passengers.
Note: Based on BTS Reporting Carrier Data. T-100 Domestic Market data is directional, so the graph reflects passengers traveling from BTV to each listed destination.
Peak Travel Months at Burlington International Airport
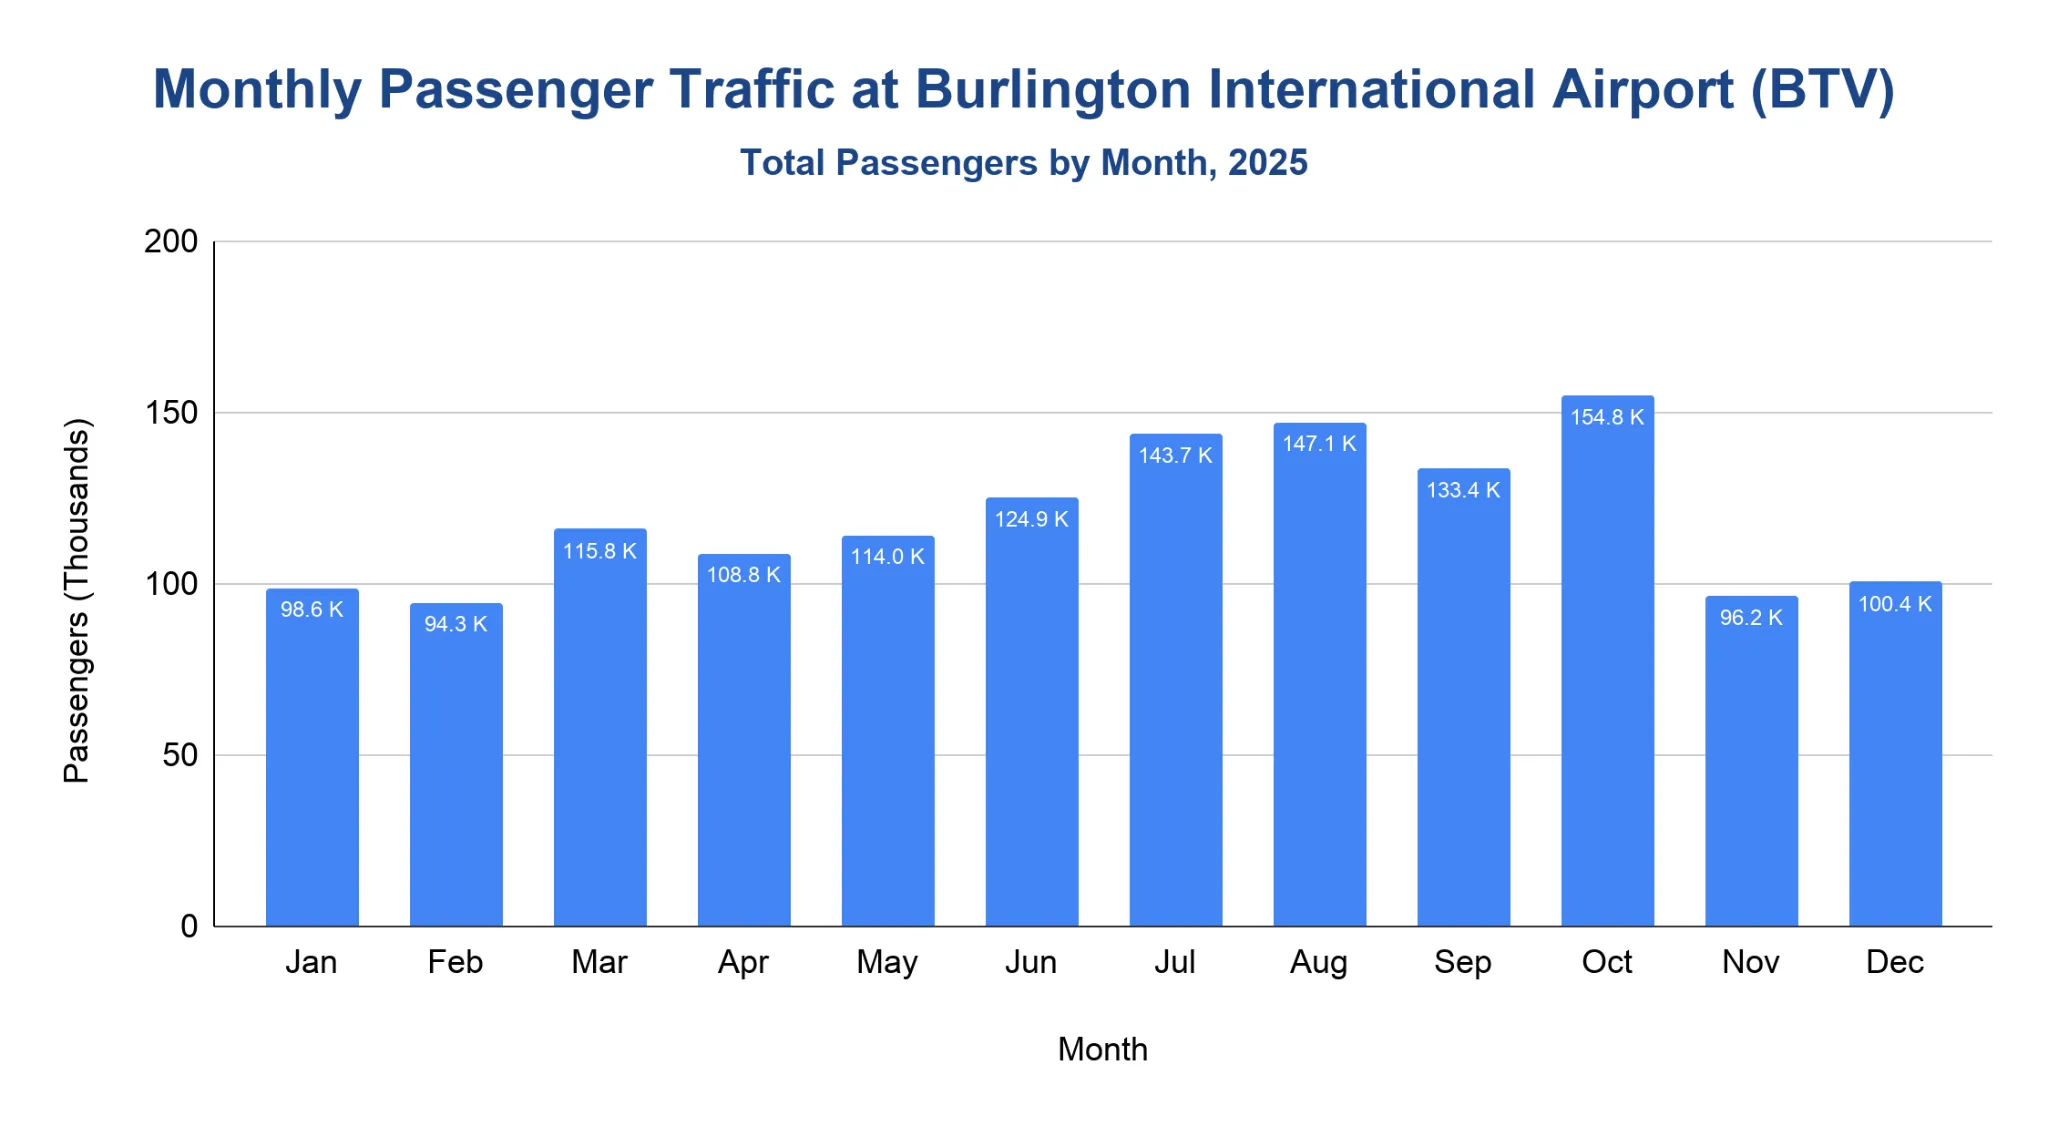
October was BTV’s busiest month in 2025, with 154,785 calculated total passengers.
- August followed with 147,061 total passengers, while July reached 143,656.
- Monthly traffic exceeded 124,000 total passengers from June through October.
- February and November were the lowest months, with 94,334 and 96,204 total passengers.
- December finished at 100,374, while March and May both topped 114,000.
Note: Calculated total passengers are highest when strong outbound enplanements and inbound deplanements occur in the same month.
How much revenue does Burlington International Airport generate annually?
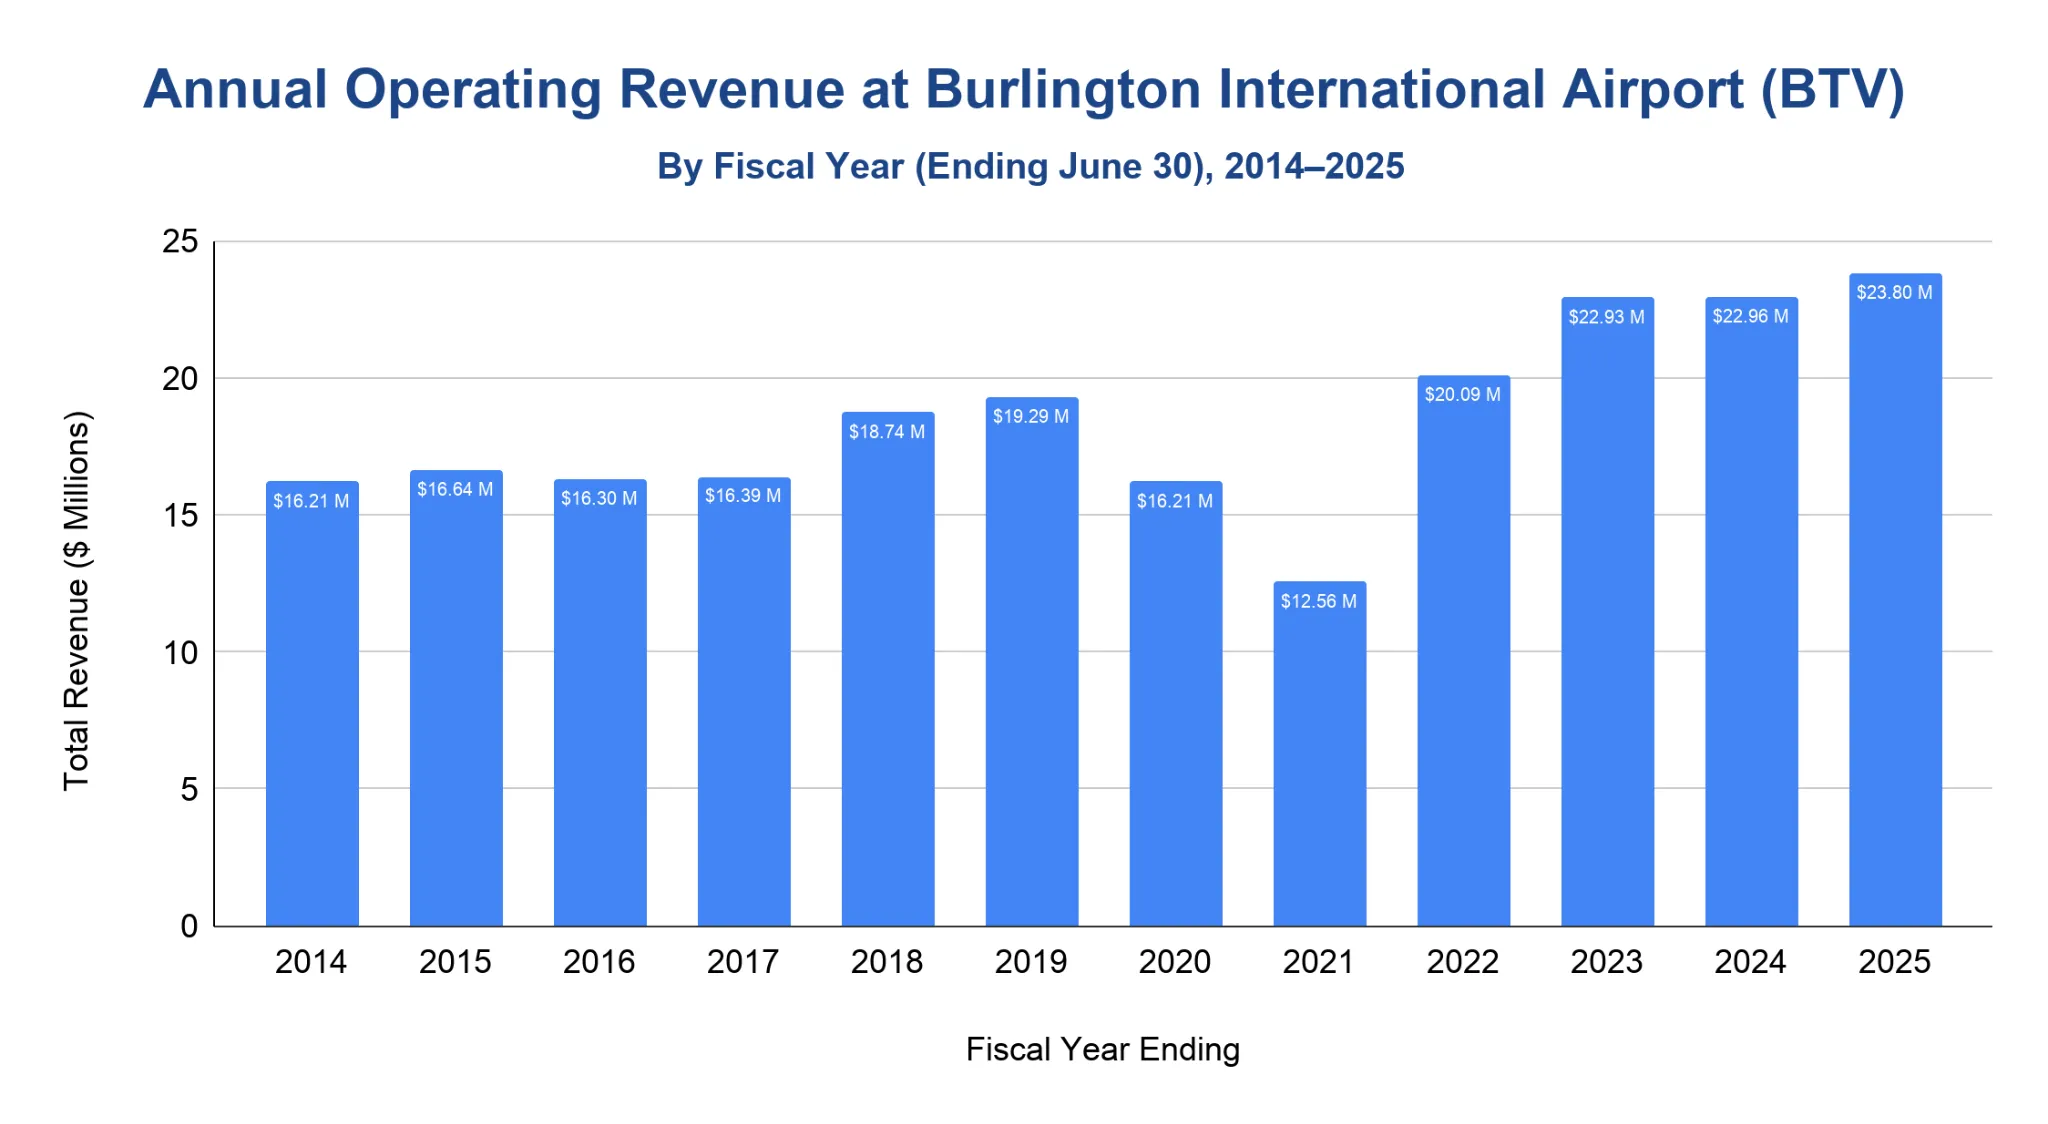
BTV generated $23.8 million in total operating revenue in fiscal year 2025.
- Total operating revenue was broadly stable from 2014 through 2017, ranging from $16.21 million to $16.39 million.
- Revenue climbed to $18.74 million in 2018 and reached a pre-pandemic high of $19.29 million in 2019.
- COVID-era disruption pushed operating revenue down to $16.21 million in 2020 and $12.56 million in 2021.
- Post-pandemic revenue recovered to $20.09 million in 2022, $22.93 million in 2023, $22.96 million in 2024, and $23.80 million in 2025.
- Passenger Facility Charge revenue reached $2.86 million in fiscal year 2025.
Note: BTV’s fiscal year ends June 30. Passenger Facility Charge revenues are reported separately from operating revenues in the airport financial statements.
Economic Impact at Burlington International Airport
BTV supported $1.07 billion in total economic output in 2025.
- The airport’s economic impact study estimated 5,646 statewide jobs and $325.43 million in labor income.
- Direct airport-related activity accounted for 3,807 jobs, while induced impacts supported another 1,869 jobs.
- Visitor activity included 353,892 total visitors and $161.40 million in annual visitor spending.
- BTV-related activity generated $62.54 million in estimated state and local tax impacts.
- The airport’s existing facility value was estimated at $808 million, contributing to a combined airport regional value of $1.88 billion.
Note: Economic output includes direct, indirect, and induced effects, while labor income, jobs, visitor spending, and tax impacts describe specific components of the broader airport economy.
How much cargo moves through Burlington International Airport each year?
FAA recorded 55.55 million lbs of all-cargo landed weight at BTV in calendar year 2024.
- The FAA measure is all-cargo landed weight, not cargo tons handled.
- BTV ranked 134th in the FAA’s calendar year 2024 all-cargo landed-weight list.
- BTV’s 2024 landed weight was 7.97% lower than 2023, when the airport recorded 60.36 million lbs.
- The FAA’s all-cargo dataset is the official U.S. airport source available for this metric.
Note: All-cargo landed weight measures the landed weight of all-cargo aircraft and should not be read as freight tonnage handled.
What is Burlington International Airport's on-time performance?
Major U.S. carrier flights at BTV recorded 76% on-time departures and 74% on-time arrivals from March 2025 through February 2026.
- Departure performance was highest in 2021, when 86% of reported flights left on time.
- Arrival performance also peaked in 2021, with 83% of reported flights arriving on time.
- The cancellation rate rose from 1.20% in 2021 to 4.19% in 2022, then moved to 2.68% in 2023, 2.01% in 2024, and 3.13% in 2025.
- Average delay for delayed departures increased from 89.58 minutes in 2021 to 120.22 minutes in 2025.
- The rolling March 2025 to February 2026 period covered 5,565 flights reported by 6 major U.S. carriers.
| Performance Metric | 2021 | 2022 | 2023 | 2024 | 2025 | 2026* |
|---|---|---|---|---|---|---|
| On-time departures | 86% | 79% | 83% | 83% | 76% | 76% |
| On-time arrivals | 83% | 76% | 79% | 79% | 74% | 74% |
| Average departure delay (min.) | 89.58 | 99.97 | 95.93 | 101.17 | 120.22 | 121.97 |
| Average arrival delay (min.) | 62.83 | 69.92 | 62.88 | 69.34 | 81.46 | 84.35 |
| Cancelled flights | 1.20% | 4.19% | 2.68% | 2.01% | 3.13% | 2.86% |
| Reported flights | 4,908 | 8,216 | 7,812 | 8,122 | 6,551 | 5,565 |
| Reporting carriers | 9 | 11 | 9 | 11 | 8 | 6 |
Source · Note: A flight is counted as delayed when it arrives or departs 15 or more minutes later than scheduled; average delay minutes are calculated from delayed flights only. BTS publishes average delays in decimal-minute format. As such, the values have been kept exactly as reported to avoid altering the underlying data. *2026 reflects March 2025 – February 2026.
Related Travel Statistics
- Birmingham Airport (BHM) Statistics
- Buffalo Airport (BUF) Statistics
- Jackson Airport (JAN) Statistics
- Missoula Montana Airport (MSO) Statistics
- Monterey Regional Airport (MRY) Statistics
- Most Delayed US Airports
- Orlando Airport (MCO) Statistics
- Pittsburgh Airport (PIT) Statistics
- Rochester Airport (ROC) Statistics
- San Antonio International Airport Statistics
- Wichita Airport (ICT) Statistics
- Worcester Regional Airport (ORH) Statistics
Major Expansion Projects at Burlington International Airport
Project NexT opened to screened passengers on March 31, 2026, after adding approximately 25,000 square feet of second-level terminal space.
- The project replaced 4 aircraft gates and 4 passenger boarding bridges, as well as adding new passenger circulation space.
- Funding came primarily from FAA Airport Improvement Program funds and fiscal year 2023 Congressional Directed Spending, with 90% federal funding and a 10% local share supported by Passenger Facility Charges.
- The airport’s fiscal year 2025 financial statements show $23.37 million in North Terminal Concourse Replacement capital additions during the year.
- Other fiscal year 2025 capital additions included $5.17 million for the Runway 15-33 Mill & Overlay project, and $413,547 for the Taxiway A Mill & Overlay project.
- Project NexT incorporates mass timber, geothermal energy, and solar power as part of the airport’s sustainability approach.
Note: Project NexT is the passenger-terminal expansion; runway and taxiway improvements are separate capital projects reported in the same airport financial statement.
What are Burlington International Airport’s environmental goals?
BTV has achieved Airport Carbon Accreditation Level 1 and is working toward Level 2.
- Project NexT was designed with net-zero energy goals and incorporates solar and geothermal systems.
- The airport reports a utility-scale solar photovoltaic array on the parking-garage roof.
- In February 2024, BTV received $459,698 through the Vermont State Clean Water Fund for MS4 stormwater improvements.
- In June 2024, BTV was awarded $3.56 million through the Northern Border Regional Commission’s Timber for Transit Program.
- The Timber for Transit grant supports mass timber framing and Vermont maple ceilings in the terminal expansion.
Note: Level 1 Mapping focuses on measuring and verifying the airport’s carbon footprint; Level 2 is BTV’s next stated accreditation step.
References
- BTV — Official Airport Data (2014–2026) · btv.aero
- FAA: MCO Aircraft Operations and Cargo Data · faa.gov
- FAA OPSNET — Airport Operations (2014–April 2026) · aspm.faa.gov
- BTS Airline, Destination, Monthly Passenger, and On-Time Data (2021–2026) · transtats.bts.gov
- CBUR — Airport Financial Statements and Revenue Data (FY2014–FY2025) · burlingtonvt.gov

