

 Popular Countries
 24/7 Support
Published
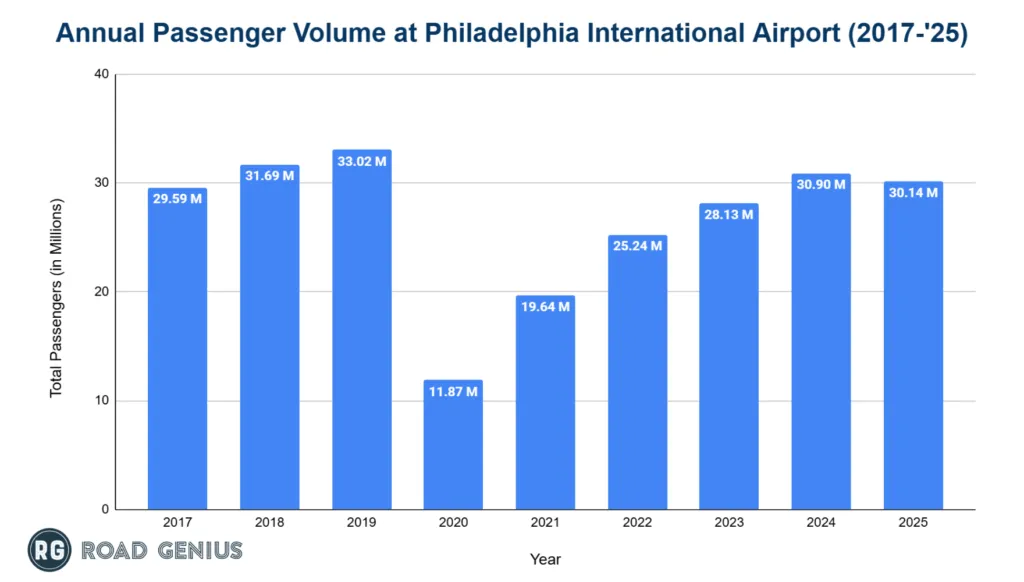
Philadelphia International Airport (PHL) ranks as the 21st busiest airport in the United States and is the fifth-largest hub for American Airlines. Over 30 million travelers pass through PHL each year, making the airport a vital transatlantic gateway for the Delaware Valley.
How many passengers pass through Philadelphia International Airport each year?
Philadelphia International Airport handles over 30 million passengers annually.
- PHL welcomed 30.14 million passengers in 2025, a 2.5% decrease from 2024 that interrupted the post-pandemic rebound.
- The airport handled 30.90 million passengers in 2024, up 9.8% from 28.13 million in 2023.
- Traffic peaked at 33.02 million in 2019, dipped to 11.87 million in 2020, then began climbing with 19.64 million passengers in 2021 and 25.24 million in 2022.
- Passenger totals in 2025 reached about 91% of the 2019 record.
International vs Domestic Passengers
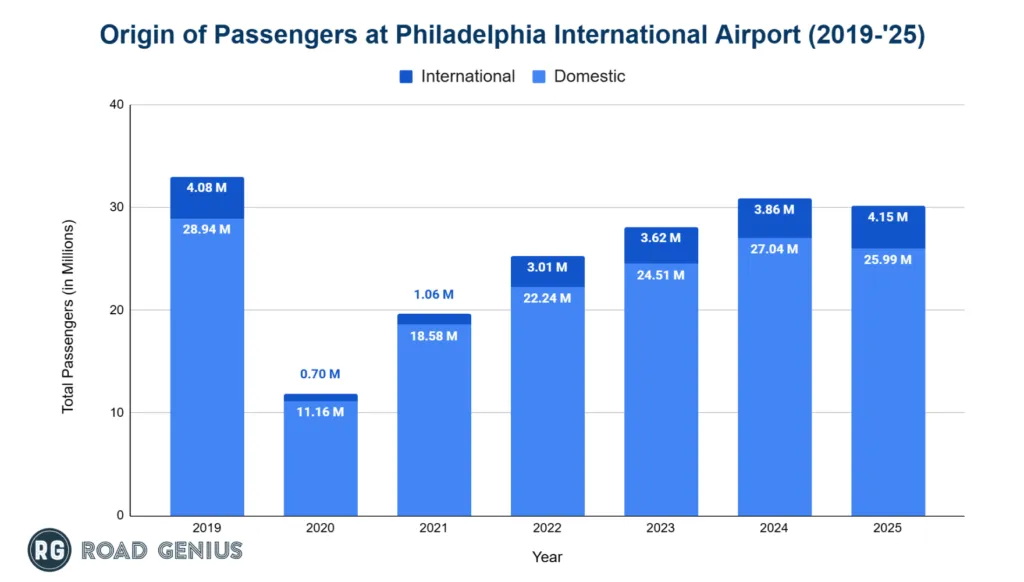
PHL’s traffic is primarily domestic, yet international travel is recovering quickly and remains a growth focus.
- Domestic passengers: 25.99 million in 2025, 86.2% of total traffic, down 3.9% year over year
- International passengers: 4.15 million in 2025, 13.8% of total traffic, up 7.5% year over year
Enplaned vs Deplaned Passengers
Arrivals and departures at PHL stay nearly even, underscoring its dual role as a connecting hub and an origin-destination airport.
- Departing (enplaned) passengers 2025: 15.19 million
- Arriving (deplaned) passengers 2025: 14.95 million
- Gap between the two: less than 0.8%
| Passenger Flow: Enplaned vs Deplaned (2019-25) | ||
|---|---|---|
| Year | Enplaned Passengers (in Millions) | Deplaned Passengers (in Millions) |
| 2019 | 16.49 | 16.53 |
| 2020 | 5.92 | 5.95 |
| 2021 | 9.85 | 9.79 |
| 2022 | 12.64 | 12.60 |
| 2023 | 14.02 | 14.11 |
| 2024 | 15.47 | 15.43 |
| 2025 | 15.19 | 14.95 |
Aircraft Operations at Philadelphia International Airport
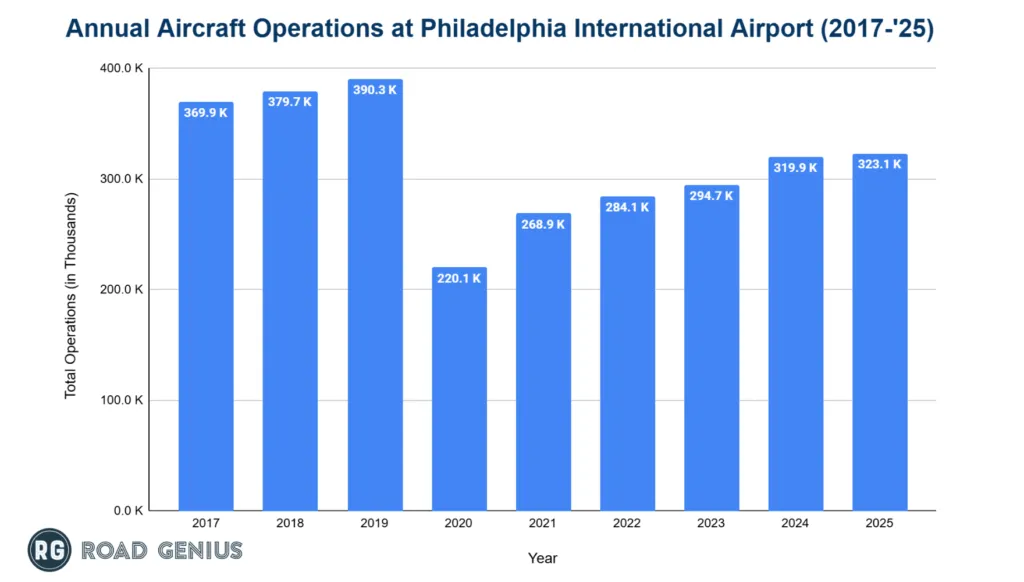
Philadelphia International Airport handles over 300,000 aircraft movements (takeoffs and landings) annually.
- PHL recorded 323,122 aircraft movements in 2025, a 1.0% increase from 319,938 in 2024.
- Operations fell to 220,123 in 2020 but have grown steadily since.
- The 2025 count equals roughly 83% of the 2019 peak of 390,321.
Aircraft Operations by Type
- Most operations at Philadelphia International Airport in 2025 were carried out by air carriers, totaling 238,578 movements.
- Additionally, air taxis made up 74,160 movements, while general aviation contributed 10,217 and military flights accounted for 167 operations.
| Aircraft Operations Type at Philadelphia International Airport (2019-2025) | ||||
|---|---|---|---|---|
| Year | Air Carrier | Air Taxi | General Aviation | Military |
| 2019 | 269,651 | 105,666 | 14,560 | 444 |
| 2020 | 162,812 | 47,750 | 9,096 | 465 |
| 2021 | 198,283 | 56,179 | 13,965 | 457 |
| 2022 | 215,574 | 53,509 | 14,468 | 590 |
| 2023 | 221,791 | 60,837 | 11,628 | 460 |
| 2024 | 240,570 | 67,476 | 11,352 | 540 |
| 2025 | 238,578 | 74,160 | 10,217 | 167 |
Which airlines operate the most flights out of Philadelphia International Airport?
The competitive landscape at Philadelphia International Airport is dominated by American Airlines as the hub carrier.
- American Airlines dominates with 19.99 million passengers in 2024 for a 64.7% market share.
- Frontier Airlines follows with 3.64 million passengers and 11.8% share.
- Delta Airlines served 1.9 million passengers (6.1%), Spirit Airlines carried 1.72 million (5.6%), and Southwest Airlines handled 1.37 million (4.4%).
| Top 5 Airlines at PHL by Passenger Volume (2024) | ||
|---|---|---|
| Airline | Passengers (in Millions) | Market Share |
| American Airlines | 19.99 | 64.7% |
| Frontier Airlines | 3.64 | 11.8% |
| Delta Airlines | 1.90 | 6.1% |
| Spirit Airlines | 1.72 | 5.6% |
| Southwest Airlines | 1.37 | 4.4% |
How many routes does Philadelphia International Airport serve?
- As of late 2024, PHL offered 125 nonstop destinations, 92 domestic and 33 international, operated by 29 airlines with nearly 440 daily departures.
Monthly Trends in Passenger Traffic at Philadelphia International Airport
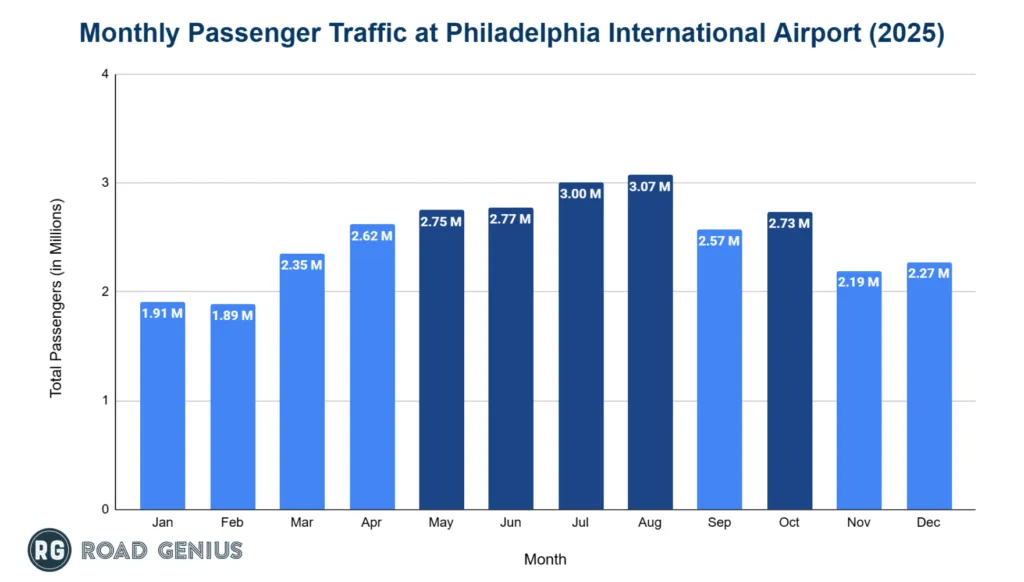
Traffic at PHL follows a classic seasonal curve.
- August led 2025 with about 3.07 million passengers, closely followed by July at 3 million.
- June recorded 2.77 million passengers, while May and October saw 2.75 million and 2.73 million passengers, respectively.
- January and February remained the quietest months with 1.91 million and 1.89 million passengers.
Which destinations are the most popular from Philadelphia International Airport?
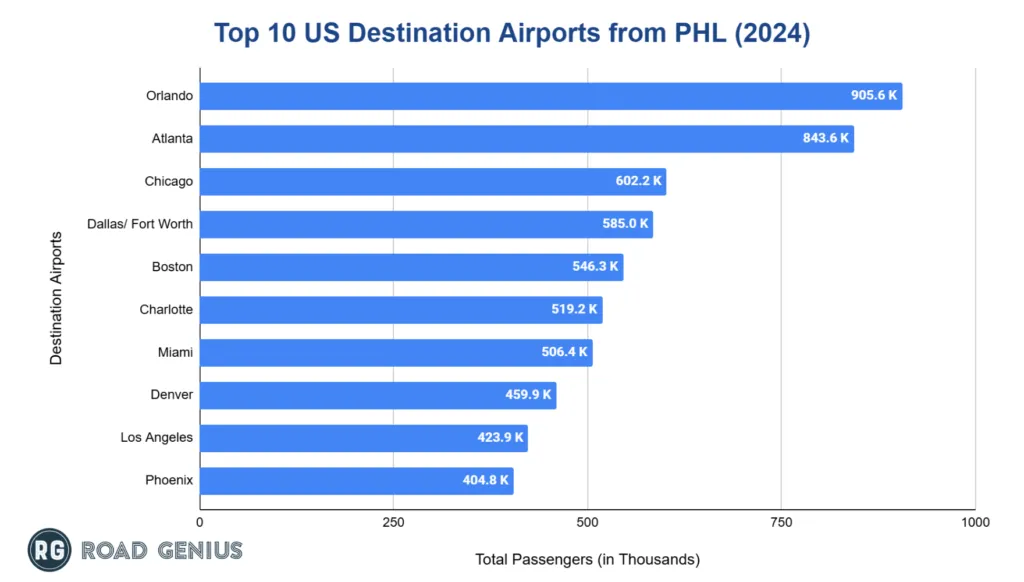
Domestic Destinations
- Orlando, Florida led domestic destinations with approximately 905,620 passengers.
- Atlanta, Georgia followed with around 843,570 passengers.
- Chicago O’Hare, Illinois ranked third with approximately 602,180 passengers.
- Dallas/ Fort Worth saw approximately 585,040 passengers, while Boston completed the top five with 546,330 travelers.
International Destinations
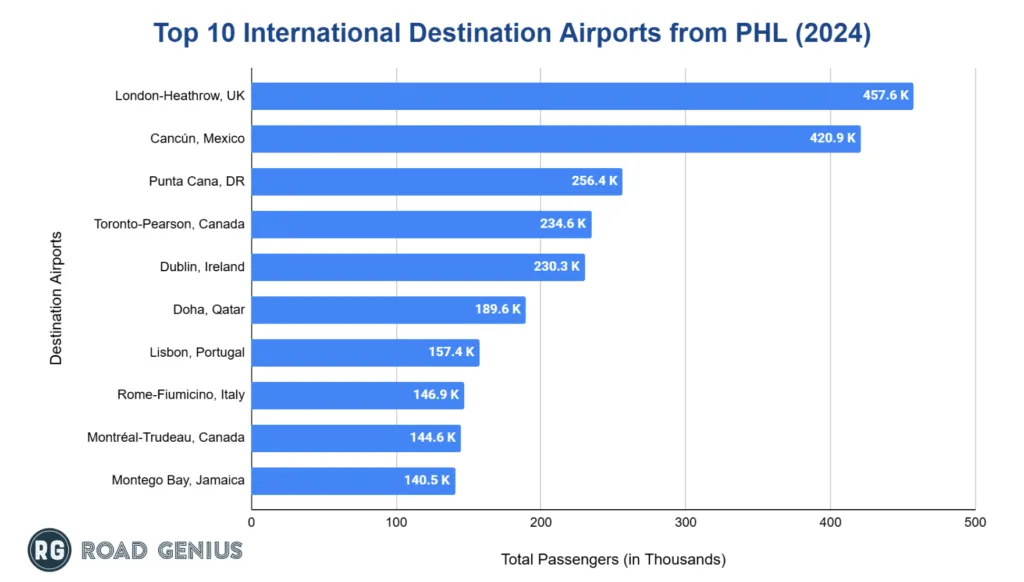
- London Heathrow, United Kingdom, dominated international traffic with 457,568 passengers.
- Cancún, Mexico ranked second with 420,902 passengers.
- Punta Cana, Dominican Republic completed the top three with 256,426 passengers.
How much cargo does Philadelphia International Airport handle annually?
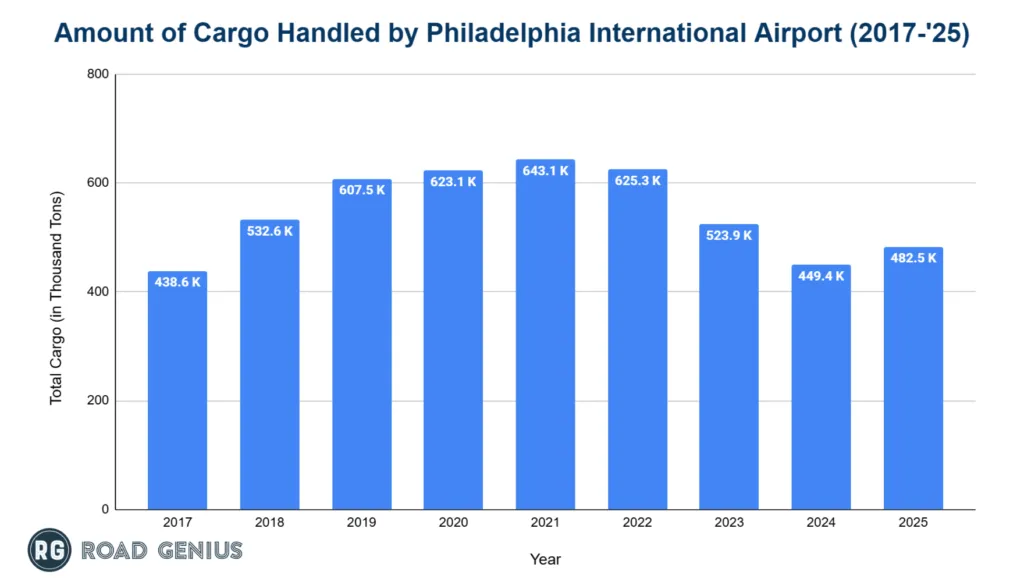
PHL handles over 600,000 tons of cargo annually, but in 2023 to 2025, the figure dropped below this threshold.
- PHL processed 482,484 tons of freight in 2025, up 7.4% from 449,443 tons in 2024.
- Cargo volumes peaked at 643,138 tons in 2021, slipped to 625,261 tons in 2022, and further to 523,915 tons in 2023.
- Pre-pandemic 2019 volume was 607,501 tons, which increased to 623,128 tons in 2020.
Delays and Cancellations at Philadelphia International Airport
- In 2024, domestic flights left on time 77% of the time compared with 79% in 2023.
- On-time arrivals slipped to 75% from 77%. The cancellation rate rose to 1.67% from 1.3%.
- Average departure delays for delayed flights lengthened to 81.70 minutes from 79.79 minutes.
- Arrival delays edged down to 82.25 minutes from 85.37 minutes.
How much revenue has Philadelphia International Airport generated each year?
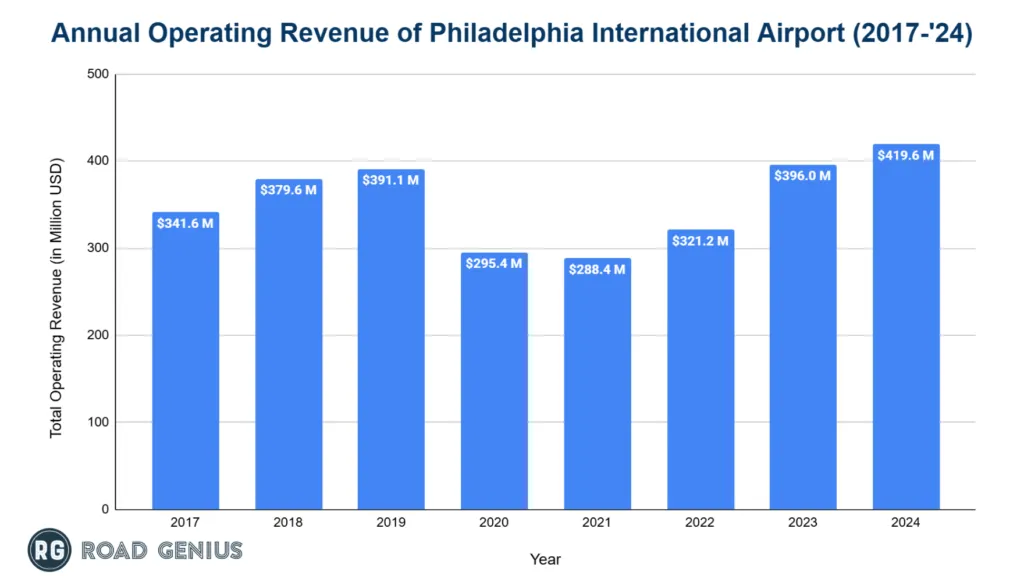
PHL generates over $350 million in operating revenue annually.
- The Aviation Fund, which runs PHL without local tax support, reported $419.6 million in operating revenue for fiscal 2024, up 6% from $396 million in 2023.
- Revenue stood at $391.1 million in 2019, fell to $295.4 million in 2020 and $288.4 million in 2021, then climbed to $321.2 million in 2022.
More Statistics
- Atlantic City International Airport Statistics
- Hollywood Burbank Airport (BUR) Statistics
- Des Moines International Airport Statistics
- Hilton Head Island Airport (HHH) Statistics
- Houston Hobby Airport Statistics
- Idaho Falls Regional Airport Statistics
- Montrose Regional Airport (MTJ) Statistics
- OKC Will Rogers Airport Statistics
- Phoenix Sky Harbor Airport Statistics
- Richmond International Airport Statistics
- San Antonio International Airport Statistics
- Santa Barbara Municipal Airport Statistics
Major Incidents at Philadelphia International Airport
- July 19 1970: United Airlines Flight 611 aborted takeoff after an engine failure, overran the runway and injured 19 of 61 people. No fatalities.
- June 23 1976: Allegheny Airlines Flight 121 crash-landed during a thunderstorm, injuring 86 of 106 passengers. No deaths.
- February 7 2006: A UPS DC-8 landed after an in-flight fire. No major injuries, aircraft lost.
- March 13 2014: US Airways Flight 1702 aborted takeoff, struck its tail and veered off the runway. No serious injuries, aircraft scrapped.
- April 17 2018: Southwest Flight 1380 suffered an engine failure, leading to one fatality and seven injuries.
References
- Philadelphia International Airport — passenger, operation, cargo and financial data reports · phl.org
- International Destinations of Passengers from Raleigh-Durham International Airport · data.transportation.gov
- BTS TranStats — Airport profiles (route information by airport) · transtats.bts.gov
- Incidents at Jackson–Medgar Wiley Evers International Airport — NTSB · ntsb.gov

