

 Popular Countries
 24/7 Support
Published Sep 9, 2026
Montrose Regional Airport (MTJ) serves Colorado’s Western Slope and connects Montrose with major United States hub airports. The airport supports year-round travel, with demand shaped by winter ski trips and summer mountain tourism.
How many passenger enplanements take place at Montrose Regional Airport each year?
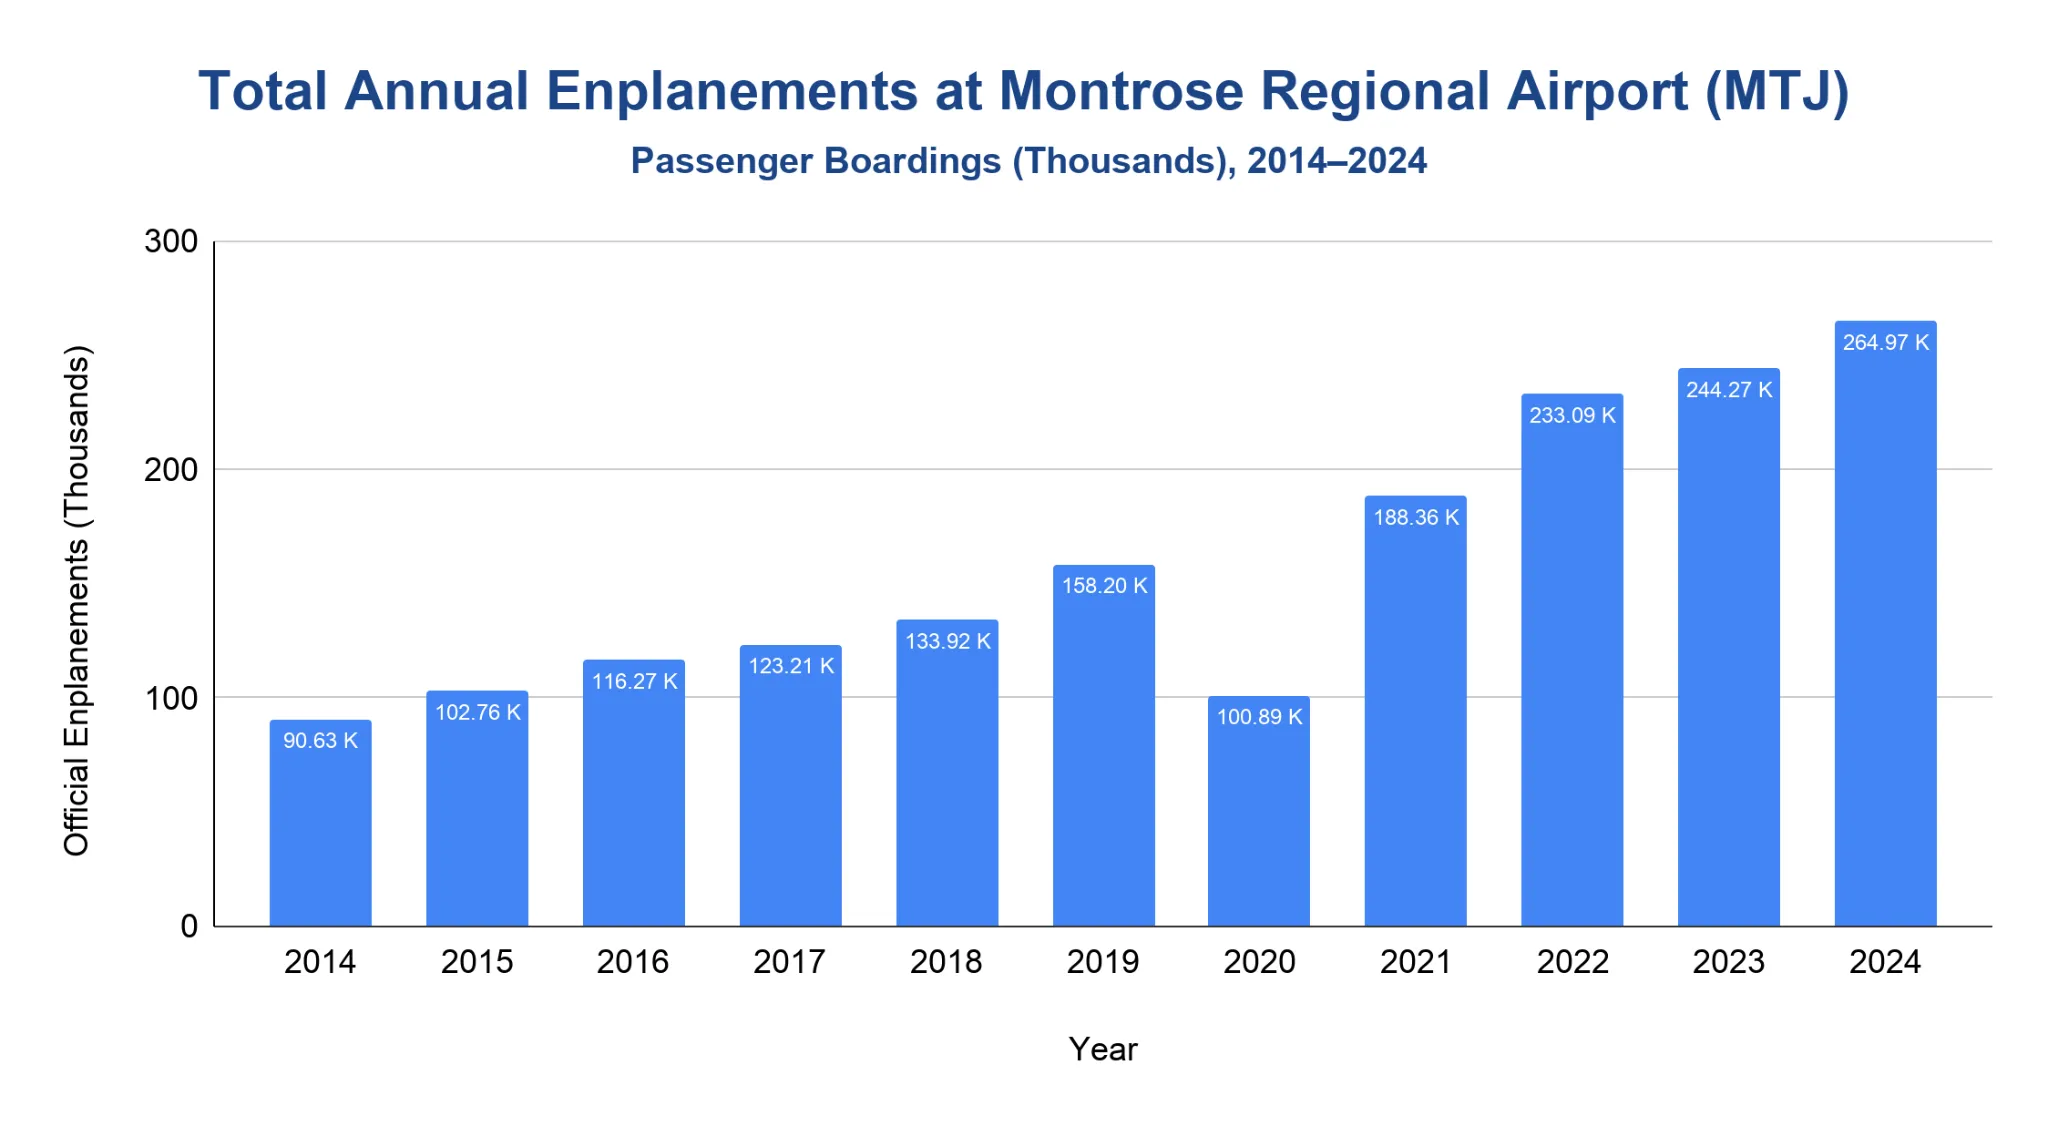
MTJ recorded 264,973 passenger boardings in 2024, its highest level in the Federal Aviation Administration (FAA) enplanement series.
- From 2014 to 2018, official enplanements rose from 90,630 to 133,924.
- Pre-pandemic traffic reached 158,198 enplanements in 2019.
- Pandemic-year traffic fell to 100,887 enplanements in 2020, down 36.2% from 2019.
- The rebound was sharp in 2021, when enplanements climbed 86.7% to 188,355.
- Volumes continued rising through 2022, 2023, and 2024, reaching 233,094, 244,266, and 264,973 enplanements.
Note: FAA publishes passenger boardings, also called enplanements, which count departing passengers only. Percentage changes and shares in this article are calculated from raw source values; table values are standardized to thousands or US$ millions and rounded to 2 decimal places for readability unless otherwise noted.
Does Montrose Regional Airport handle domestic or international flights?
MTJ’s published nonstop schedules for 2025-2026 and summer 2026 list only United States domestic destinations.
- The official winter schedule lists nonstop service to United States cities including Atlanta, Austin, Chicago, Dallas/Fort Worth, Dallas Love Field, Denver, Houston, Los Angeles, Orange County, Nashville, Newark, San Francisco, and Telluride.
- The official summer schedule lists nonstop service to Chicago, Dallas/Fort Worth, Dallas Love Field, Denver, Houston, Los Angeles, and Telluride.
- Scheduled service connects MTJ with major United States hubs, giving passengers onward domestic and international connections through larger airports.
- Service remains seasonal on several routes, with winter ski demand and summer mountain travel shaping the published schedule.
Note: This section describes published scheduled nonstop service and does not cover private general aviation or unscheduled operations.
Which airlines carry the most passengers at Montrose Regional Airport?
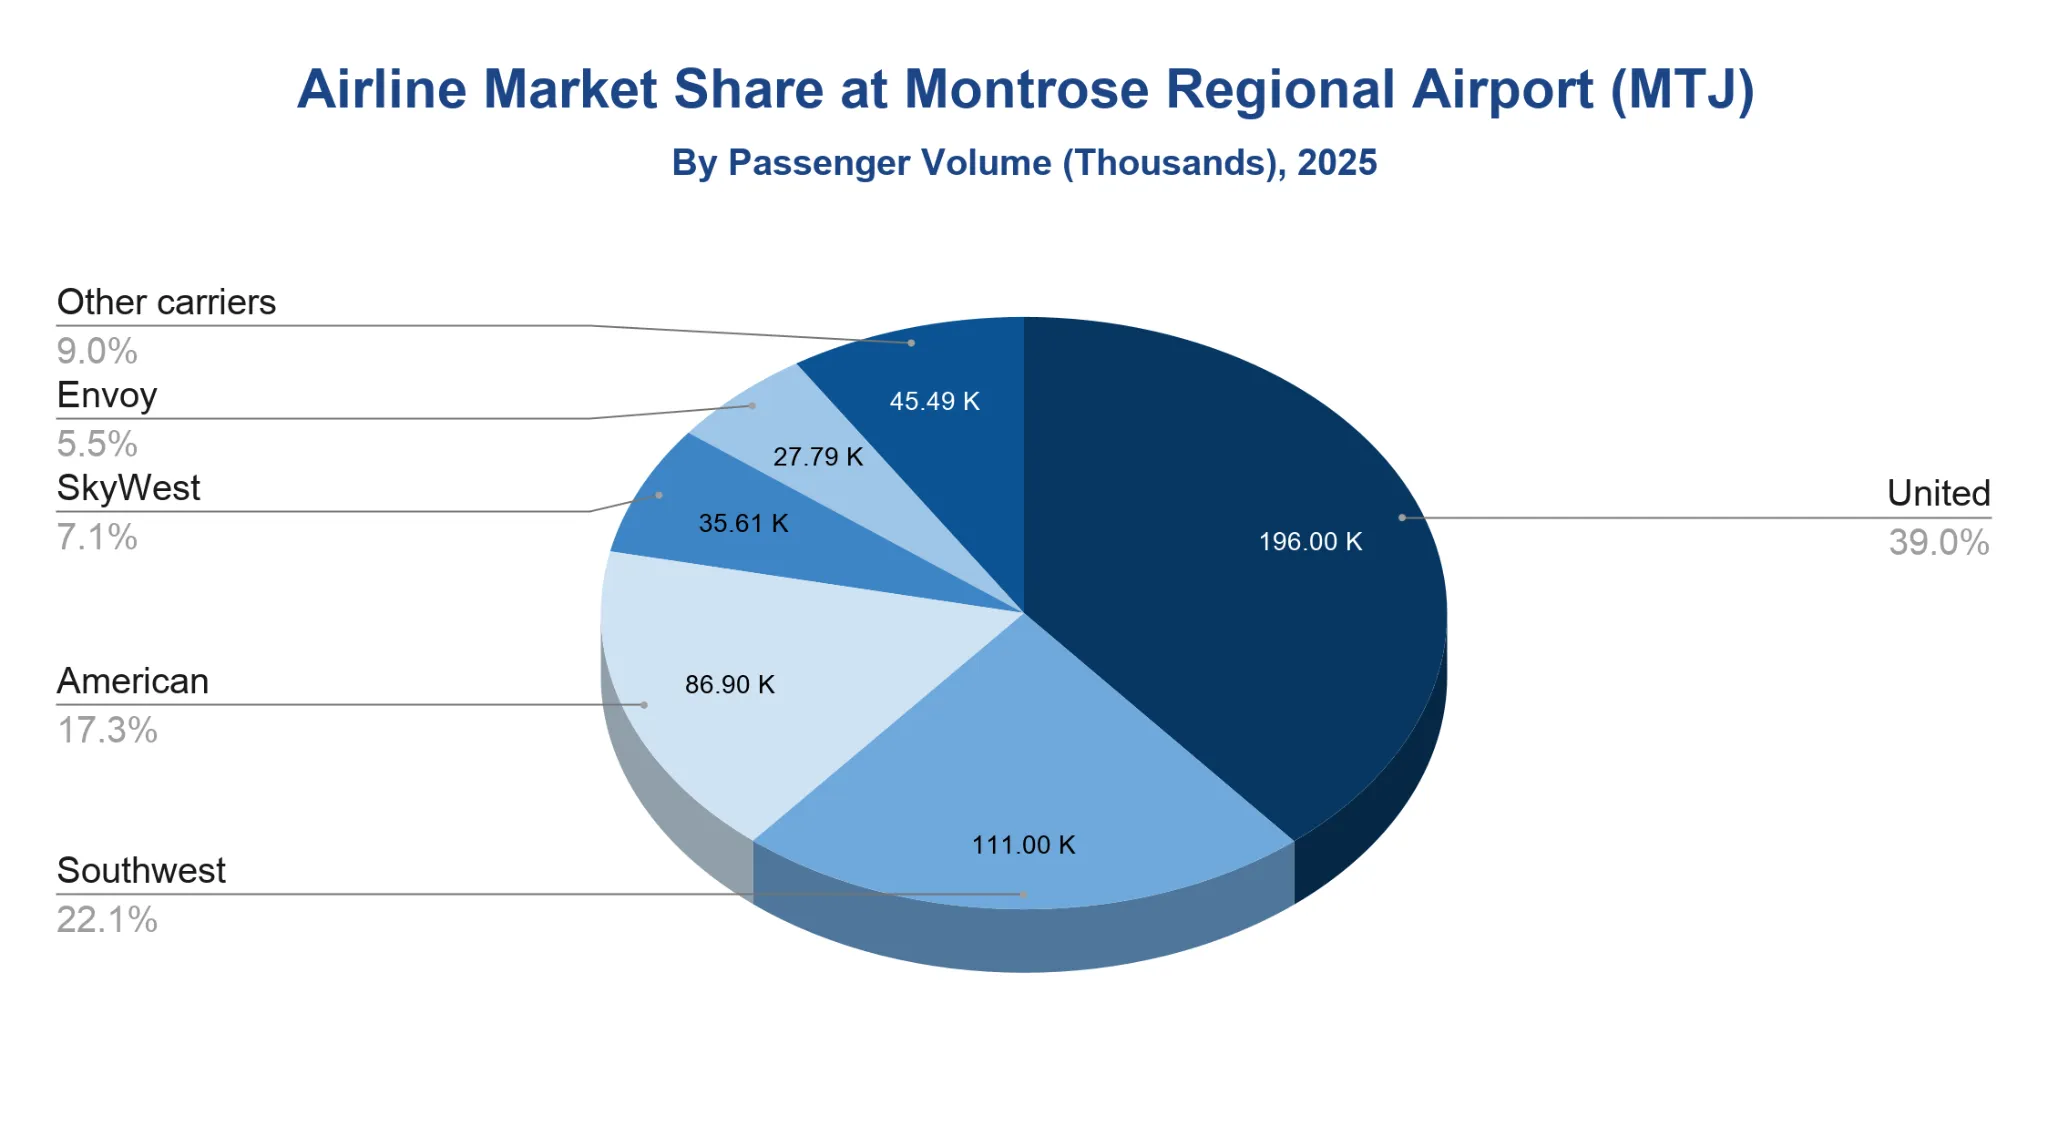
United led MTJ’s carrier market in 2025, with about 196 thousand passengers and a 38.95% share.
- Southwest Airlines ranked second with 111 thousand passengers, or 22.07% of the market.
- American Airlines followed with 86.9 thousand passengers and a 17.3% share.
- Regional operators SkyWest Airlines and Envoy Air accounted for another 63.4 thousand passengers combined.
- The top three carriers together represented 78.32% of MTJ’s reported passenger market.
- Other carriers handled 45.49 thousand passengers, or 9.06% of the total.
Note: Bureau of Transportation Statistics (BTS) carrier data reports passenger market share, not flight counts. Regional operating carriers may appear separately from the mainline brands passengers see on tickets.
What are the most popular destinations from Montrose Regional Airport?
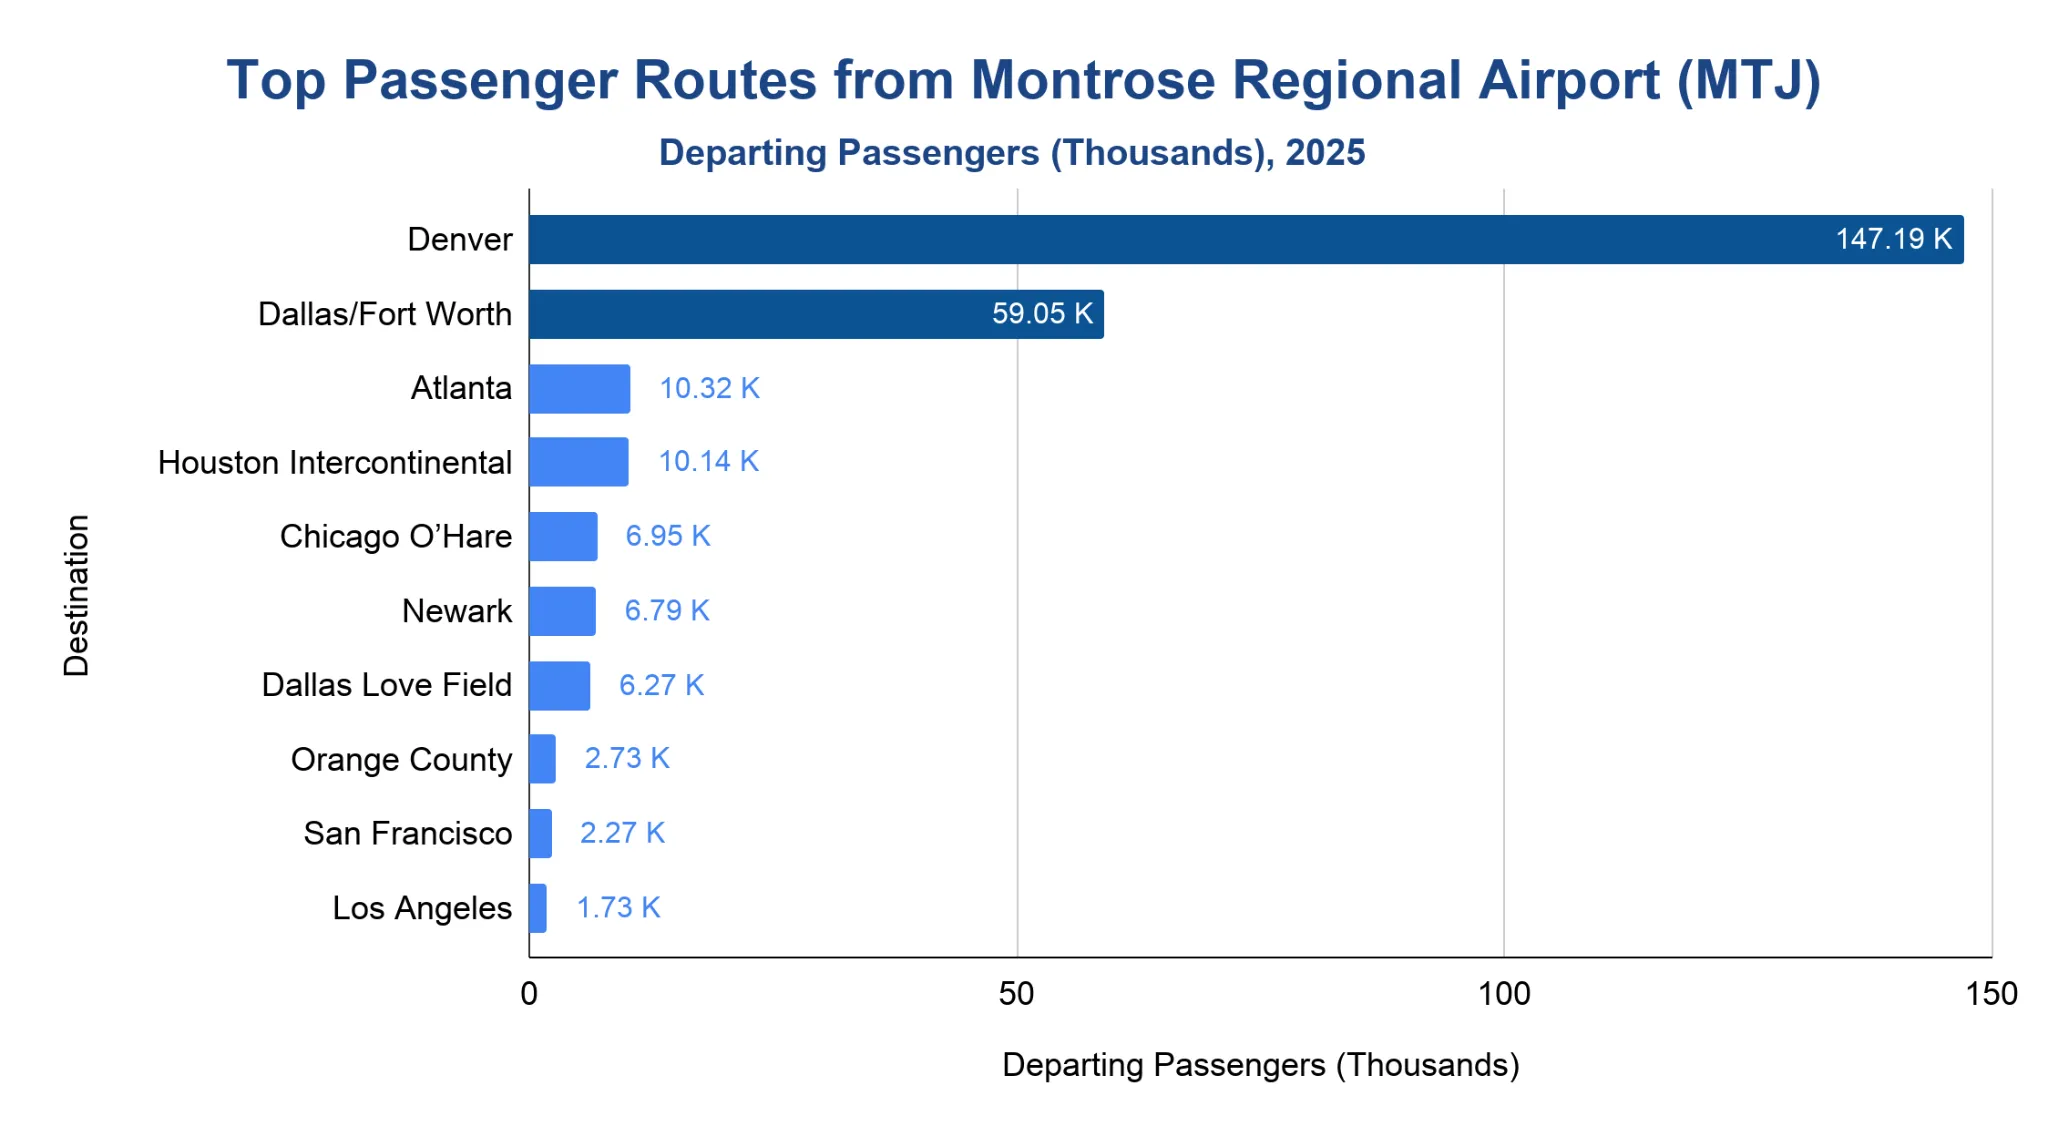
Denver was MTJ’s largest destination market in 2025, with 147.19 thousand departing passengers.
- Dallas/Fort Worth ranked second with 59.05 thousand departing passengers.
- Denver and Dallas/Fort Worth together accounted for about 81.1% of MTJ’s total originating passenger traffic in 2025.
- Atlanta and Houston Intercontinental formed the next tier, each just above 10 thousand departing passengers.
- Chicago O’Hare, Newark, and Dallas Love Field each handled between 6 thousand and 7 thousand departing passengers.
- Smaller seasonal markets included Orange County, San Francisco, and Los Angeles.
Note: BTS T-100 route data in this section reflects passengers originating at MTJ, so the figures are departing passengers rather than total two-way route traffic.
Peak Travel Months at Montrose Regional Airport
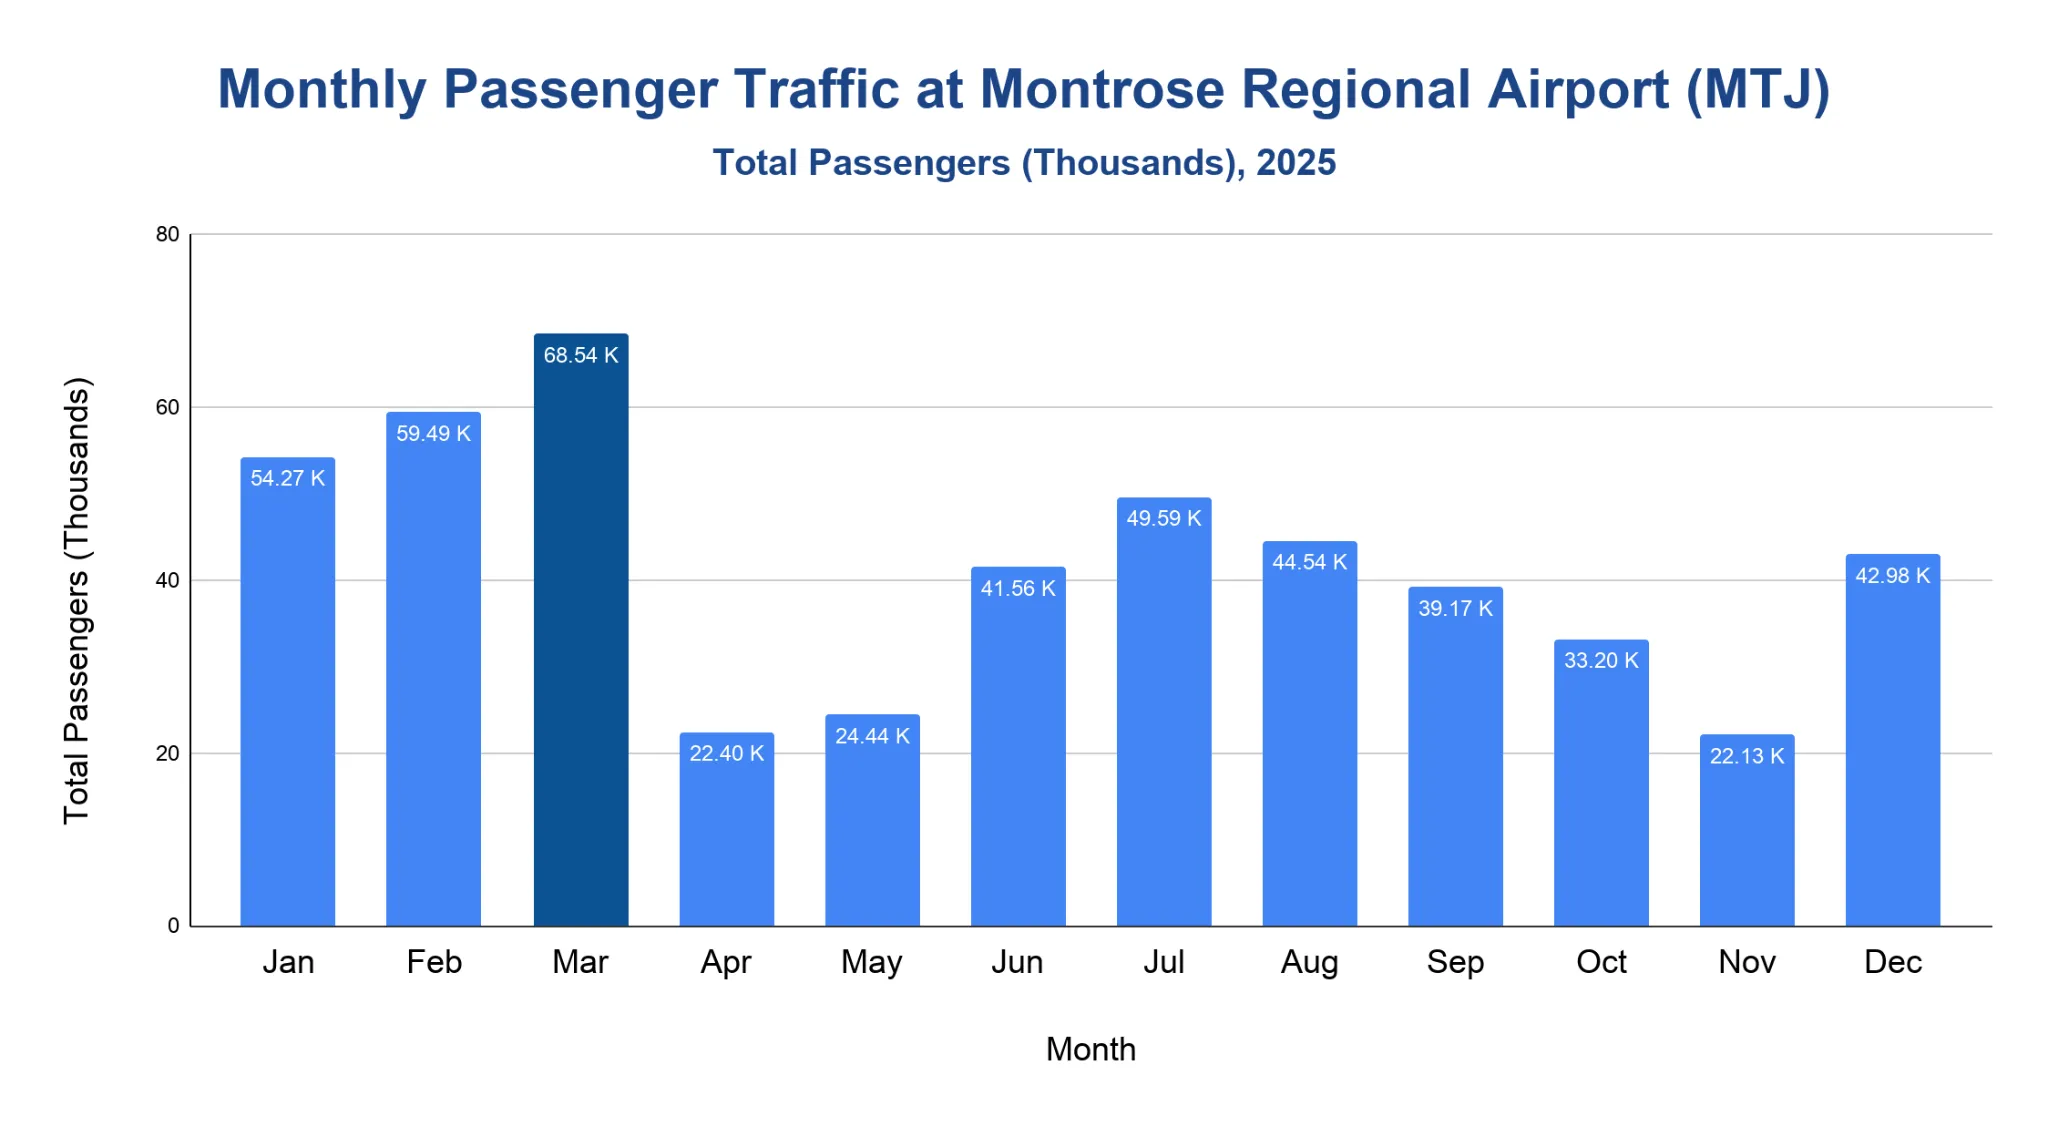
March was MTJ’s busiest month in 2025, with 68.54 thousand total passengers.
- Winter and early-spring ski travel drove the strongest months, with February at 59.49 thousand passengers and January at 54.27 thousand.
- July was the busiest summer month, with 49.59 thousand passengers, followed by August at 44.54 thousand.
- The December holiday period added another winter peak, with 42.98 thousand passengers.
- Shoulder-season demand was lowest in April, May, and November, each below 25 thousand passengers.
- The winter-heavy months of January, February, March, and December together handled 225.28 thousand passengers, or 44.9% of annual traffic.
Note: Calculated total passengers equal BTS T-100 Market origin passengers plus destination passengers for each month.
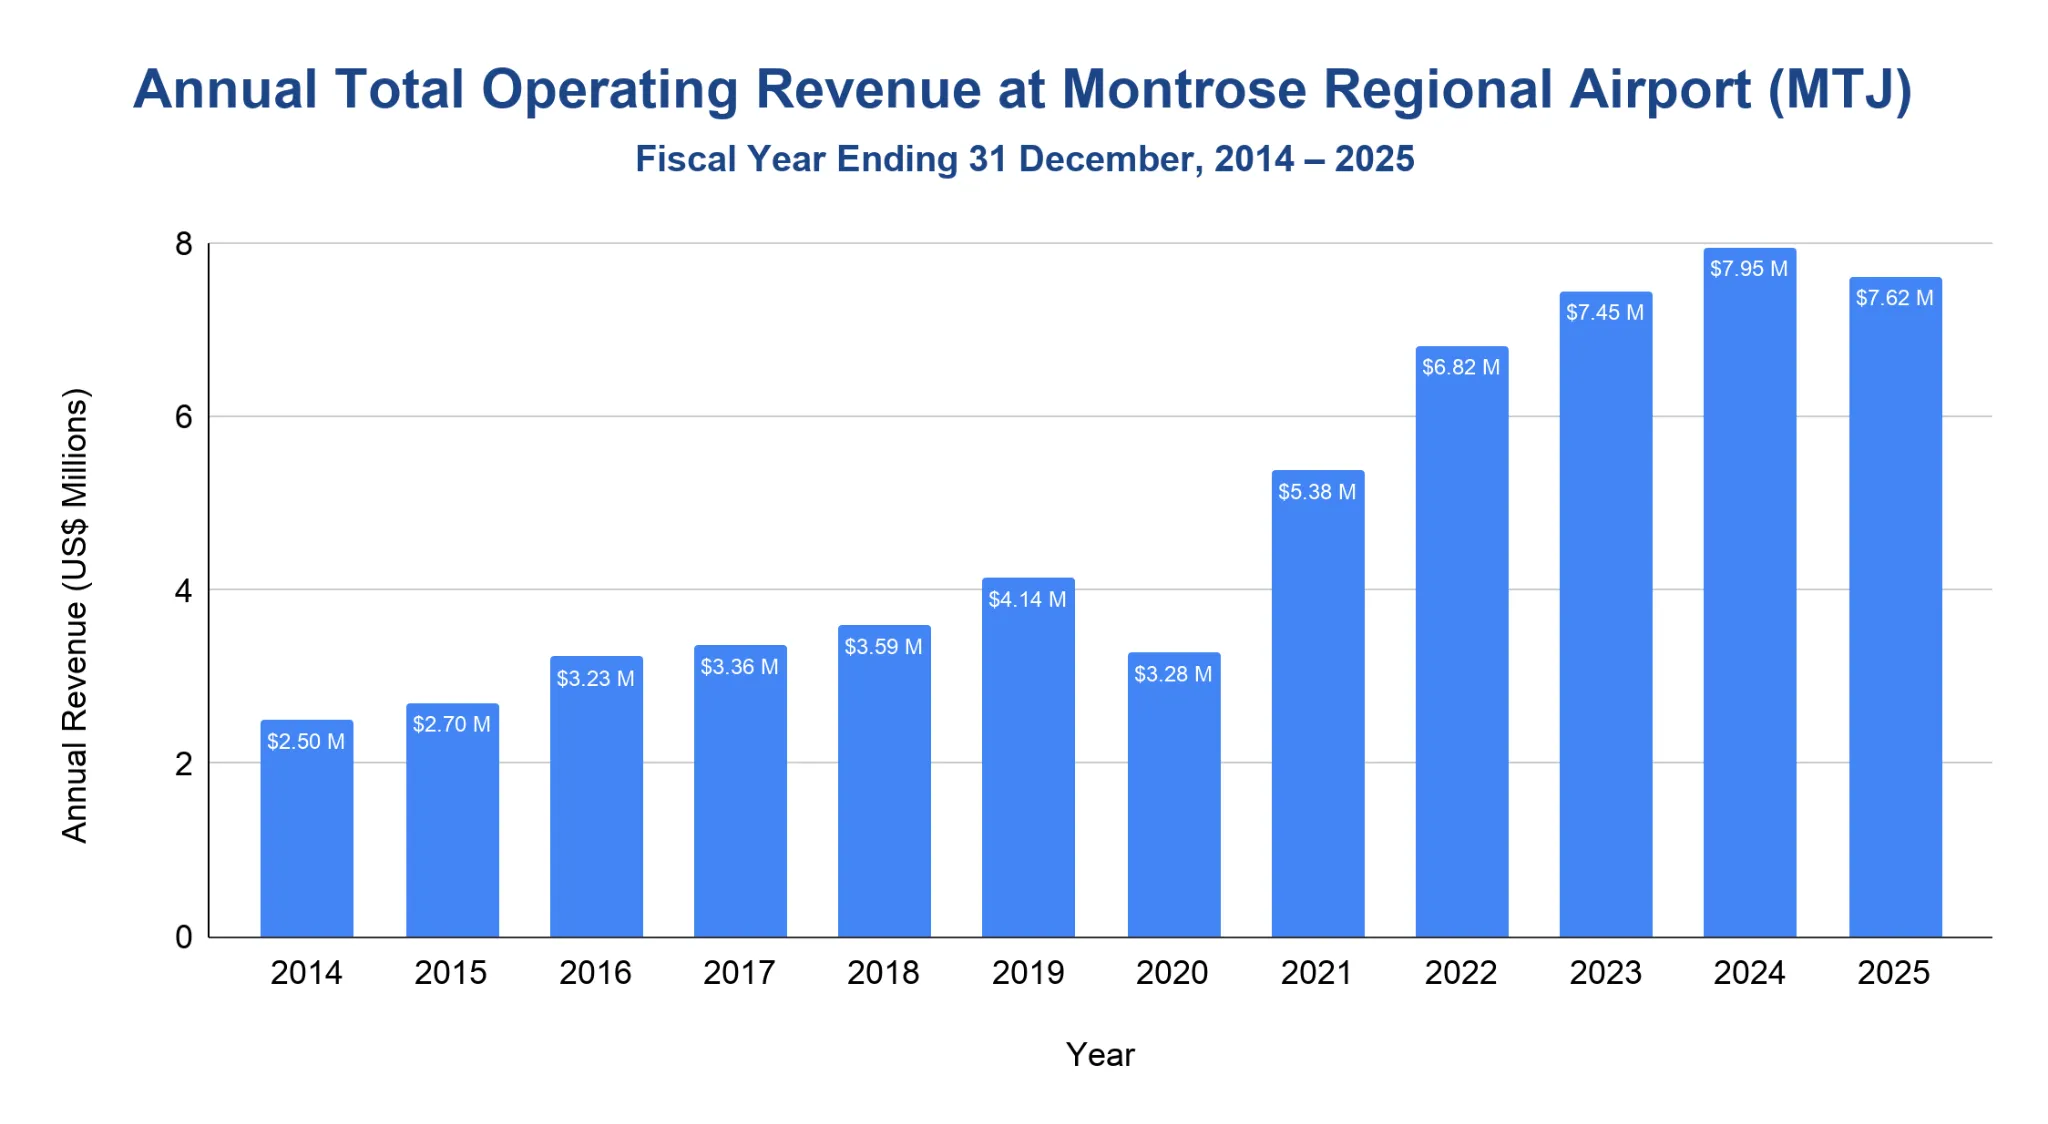
How much revenue does Montrose Regional Airport generate each year?
MTJ reported $7.62 million in total operating revenue in 2025.
- From 2014 to 2018, total operating revenue rose from $2.5 million to $3.59 million.
- Pre-pandemic revenue reached $4.14 million in 2019 before falling to $3.28 million in 2020.
- Revenue rebounded strongly in 2021, climbing to $5.38 million as passenger traffic recovered.
- Growth continued through 2022, 2023, and 2024, when revenue reached a high of $7.95 million.
- The 2025 figure was 4.2% below 2024, but still about 3.1x the 2014 level.
Note: Figures are total operating revenue reported in FAA Certification Activity Tracking System (CATS) Form 127 for fiscal years ending 31 December.
Montrose Regional Airport’s On-time Performance
MTJ’s major-carrier flights were 75% on time for arrivals and 74% on time for departures in the 2026* reporting period.
- The airport’s strongest post-2021 year was 2024, when both departures and arrivals were 79% on time.
- Departure on-time performance moved from 80% in 2021 to 75% in 2025, then 74% in the latest reporting period.
- Arrival on-time performance stayed slightly stronger, holding at 77% in 2025 before moving to 75% in the latest period.
- Average delay among delayed flights reached 111.56 minutes for departures and 69 minutes for arrivals in the latest period.
- Cancellations improved steadily, falling from 3.82% in 2021 to 0.72% in the latest reporting period.
| Metric | 2021 | 2022 | 2023 | 2024 | 2025 | 2026* |
|---|---|---|---|---|---|---|
| Departure on-time rate | 80% | 77% | 77% | 79% | 75% | 74% |
| Arrival on-time rate | 80% | 76% | 77% | 79% | 77% | 75% |
| Average departure delay (min.) | 100.82 | 73.64 | 83.79 | 81.23 | 101.78 | 111.56 |
| Average arrival delay (min.) | 63.04 | 57.76 | 55.64 | 62.39 | 63.25 | 69.00 |
| Cancellation rate | 3.82% | 2.90% | 1.67% | 0.95% | 0.79% | 0.72% |
| Total flights (thousands) | 3.14 | 3.04 | 2.69 | 2.86 | 2.42 | 1.39 |
| Reporting carriers | 9 | 7 | 6 | 6 | 6 | 6 |
Source · Note: A flight is counted as delayed when it arrives or departs 15 minutes or more later than scheduled. Average delay values are calculated from delayed flights only and kept in BTS decimal-minute format. The 2026* period covers May 2025 through April 2026.
Related Travel Statistics
- Lehigh Valley International Airport Statistics
- Buffalo Airport (BUF) Statistics
- Colorado Springs Airport Statistics
- Eugene Airport (EUG) Statistics
- Fresno Yosemite International Airport Statistics
- Harrisburg Airport (MDT) Statistics
- JFK Airport Statistics
- Midway International Airport Statistics
- Pensacola International Airport Statistics
- Philadelphia International Airport Statistics
- Reno-Tahoe International Airport Statistics
- Palm Beach Airport (PBI) Statistics
How does Montrose Regional Airport rank globally and nationally?
MTJ ranked 182nd among United States commercial-service airports by 2024 FAA passenger boardings.
- The FAA listed MTJ as a primary non-hub commercial-service airport in the 2024 table.
- MTJ recorded 264,973 passenger boardings in 2024, up 8.5% from 244,266 in 2023.
- Within Colorado, MTJ ranked behind Denver International, Colorado Springs, Aspen/Pitkin County, Eagle County, and Grand Junction by 2024 passenger boardings.
- MTJ ranked slightly ahead of Durango-La Plata County, which recorded 250,640 passenger boardings in 2024.
- National ranking should be read as an FAA enplanement ranking, not a global passenger-traffic ranking.
Note: FAA commercial-service rankings are based on passenger boardings, also called enplanements, not total passengers.
References
- Montrose Regional Airport — Official Airport Website · montroseairport.com
- FAA Passenger Boarding and All-Cargo Data Master · faa.gov
- BTS Airline, Destination, Monthly Passenger, and On-Time Data (2021–2026) · transtats.bts.gov
- FAA CATS — Form 127 Operating and Financial Summary (FY2014–FY2025) · cats.airports.faa.gov

