

 Popular Countries
 24/7 Support
Published Mar 29, 2026
Chicago Midway International Airport (MDW) is a major domestic hub and the largest base for Southwest Airlines in the United States.
How many passengers pass through Midway International Airport each year?
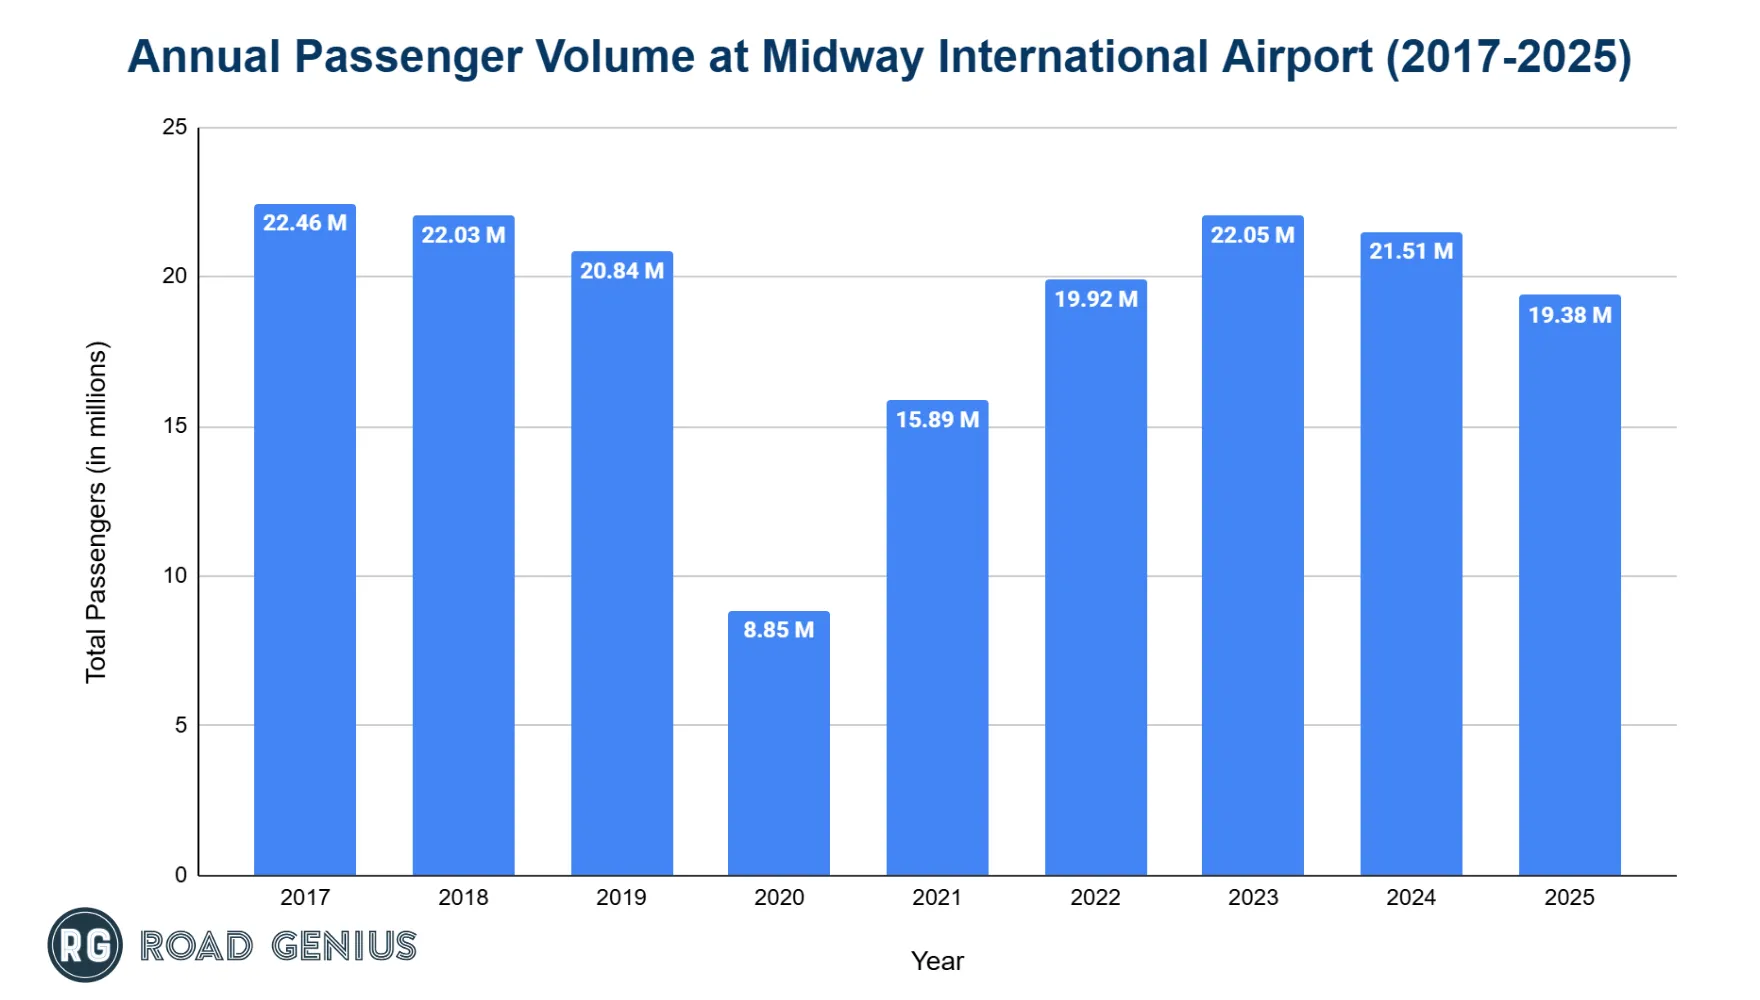
Chicago Midway serves about 20 million passengers a year and has rebounded well after the pandemic.
- The airport welcomed 19.38 million travelers in 2025, a 9.9% drop from 2024 yet still close to its long-term average.
- The 21.51 million passengers in 2024 represented a 2.4% drop from 2023’s 22.05 million.
- The 22.05 million passengers in 2023 represented a 10.7% jump from 2022’s 19.92 million and stood 5.8% above the 2019 pre-pandemic peak of 20.84 million.
- Traffic fell to 8.85 million in 2020 before recovering to 15.89 million in 2021.
International Passenger vs Domestic Passengers
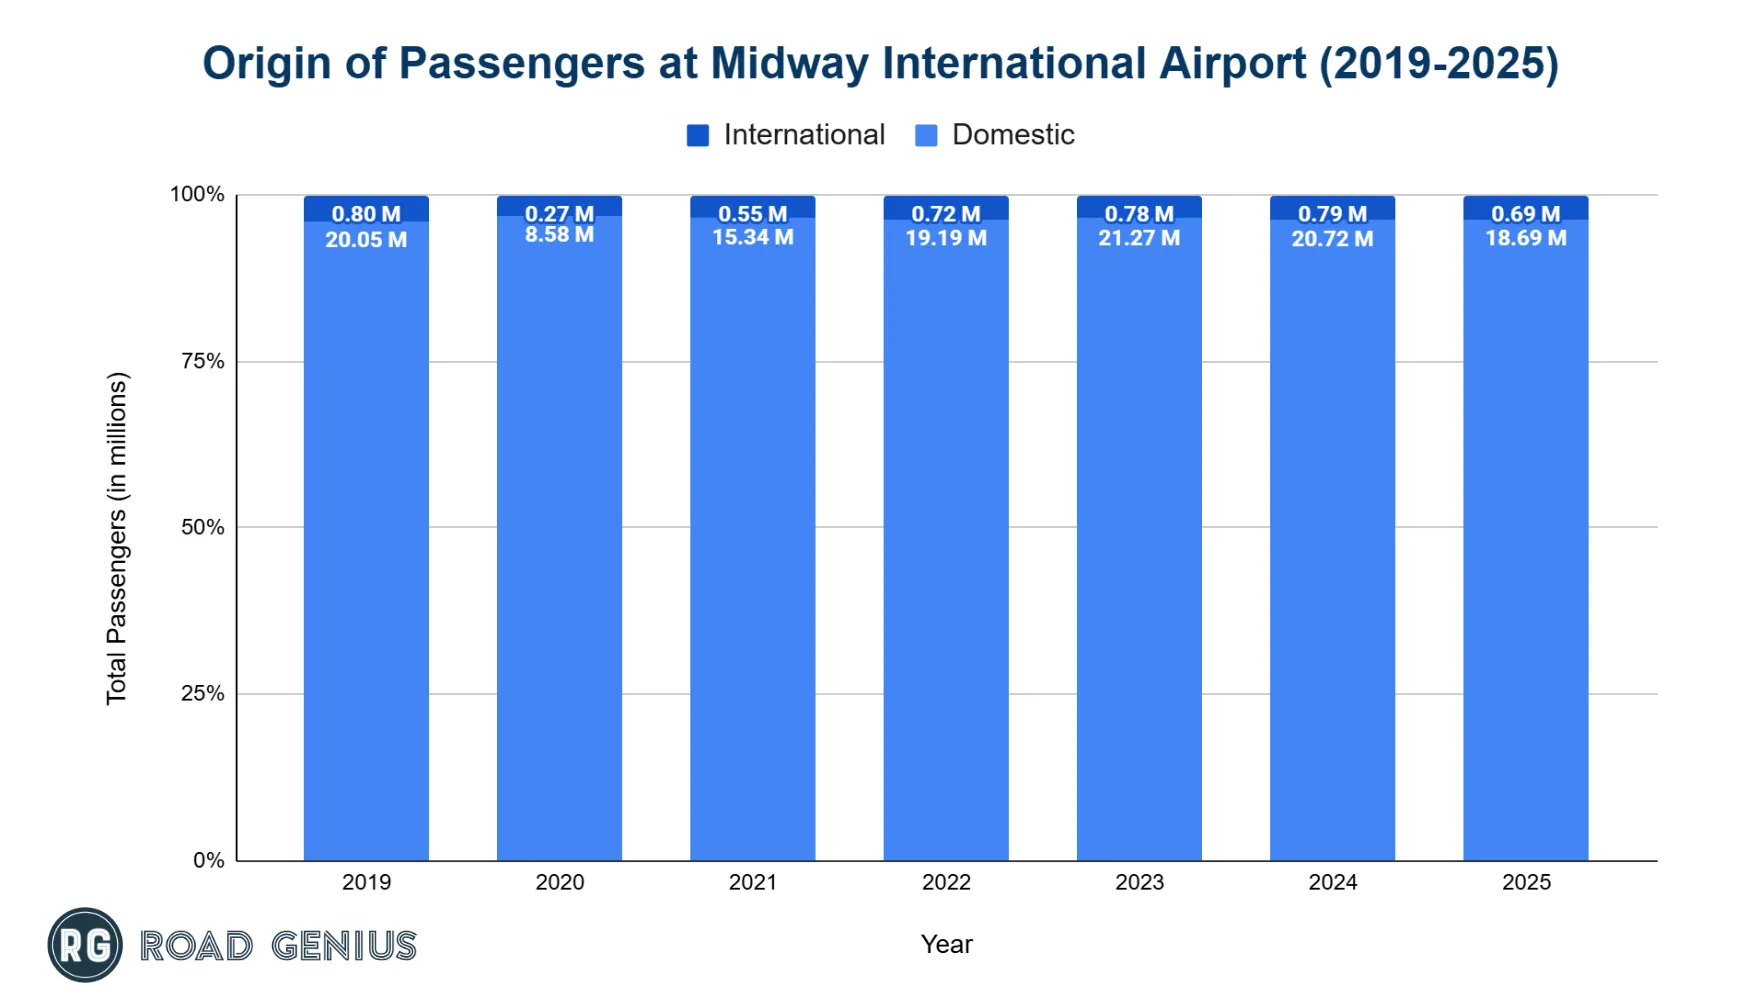
Midway’s traffic mix is heavily domestic.
- In 2025, domestic routes carried about 18.69 million people, 96.4% of the total.
- International services moved roughly 688,222 travelers, just 3.6% of overall traffic.
Aircraft Operations at Midway International Airport
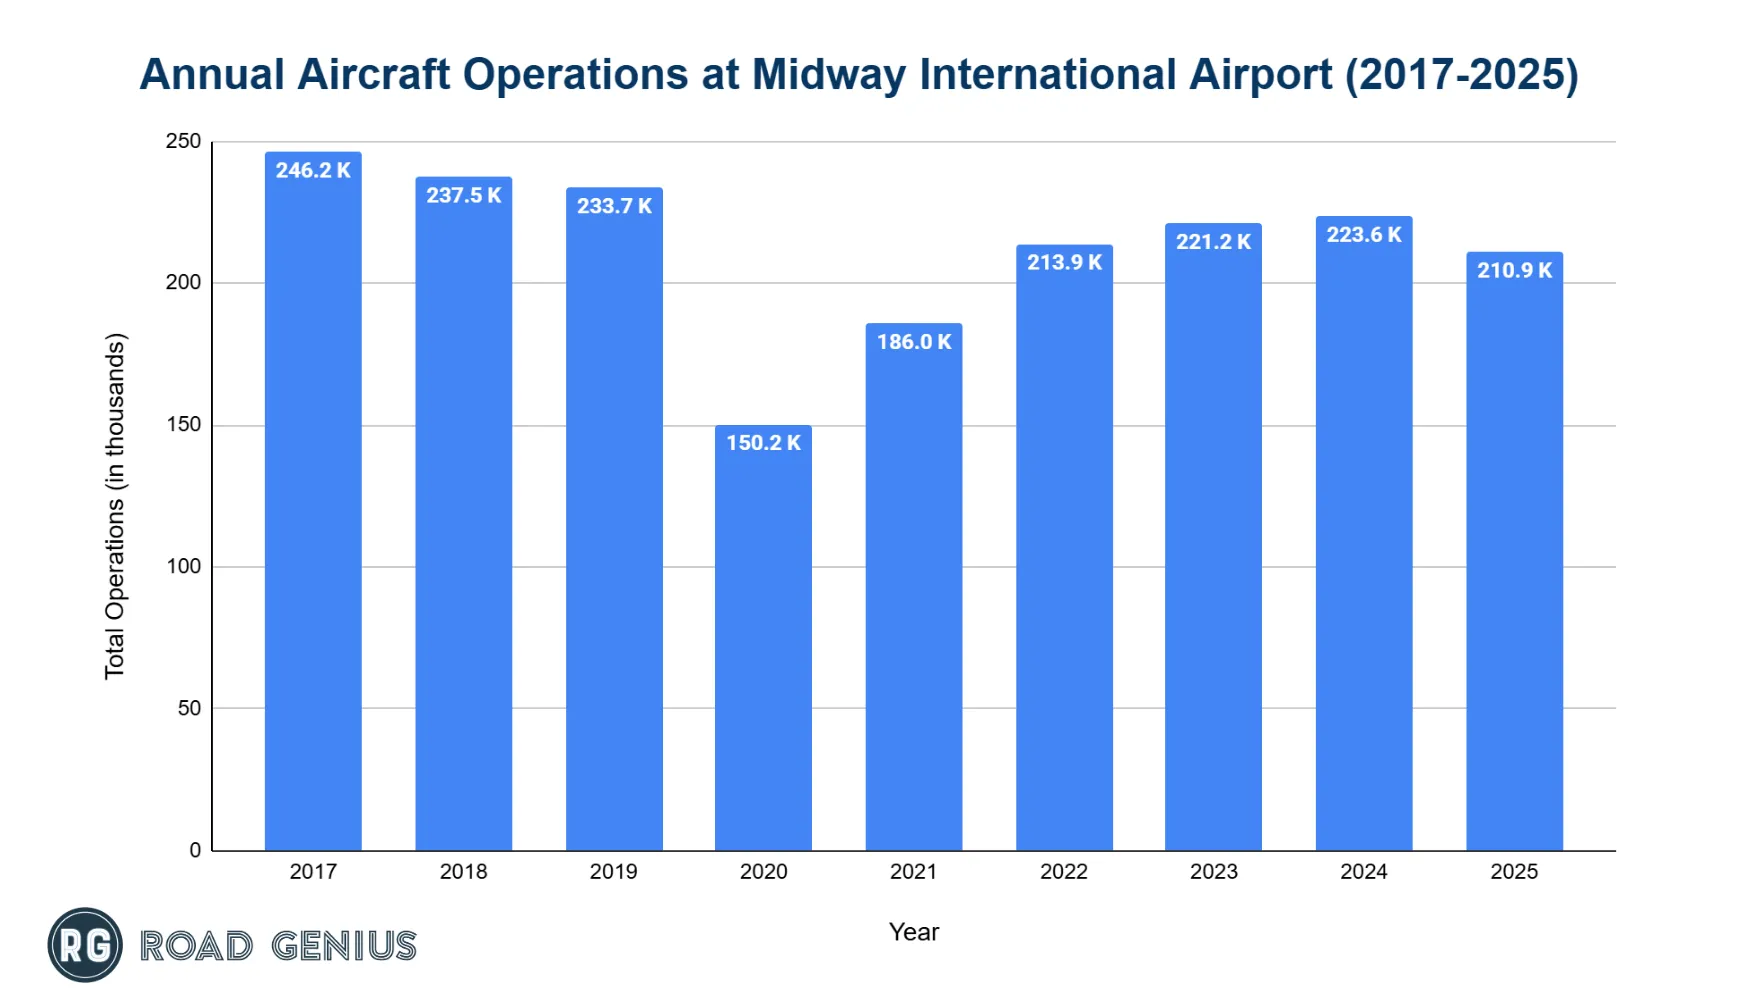
Midway International Airport records over 200,000 aircraft movements each year, including takeoffs and landings.
- The airport logged 210,930 takeoffs and landings in 2025, down 5.7% from 223,637 in 2024.
- Before the pandemic, the airport recorded 233,707 aircraft operations.
- After dropping to 150,198 in 2020, activity climbed to 185,956 in 2021 then 213,854 in 2022.
- The 2025 figure equals about 83% of the 2016 high of 253 046.
Aircraft Operations by Type
- Midway International Airport saw 153,259 operations by air carriers in 2025, dominating overall activity.
- General aviation accounted for 51,186 movements, reflecting steady private and non-commercial use.
- An additional 6,485 operations came from other miscellaneous categories.
| Aircraft Operations at Midway International Airport by Type (2019-2025) | |||
|---|---|---|---|
| Year | Air Carrier | General Aviation | Miscellaneous |
| 2019 | 171,256 | 56,258 | 4,570 |
| 2020 | 112,756 | 30,896 | 6,546 |
| 2021 | 130,668 | 49,058 | 6,230 |
| 2022 | 155,936 | 53,692 | 4,799 |
| 2023 | 175,422 | 50,958 | 6,015 |
| 2024 | 164,974 | 50,804 | 7,859 |
| 2025 | 153,259 | 51,186 | 6,485 |
Source · Chicago Department of Aviation, Air Traffic Data
Which airlines operate the most flights out of Midway International Airport?
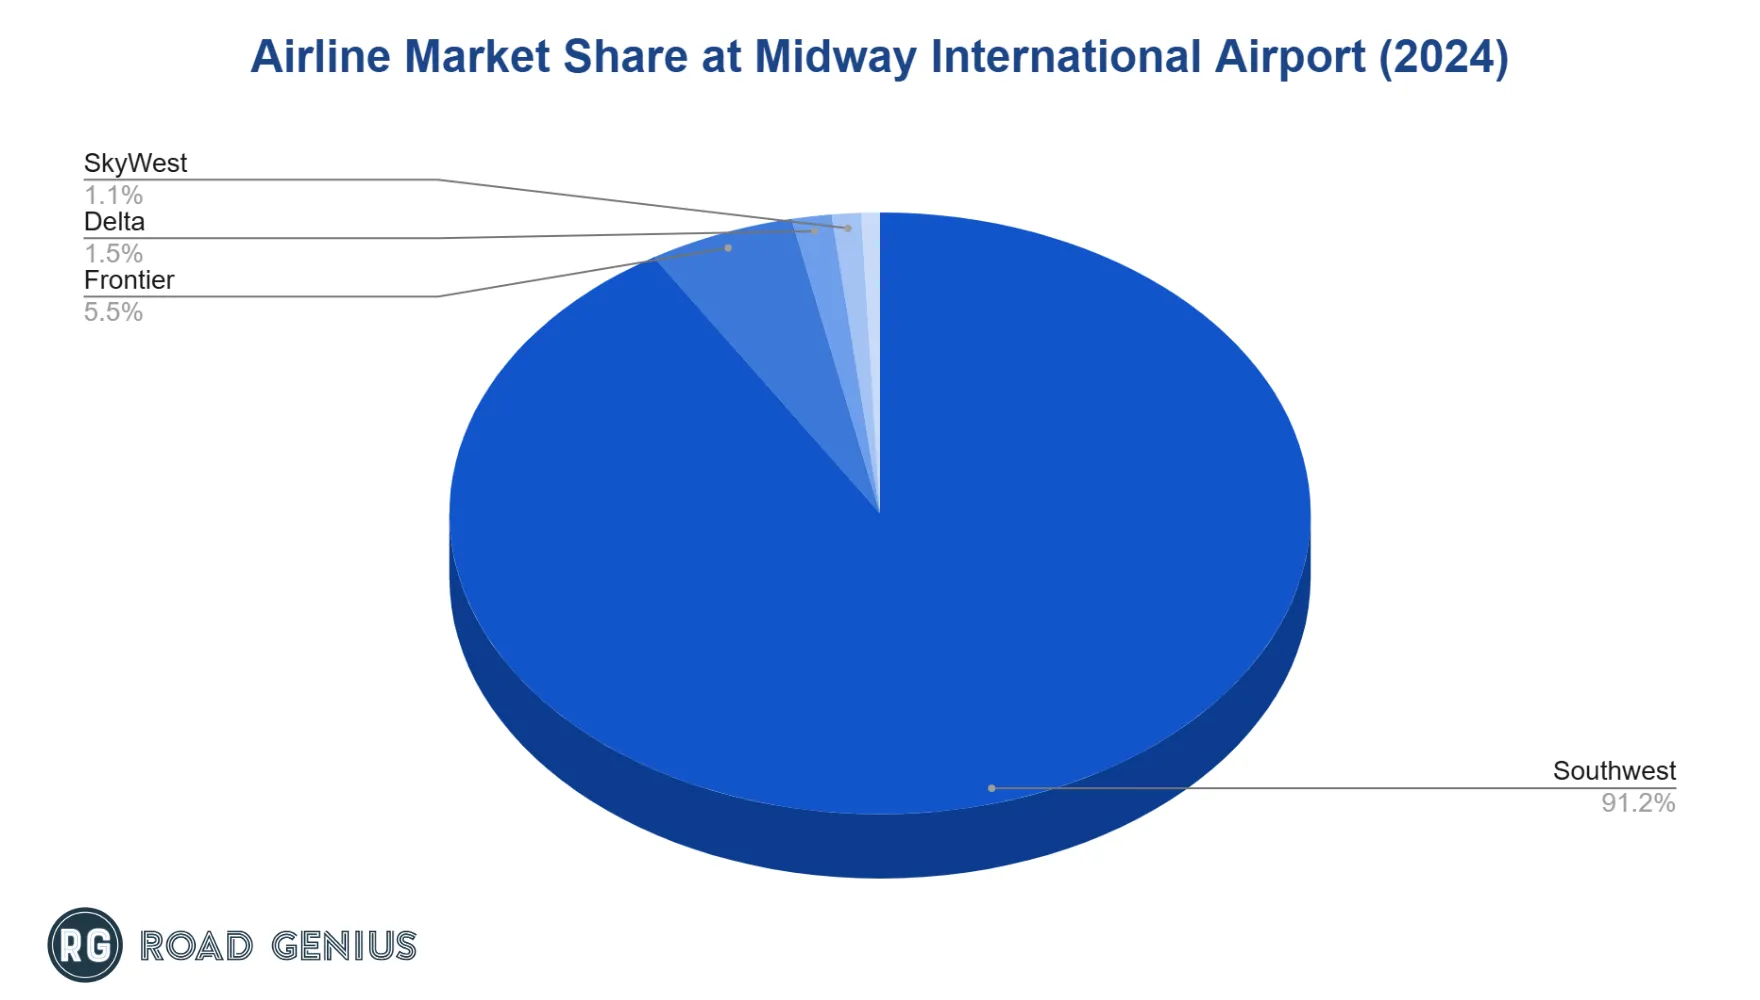
Midway is effectively a one-carrier airport.
- Southwest Airlines held a 91.2% share of domestic passengers in 2024.
- Frontier Airlines followed with 5.5%.
- Delta Air Lines accounted for 1.5% of domestic market share and SkyWest Airlines accounted for 1.1%.
- Volaris, Porter Airlines and other operators together accounted for less than 1%.
How many routes does Midway International Airport serve?
- As of 2025, Midway International Airport offers approximately 165 daily direct flights to 69 cities across the United States and about 8 daily direct flights to 9 international destinations.
- About seven airlines share the network, though Southwest operates most flights.
- On an average day the schedule includes roughly 198 domestic departures and eight international departures, numbers that vary with seasonal demand.
Monthly Trends in Passenger Traffic at Midway International Airport
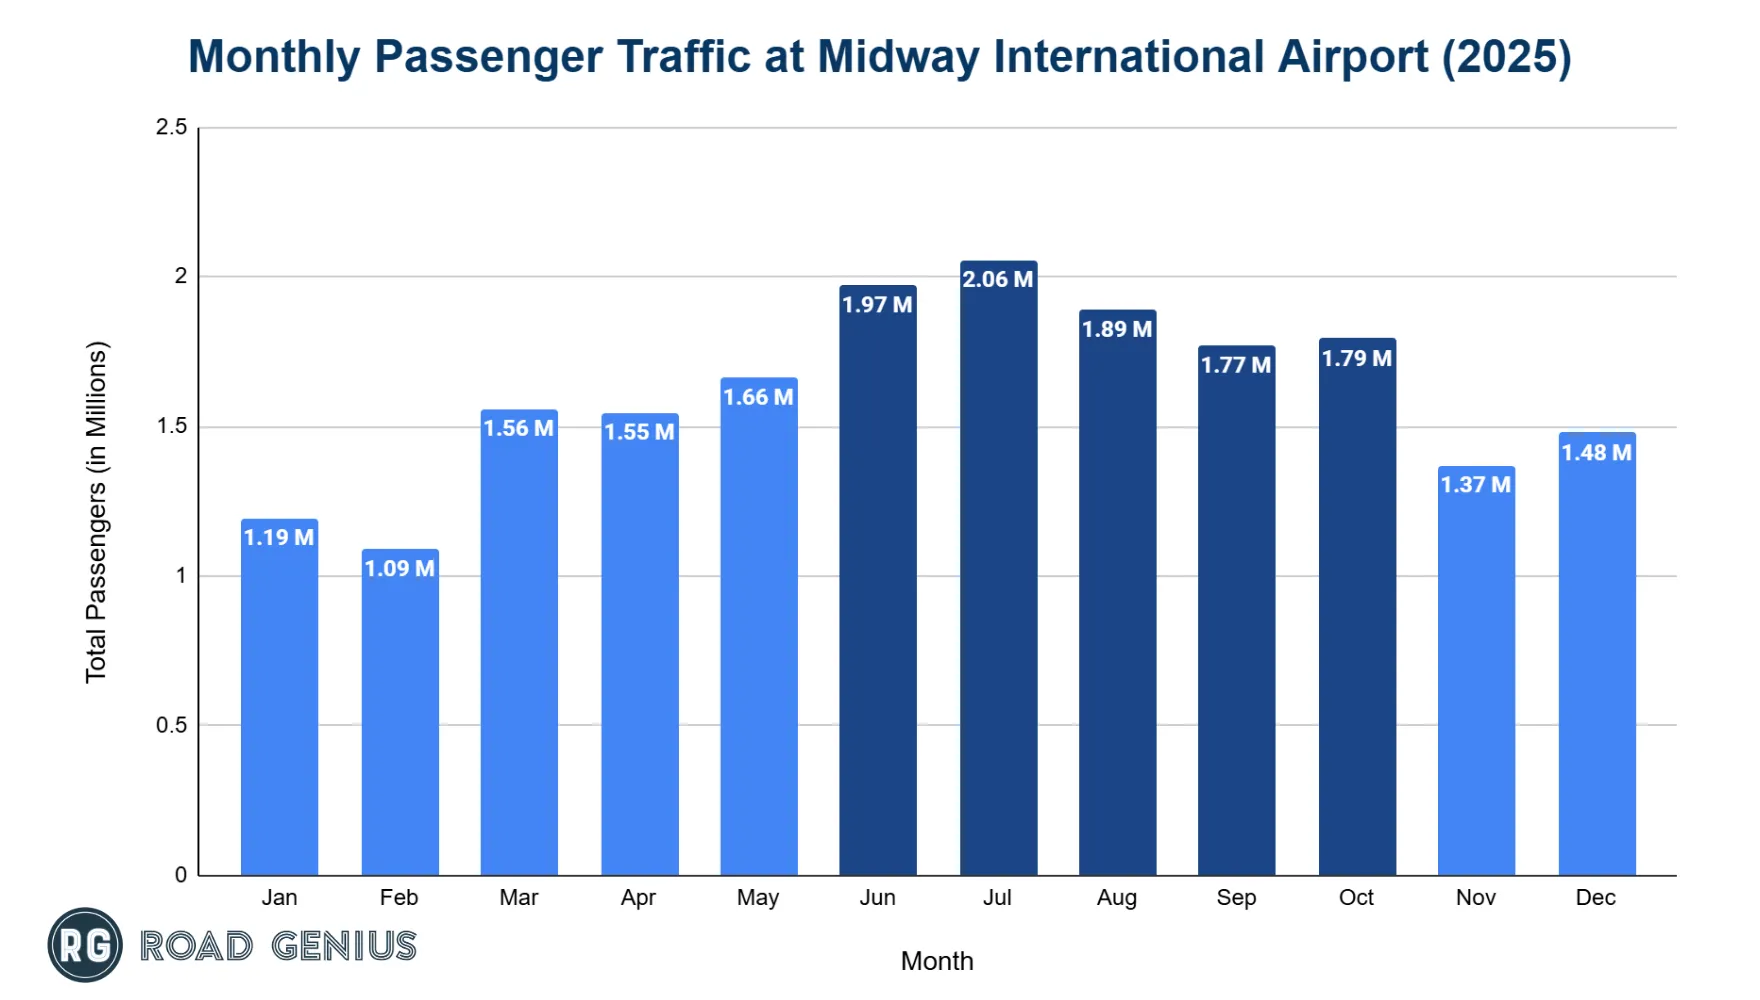
Traffic peaks in summer and ebbs in winter.
- June and July 2025 were the busiest months with 1.97 million and 2.06 million passengers respectively.
- August followed with 1.89 million passengers.
- January and February were the slowest months with 1.19 million and 1.09 million passengers.
Which destinations are the most popular from Midway International Airport?
Domestic Destinations
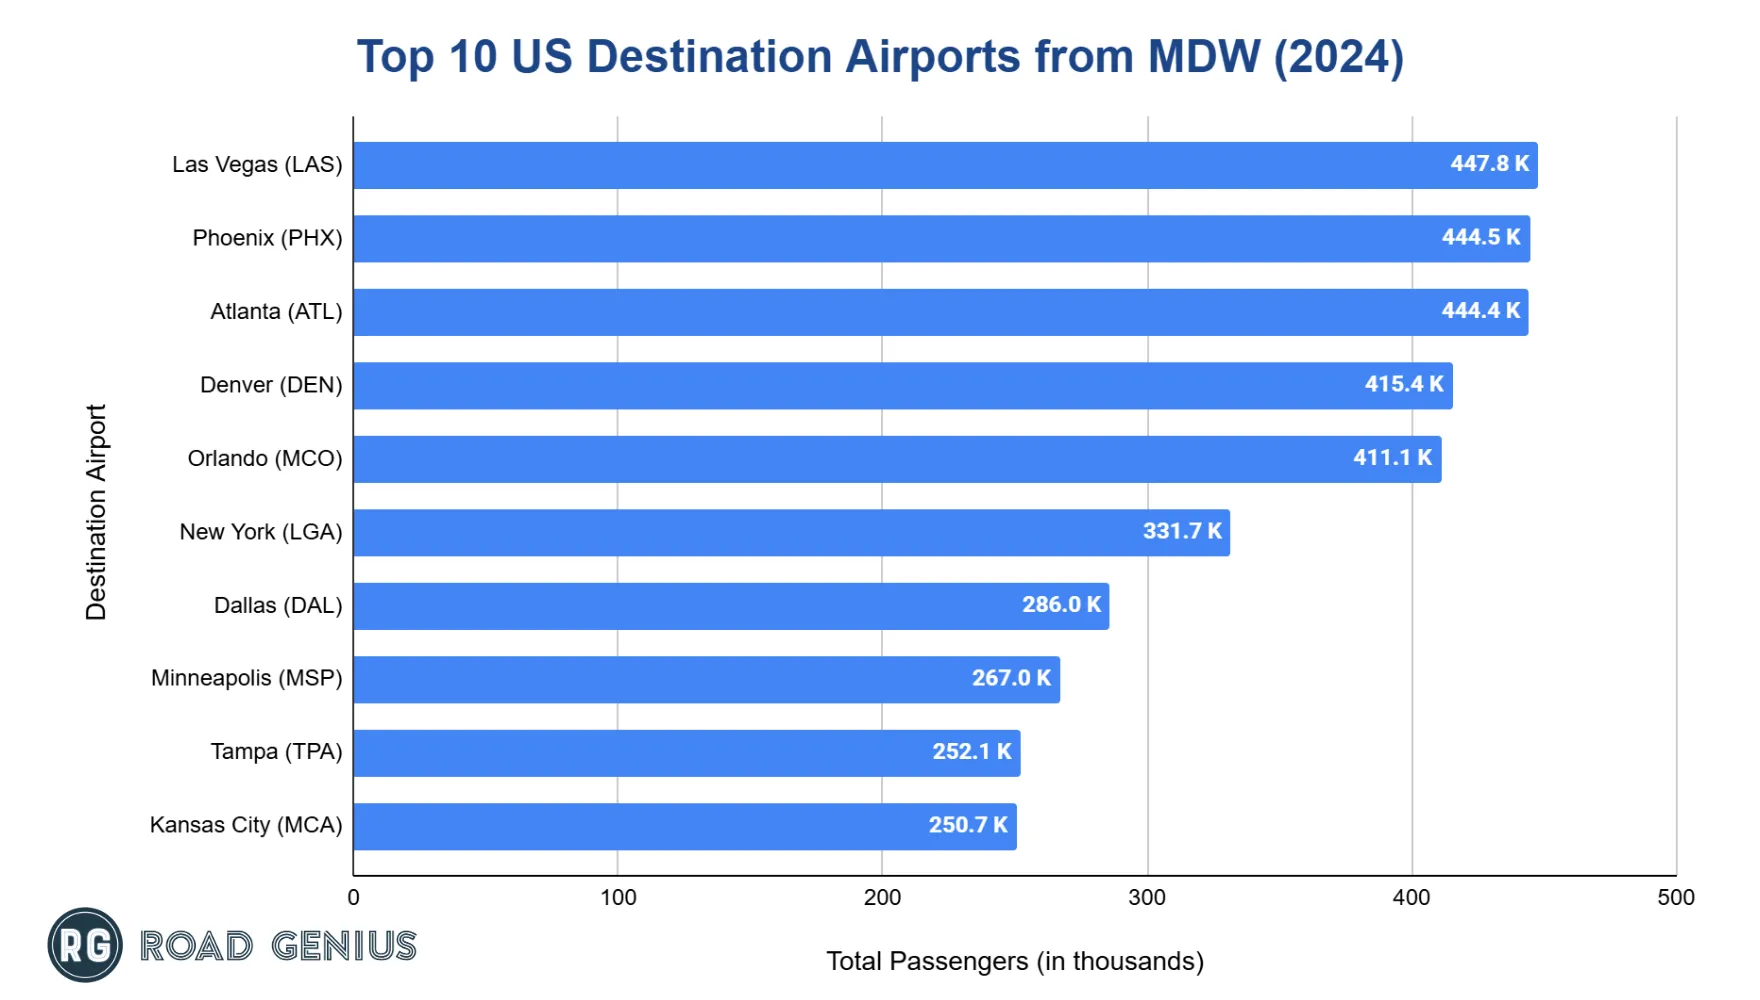
- Las Vegas was the leading domestic destination from Midway International Airport (MDW) in 2024, handling around 447,760 passengers.
- Phoenix and Atlanta followed closely, with approximately 444,490 and 444,360 travelers, respectively.
- Denver, with 415,400 passengers, and Orlando, with 411,120, completed the top five list.
International Destinations
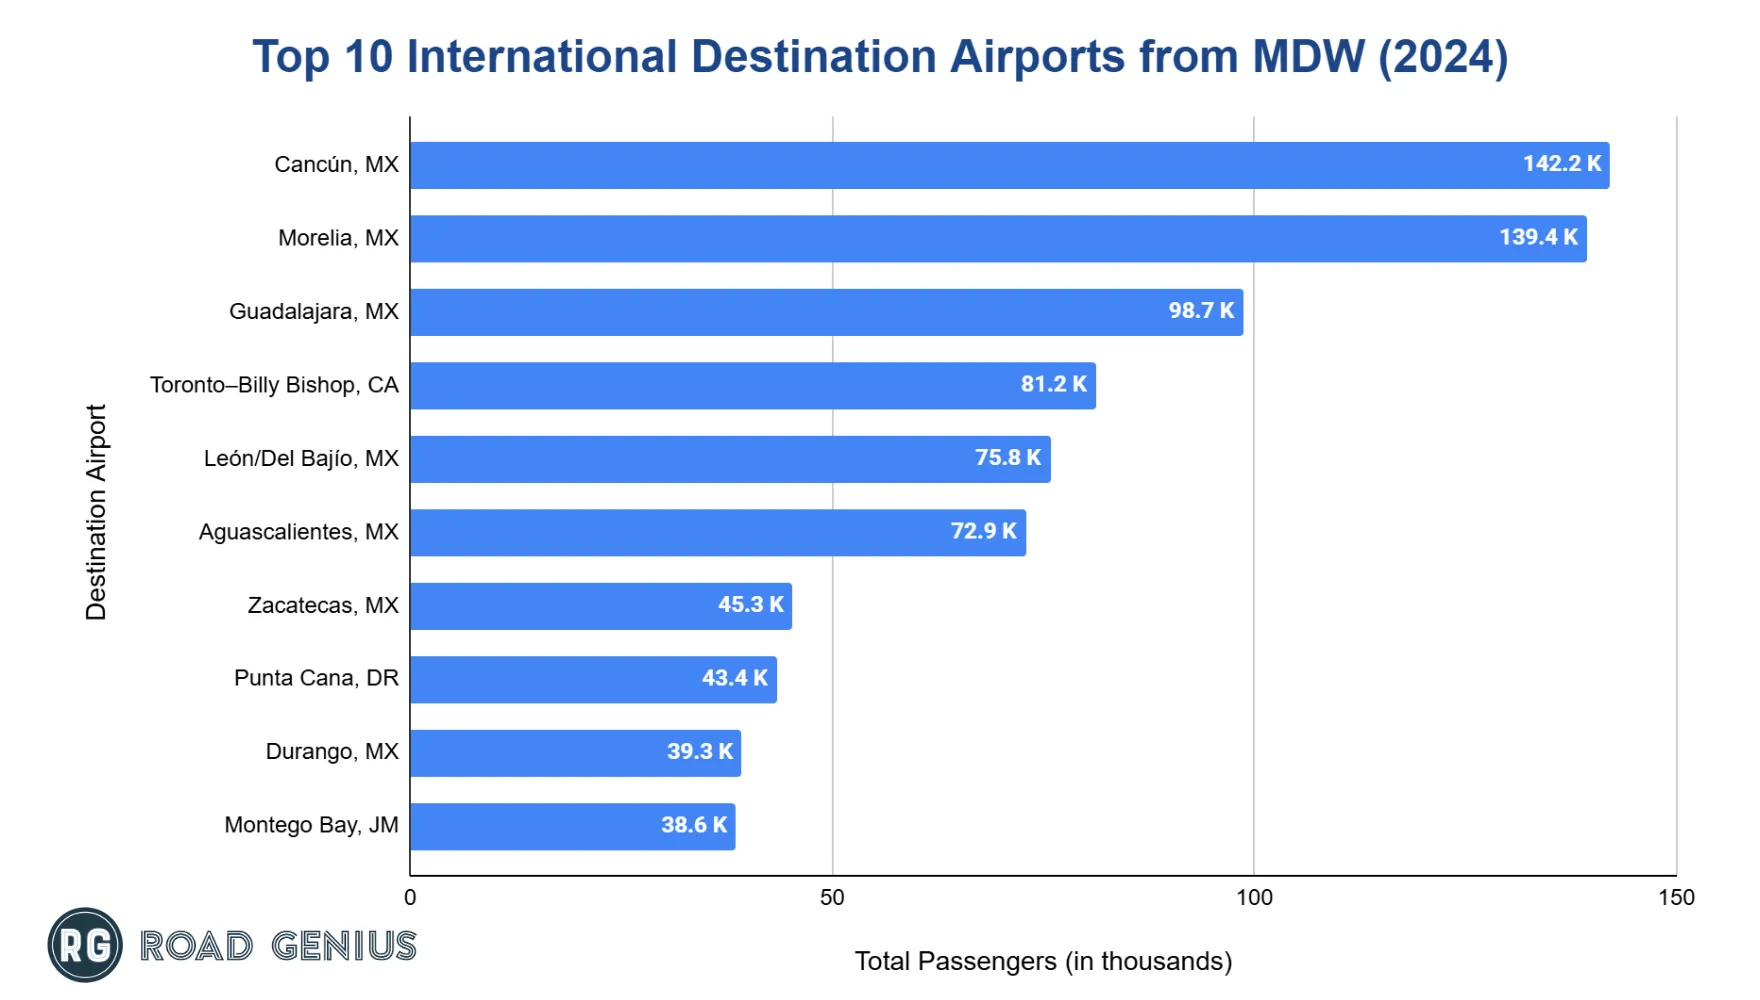
- Cancún, Mexico dominated international traffic with 142,177 passengers in 2024.
- Morelia, Mexico ranked second with 139,406 passengers.
- Guadalajara, Mexico completed the top three with 98,744 passengers.
- Toronto Billy Bishop Airport, Canada handled 81,196 passengers.
- León/Del Bajío, Mexico completed the top five with 75,826 passengers.
How much cargo does Midway International Airport handle annually?
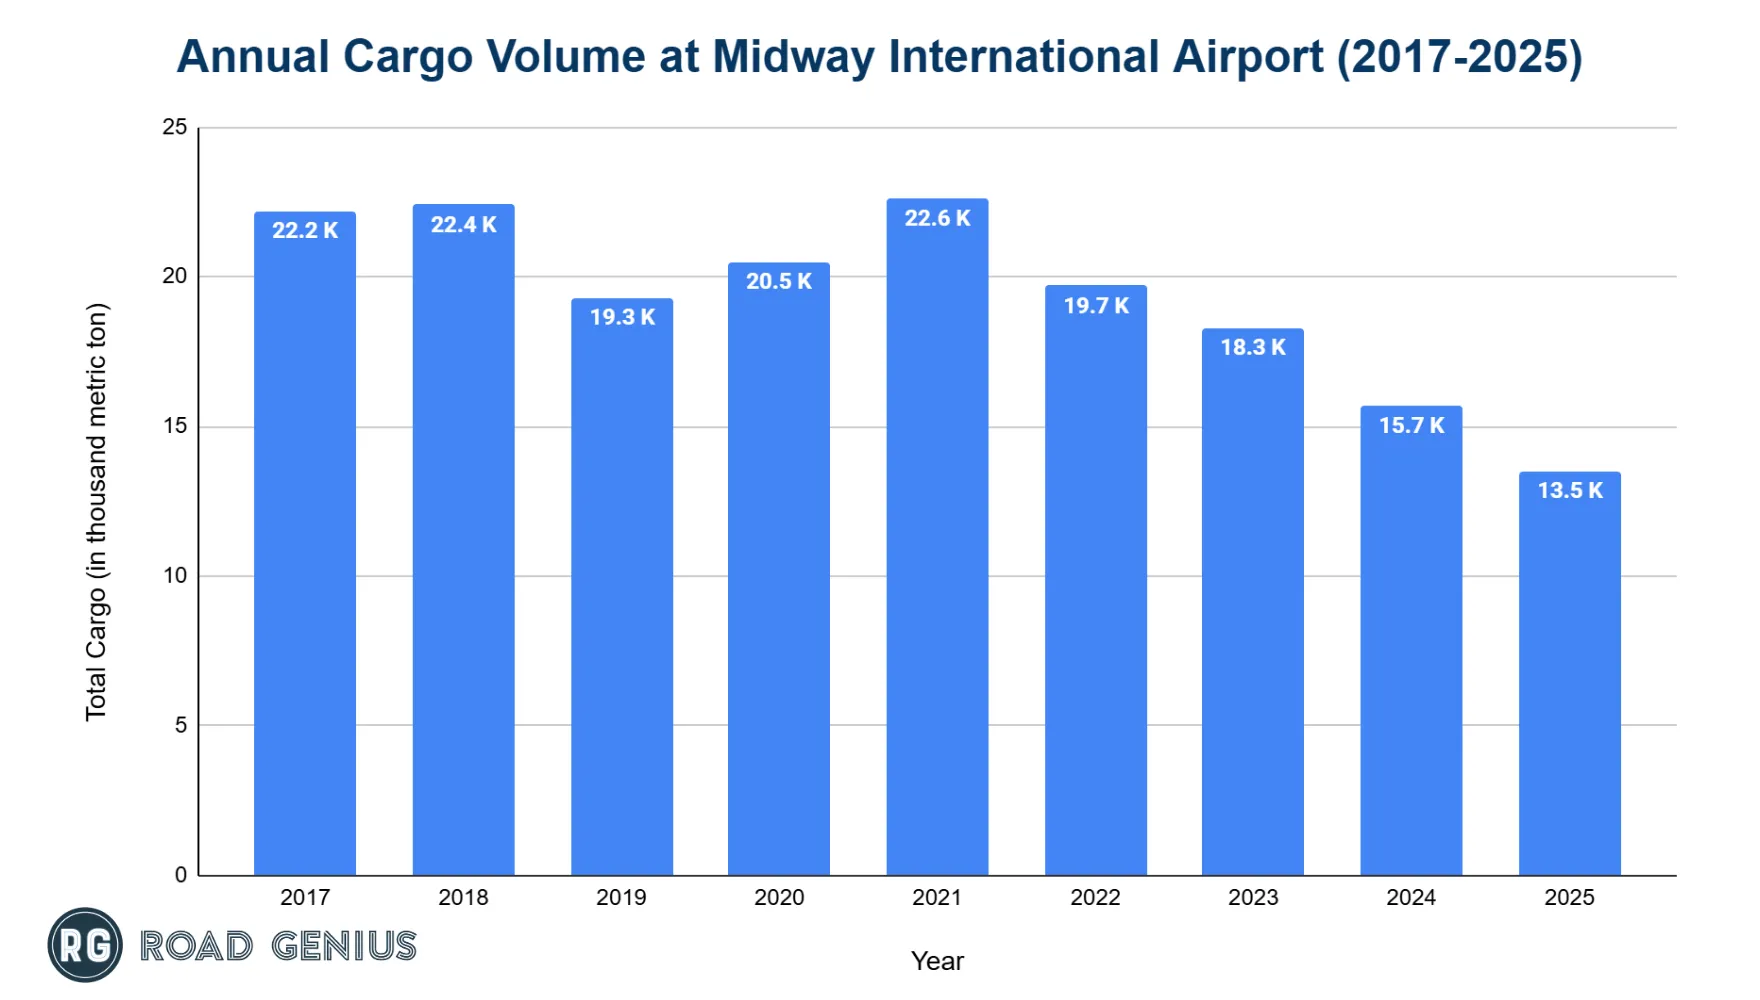
Midway processes about 20,000 metric tonnes of freight a year.
- In 2025 cargo volume was 13,529 tonnes, down 13.7% from 15,669 tonnes in 2024.
- Before the pandemic the airport handled 19,349 tonnes in 2019.
- The pandemic year of 2021 saw the recent peak of 22,560 tonnes, while 2020 registered 20,457 tonnes.
- In 2022, the airport handled 19,691 tonnes of cargo, followed by 18,292 tonnes in 2023.
Delays and Cancellations at Midway International Airport
- On‑time departures: 74% in 2024 (rose from 71% in 2023)
- On‑time arrivals: 80% in 2024 (up from 79% in 2023)
- Cancellation rate: 1.17%, down from 1.41% in 2023
- Average departure delay: 54.35 minutes (50.49 minutes in 2023)
- Average arrival delay: 58.71 minutes (55.09 minutes in 2023)
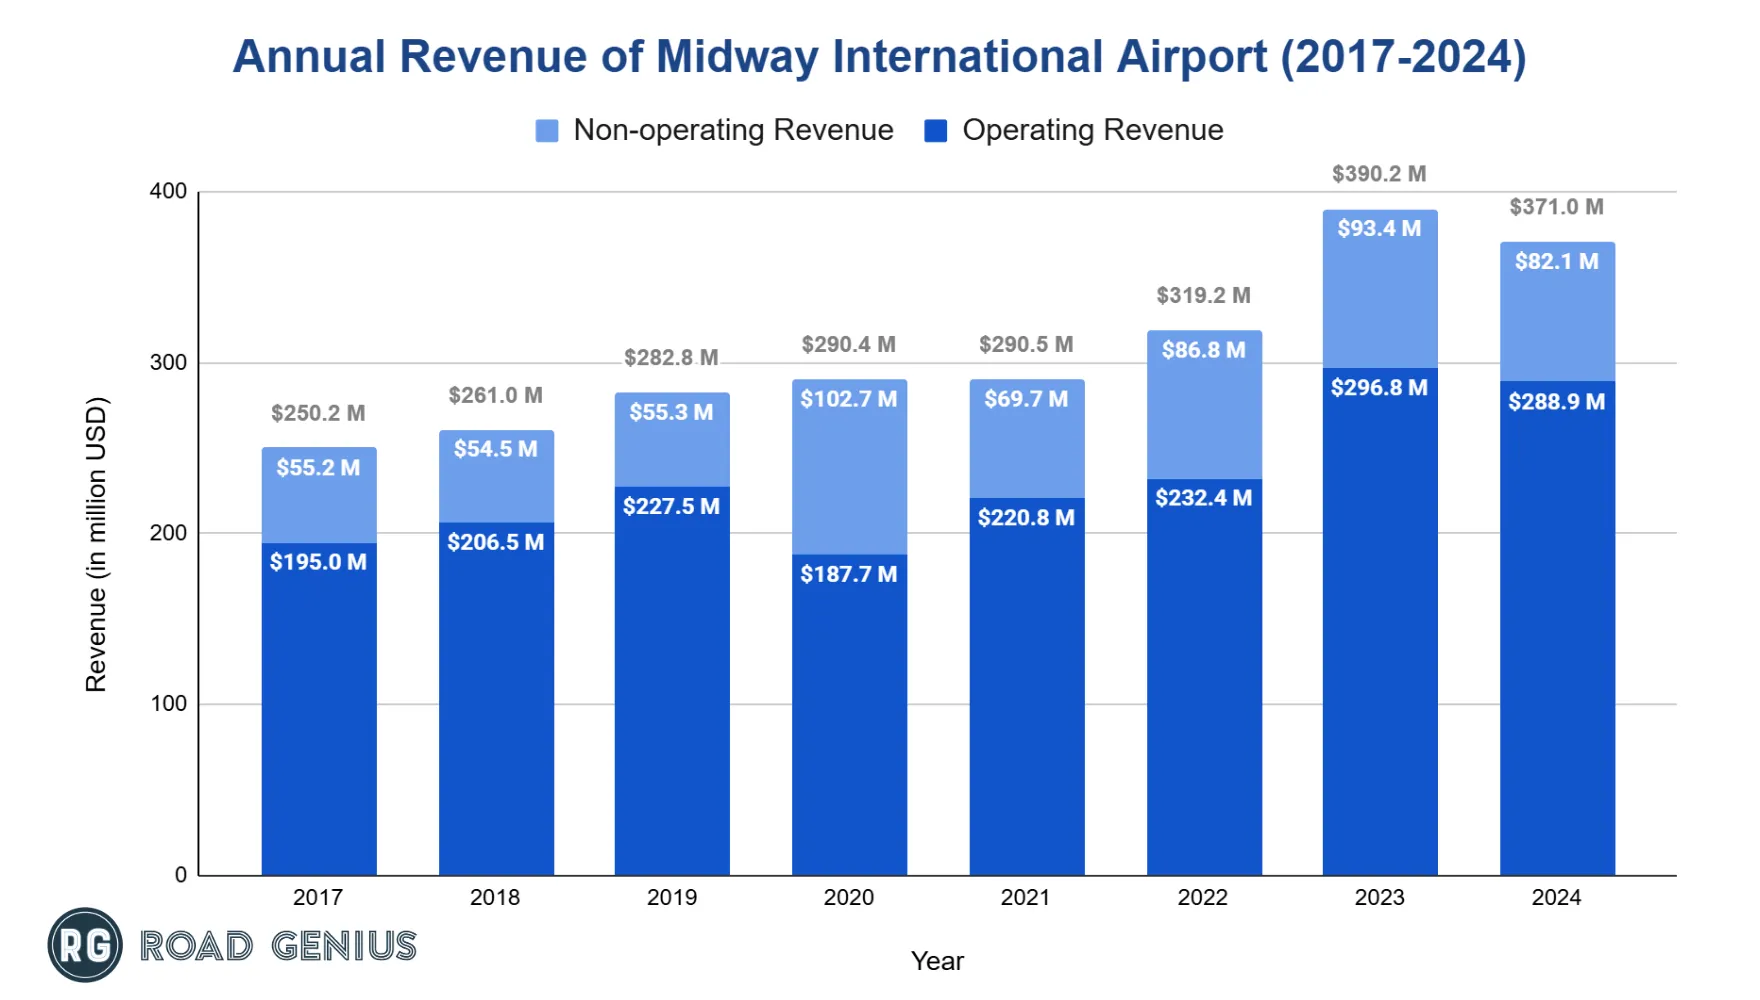
How much revenue does Midway International Airport generate each year?
The airport brings in roughly $300 million annually.
- Revenue totaled $282.8 million in 2019 then inched to $290.4 million in 2020.
- It held at $290.5 million in 2021 before climbing to $319.2 million in 2022 and $390.2 million in 2023.
- Revenue slipped to $371 million in 2024.
More Statistics
- Billings Airport (BIL) Statistics
- Buffalo Airport (BUF) Statistics
- Charlotte Douglas Airport Statistics
- Eugene Airport (EUG) Statistics
- Grand Junction Regional Airport (GJT) Statistics
- Piedmont Triad Airport Statistics
- Greenville–Spartanburg Airport Statistics
- Houston Hobby Airport Statistics
- Ithaca Tompkins International Airport Statistics
- LaGuardia Airport (LGA) Statistics
- Santa Barbara Municipal Airport Statistics
- Santa Fe Regional Airport Statistics
Major Incidents at Midway International Airport
- December 8 1972: A United Airlines 737-200 crashed into nearby homes on approach, killing 43 people on board and two on the ground
- March 25 1976: An Executive Lockheed Jetstar overran the runway fence on takeoff, causing four fatalities
- August 6 1976: An Air Chicago TB-25N crashed after engine failure at takeoff, killing two crew members and one person on the ground
- December 8 2005: A Southwest Airlines 737-700 skidded off a snowy runway and struck two cars on 55th Street and Central Avenue, killing a child
References
- Chicago Department of Aviation Air Traffic Data · flychicago.com
- International Destinations of Passengers from Raleigh-Durham International Airport · data.transportation.gov
- BTS TranStats — Airport profiles (route information by airport) · transtats.bts.gov
- Incidents at Jackson–Medgar Wiley Evers International Airport — NTSB · ntsb.gov

