

 Popular Countries
 24/7 Support
Published Sep 9, 2026
Santa Barbara Municipal Airport (SBA) serves as a key gateway on California’s Central Coast, connecting the Santa Barbara region and the UCSB campus to destinations across the United States through multiple partner airlines.
How many passengers pass through Santa Barbara Municipal Airport each year?
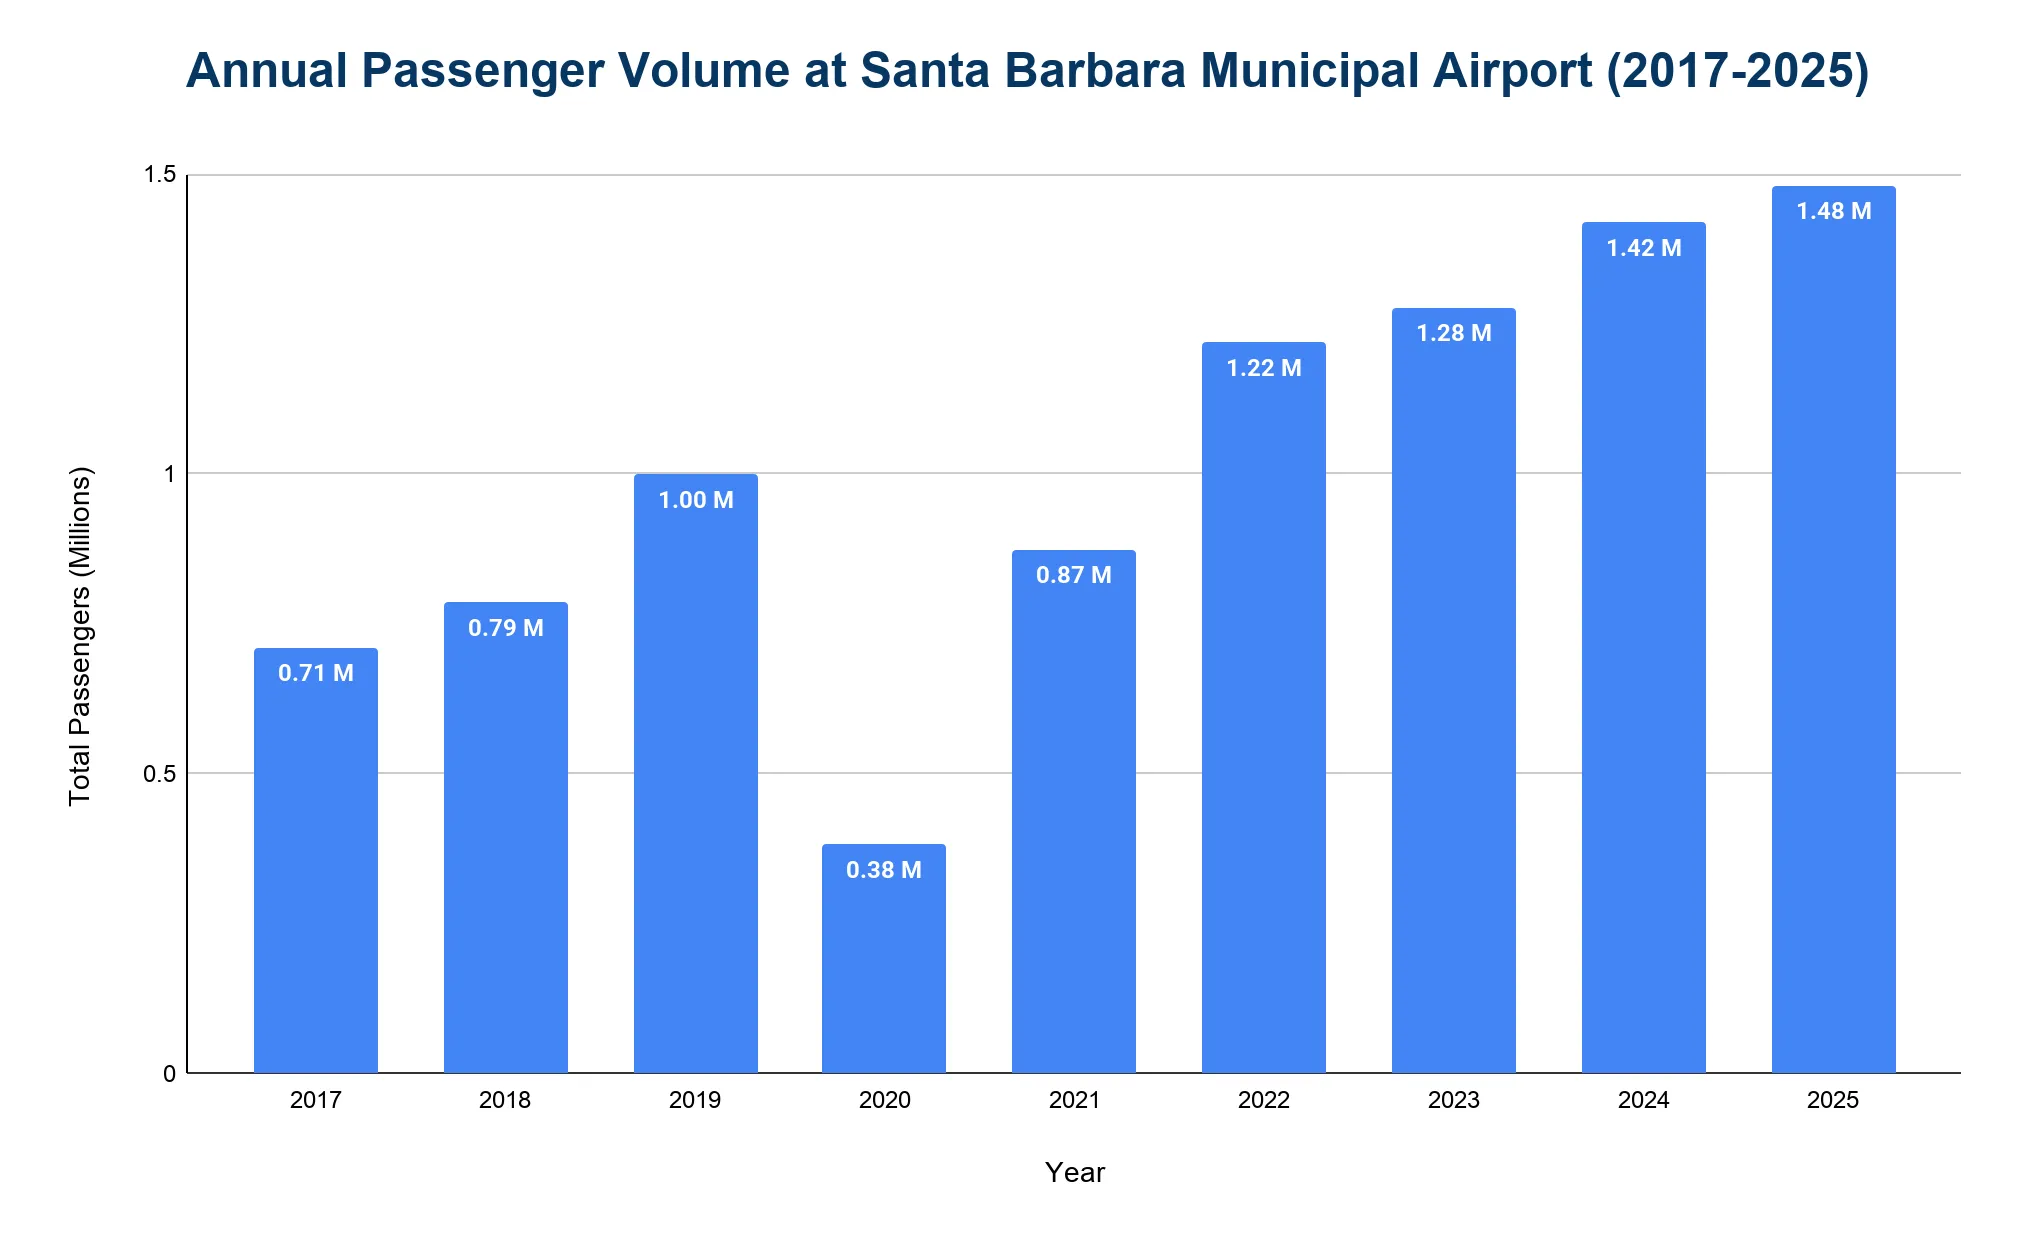
Santa Barbara Municipal Airport handles approximately 1.4 million passengers annually.
- The airport served 1.48 million passengers in 2025, surpassing its previous record and marking a 4.2% increase from 1.42 million in 2024.
- In 2019, the airport handled 998,691 passengers before the pandemic.
- Passenger traffic dropped sharply to 382,090 in 2020 (a 62% decline), then recovered to 873,374 in 2021.
- Recovery gained momentum in 2022 with 1.22 million passengers, followed by 1.28 million in 2023.
What is the total number of aircraft operations at Santa Barbara Municipal Airport each year?
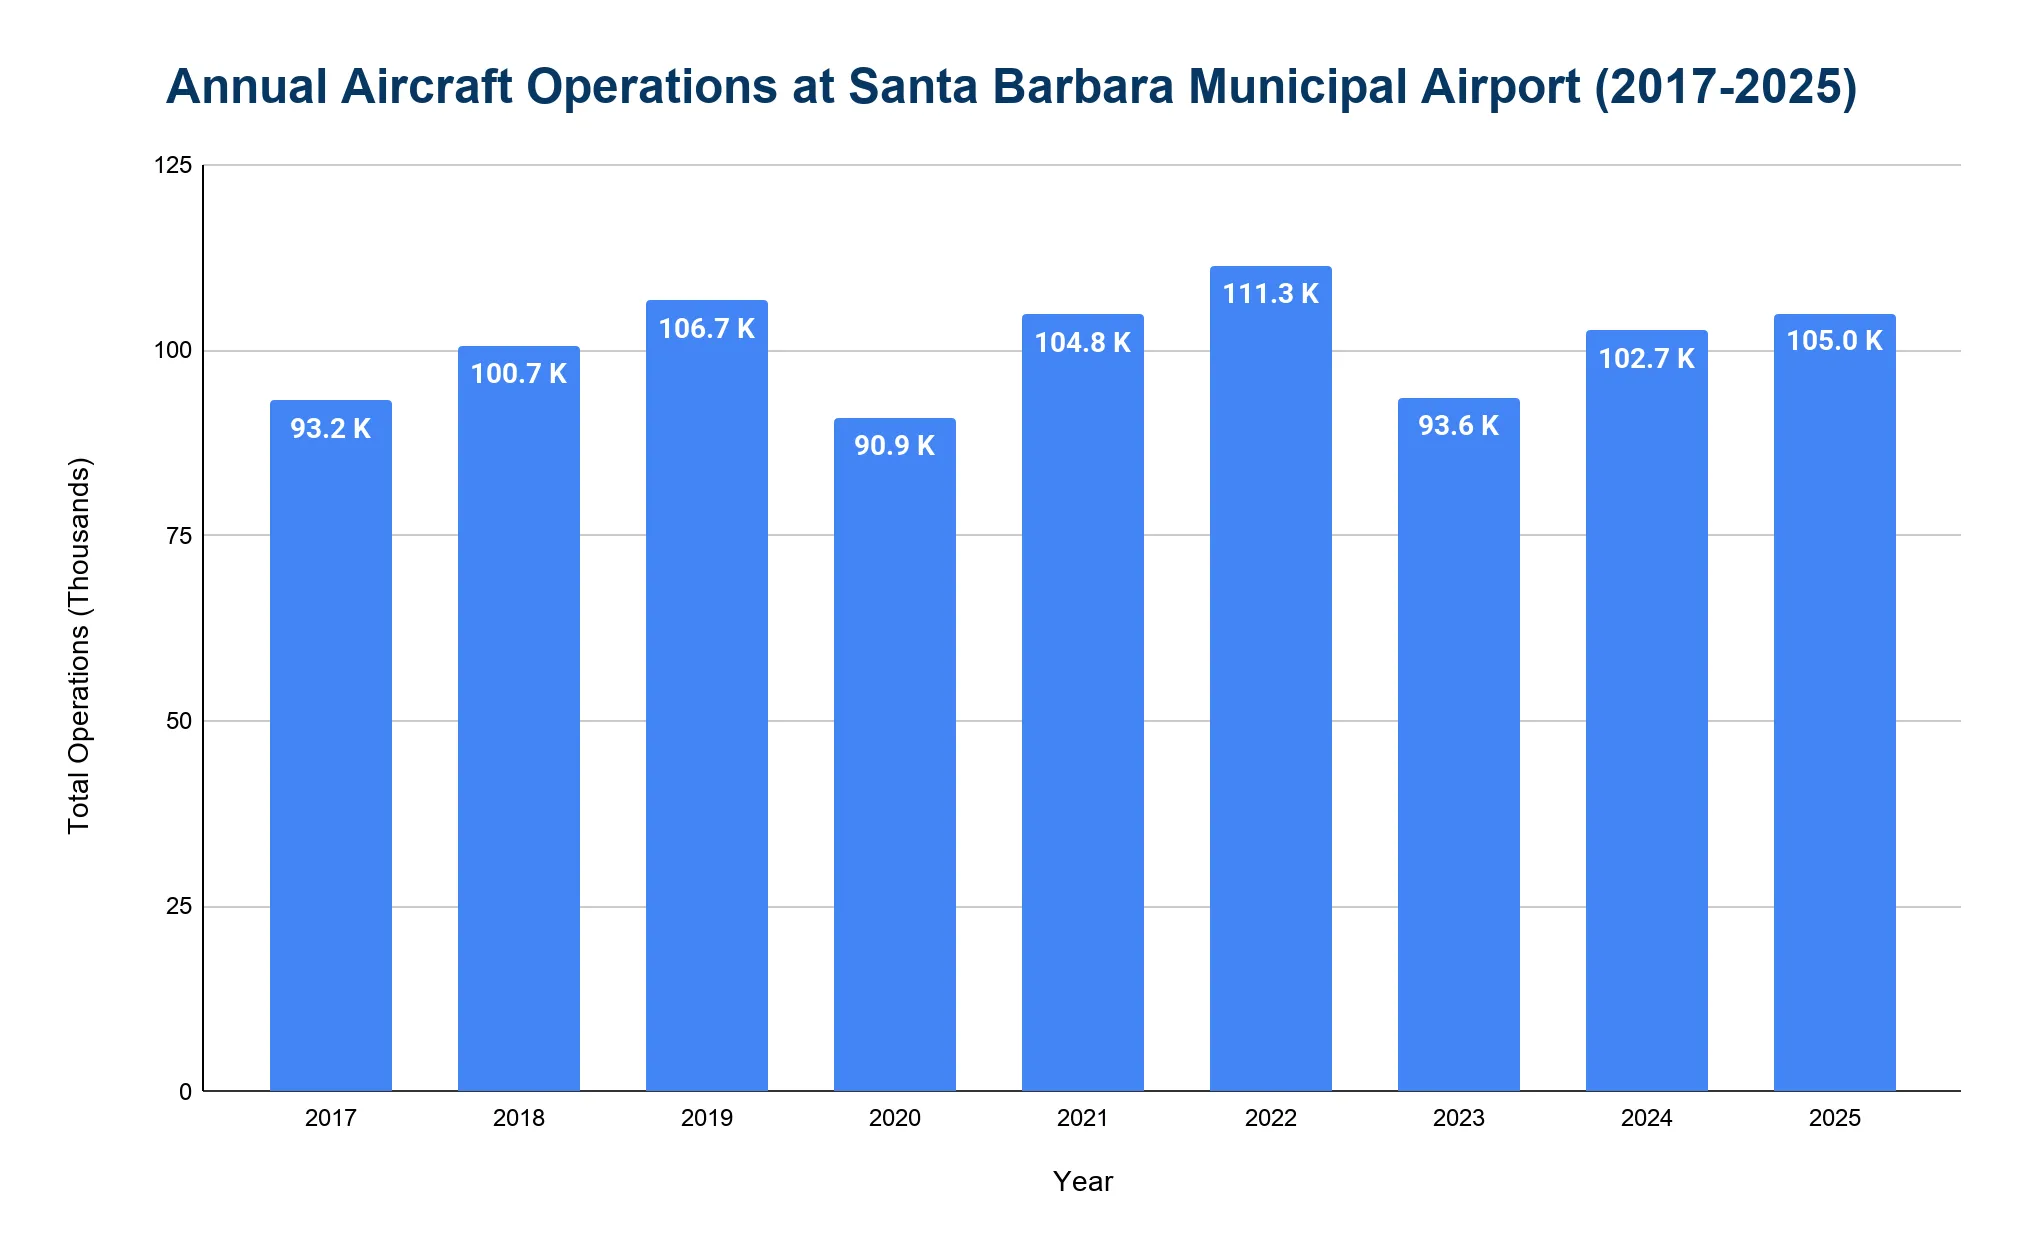
Santa Barbara Municipal Airport sees over 90,000 total aircraft operations annually, including commercial, general aviation and military flights.
- In 2025, there were 105,001 total aircraft movements, reflecting a 2.3% increase from 102,666 movements in 2024.
- In 2019, before the pandemic, movements peaked at 106,702.
- Operations declined to 90,939 in 2020, the lowest point during the pandemic.
- Recovery followed with 104,763 in 2021 and a peak of 111,338 in 2022, then moderated to 93,644 in 2023.
Which airlines operate the most flights out of Santa Barbara Municipal Airport?
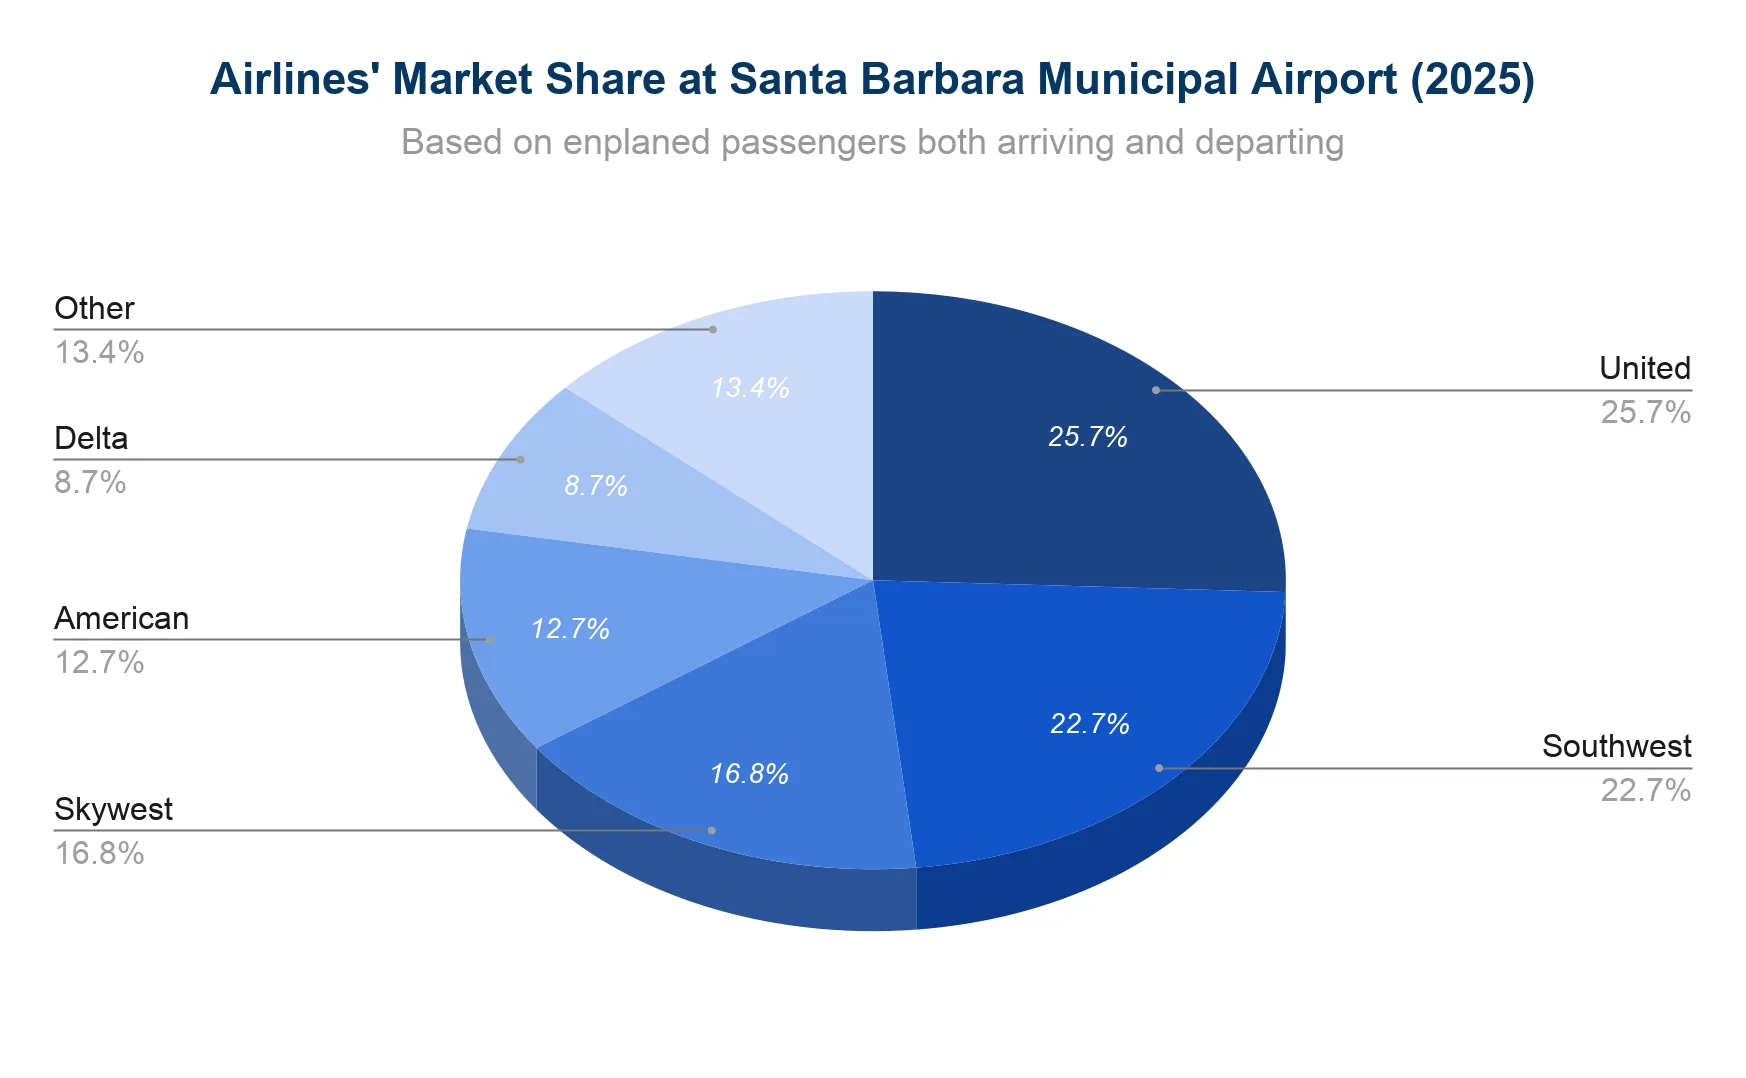
A mix of major and low-cost carriers operate at SBA, with Southwest Airlines and United Airlines holding the largest shares.
- In 2025, United Airlines led with 25.7% market share, supported by strong West Coast hub connections.
- Southwest Airlines followed with 22.7% of the annual passenger volume.
- SkyWest Airlines accounted for 16.8%, operating regional routes as a code-share partner.
- American Airlines held 12.7%, offering key connections to its hubs.
- Delta Air Lines had 8.7% after resuming service in 2024, including new routes like Atlanta.
- Together, these five airlines carried over 86% of SBA’s passengers, indicating a concentrated but competitive market.
What are the monthly trends in passenger traffic at Santa Barbara Municipal Airport?
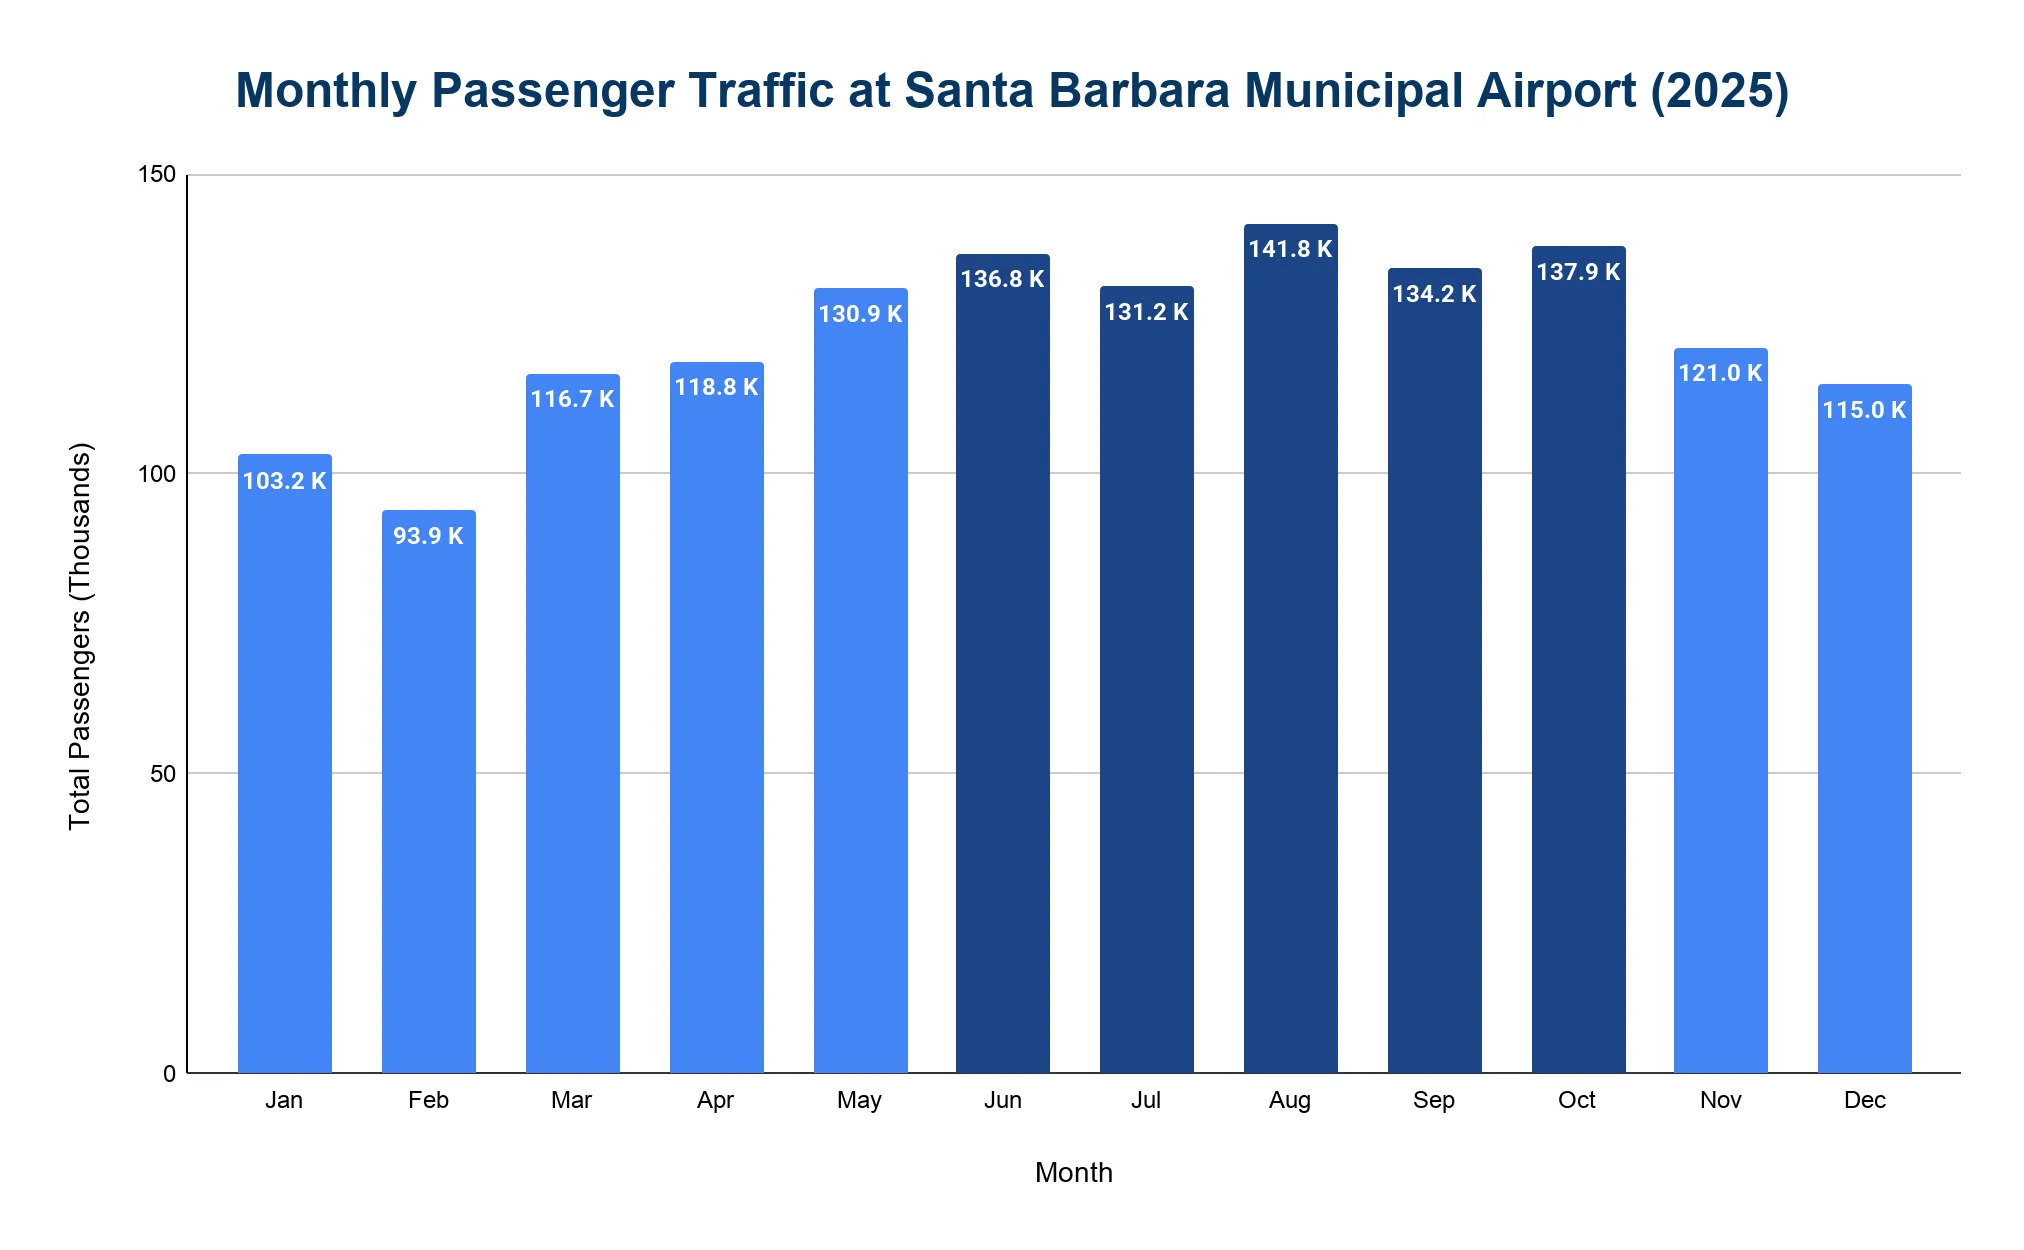
Santa Barbara Municipal Airport experiences strong seasonal patterns, with summer and early fall typically driving the highest traffic
- August was the busiest month in 2025 with 141,810 passengers.
- October followed with 137,916 passengers, showing continued demand into fall.
- June followed with 136,839.
- September handled 134,213 and July had 131,213, both maintaining high volumes.
- The lowest traffic came in February with 93,914 passengers, followed by January with 103,173, reflecting typical post-holiday slowdowns.
How many routes are there at Santa Barbara Municipal Airport?
In 2025, Santa Barbara Municipal Airport (SBA) featured 13 nonstop destinations.
- The airport offers only domestic routes, with no scheduled international service.
- International travel is accessible via connections through major U.S. hubs.
- Key destinations include Denver, Dallas, Las Vegas, Phoenix, Los Angeles, San Francisco, Seattle, Portland, Salt Lake City, Sacramento, Oakland and Atlanta.
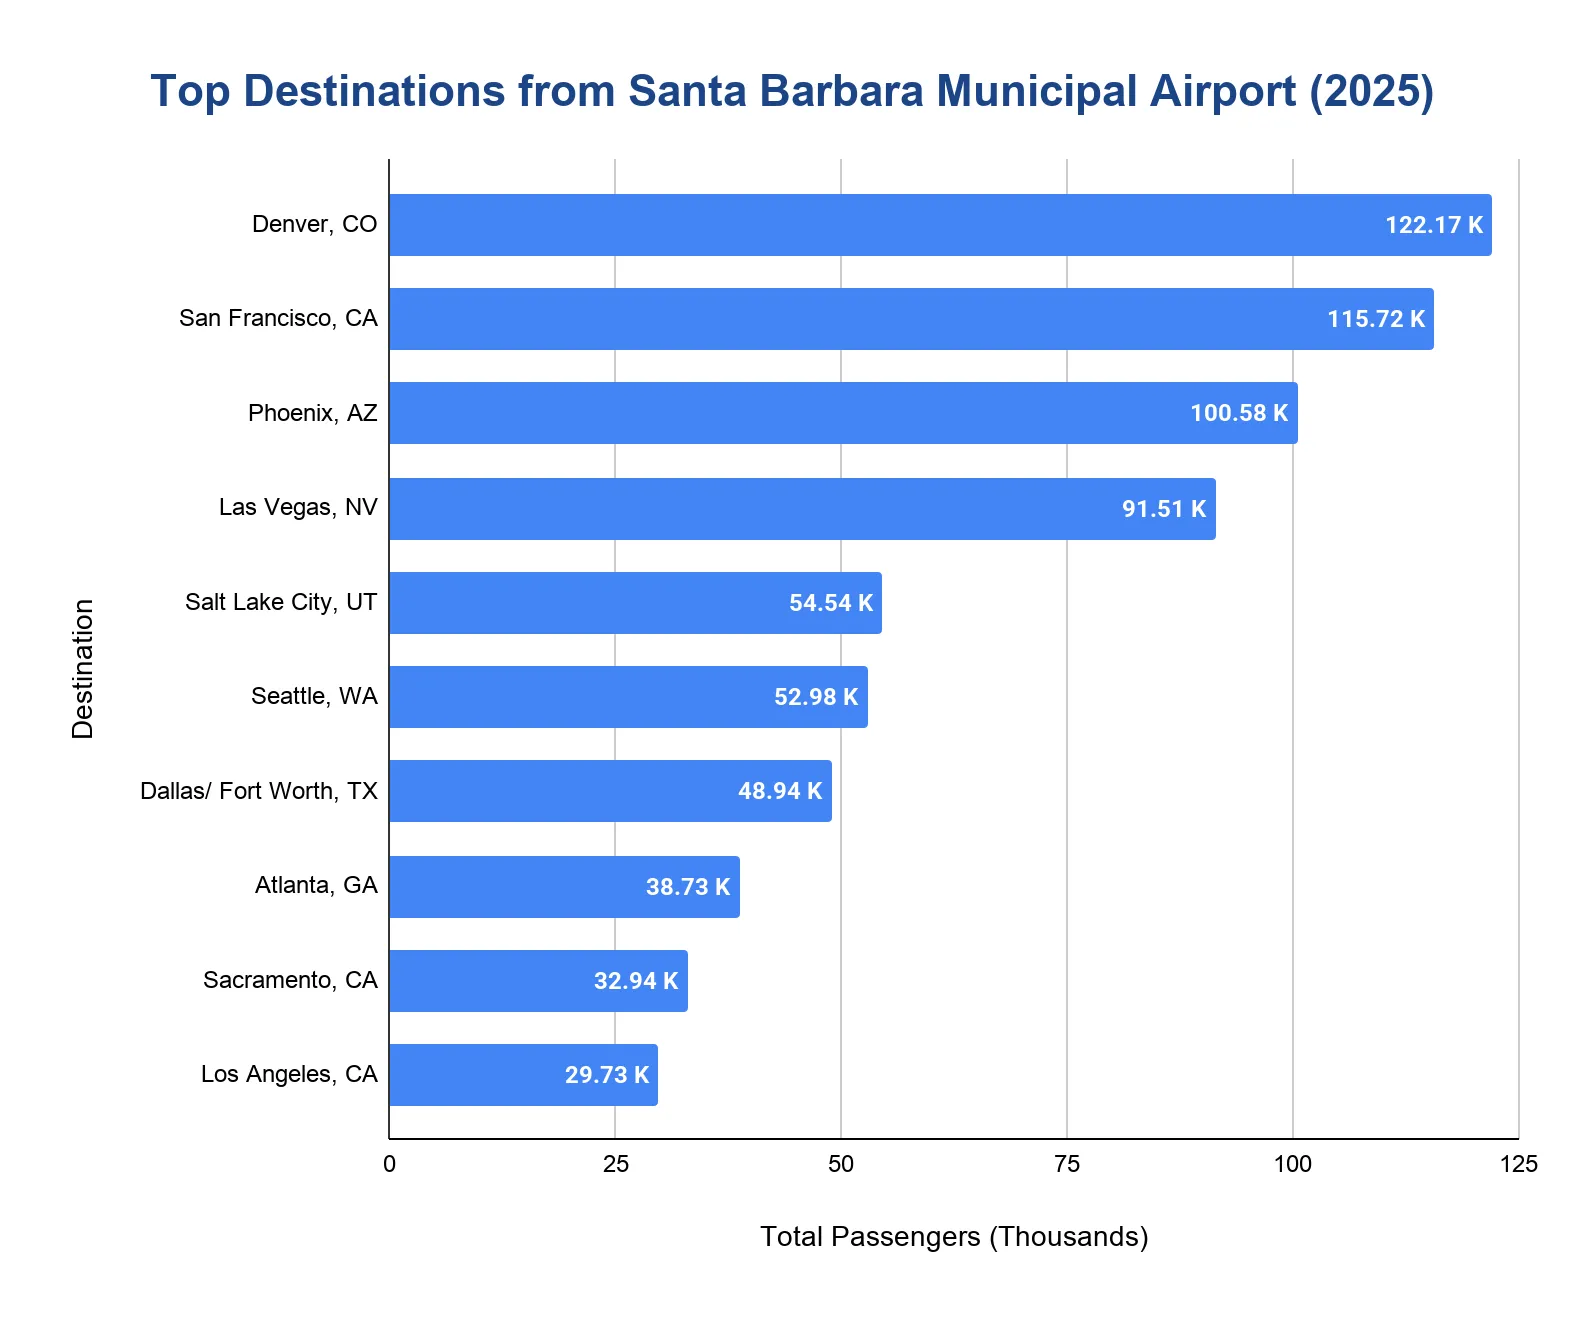
Which destinations are the most popular from Santa Barbara Municipal Airport?
- Denver, CO (DEN) was the busiest route in 2025 with 122,170 passengers.
- San Francisco, CA (SFO) followed with 115,720.
- Phoenix, AZ (PHX) saw 100,580 passengers.
- Las Vegas, NV (LAS) had 91,510 passengers.
- Salt Lake City, UT (SLC) completed the top 5 with 54,540 passengers.
How many cancellations occur at Santa Barbara Municipal Airport annually?
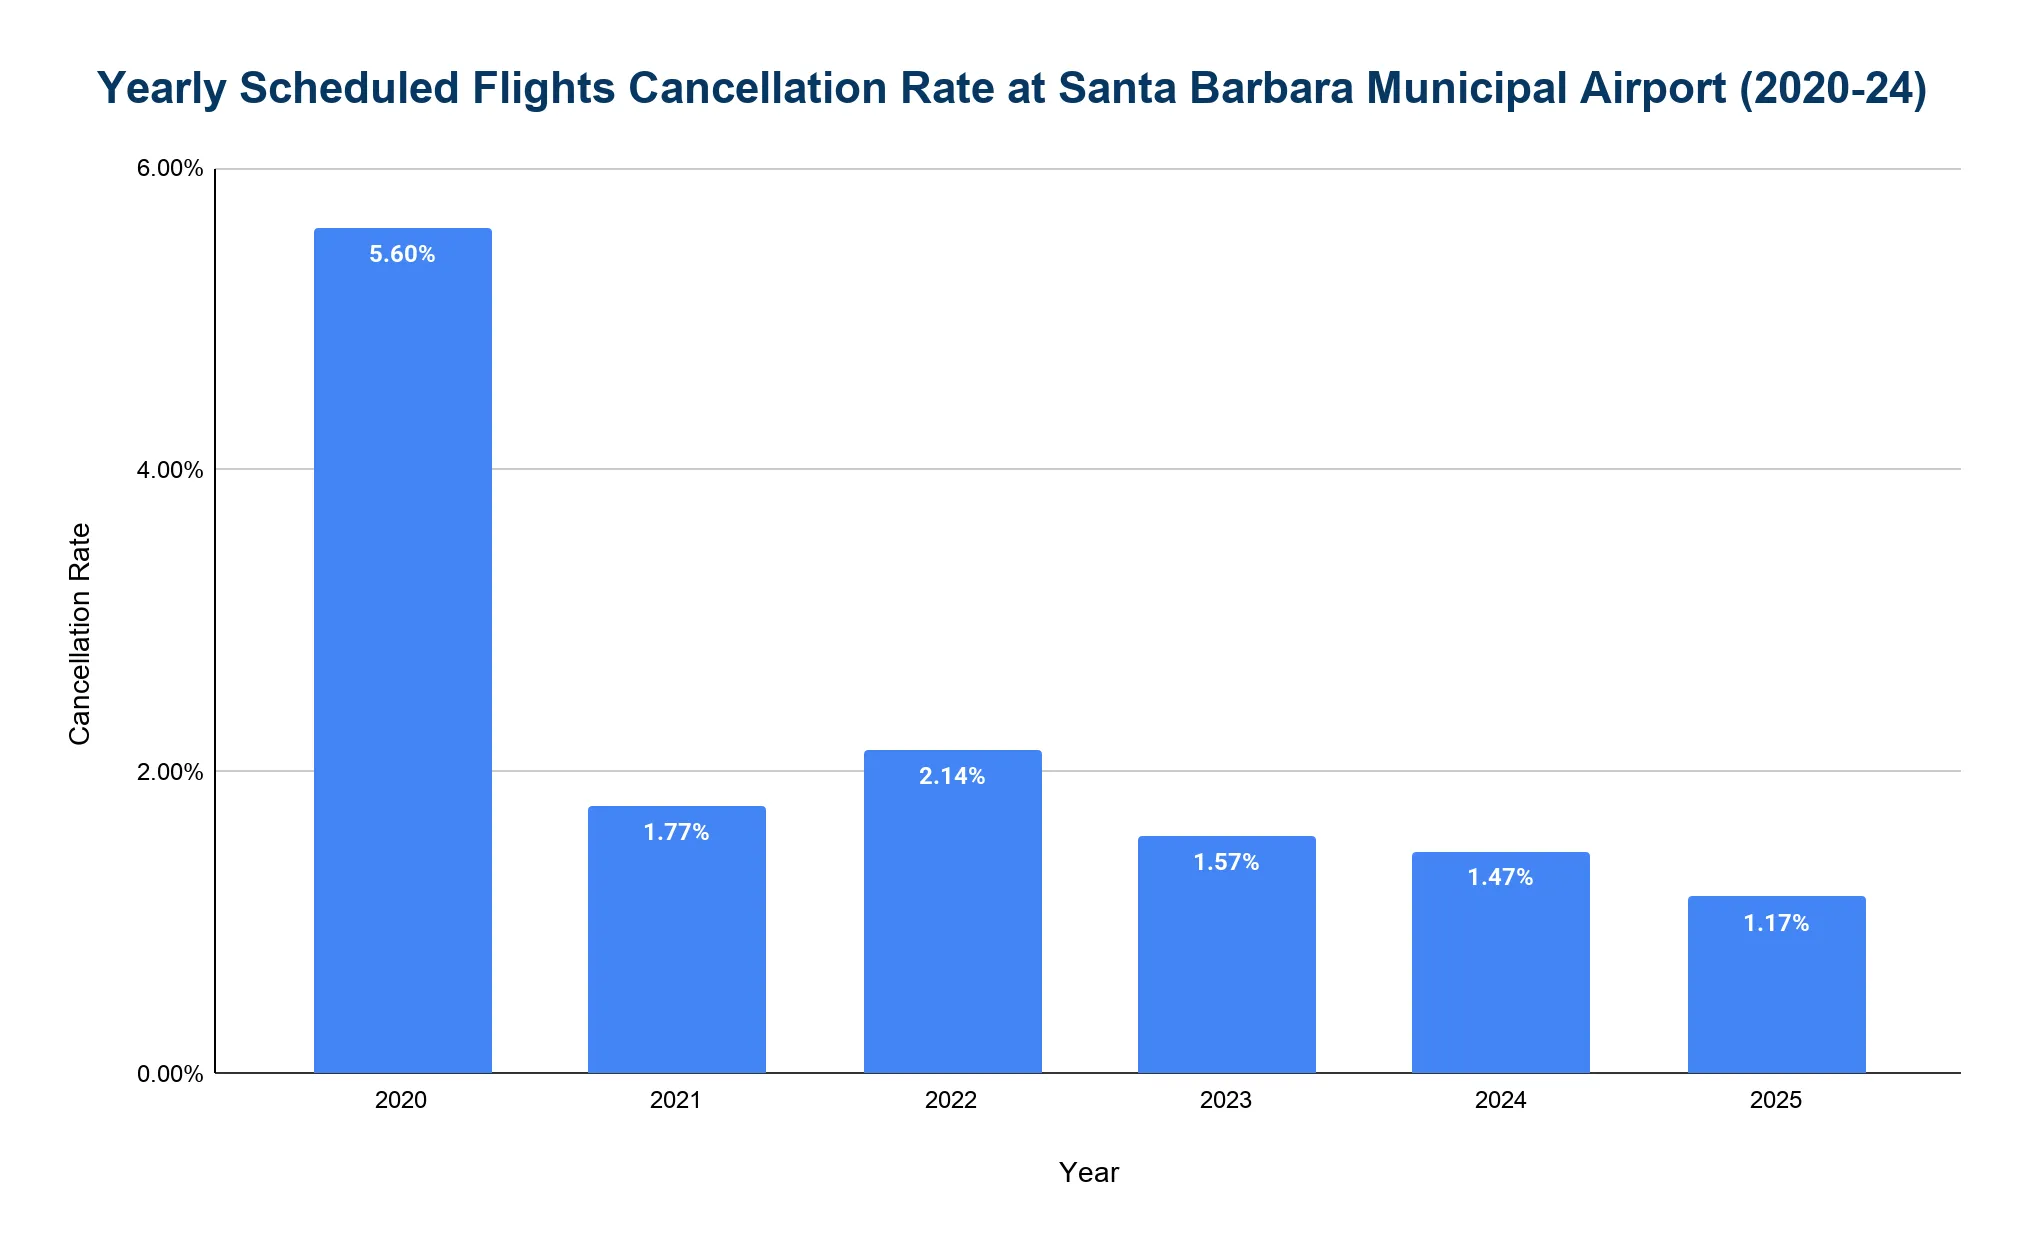
Flight cancellations at SBA have remained relatively low since the pandemic, staying below 2.5%.
- In 2025, only 1.17% of flights were cancelled, the lowest rate in recent years.
- The highest rate occurred in 2020 at 5.60%, due to COVID-19 disruptions.
- The rate dropped to 1.77% in 2021 as schedules normalized.
- In 2022, cancellations rose slightly to 2.14% due to industry-wide staffing challenges, then improved to 1.57% in 2023 and 1.47% in 2024.
Related Travel Statistics
- Bozeman Airport (BZN) Statistics
- Eastern Iowa Airport Statistics
- Fresno Yosemite International Airport Statistics
- Hilton Head Island Airport (HHH) Statistics
- Jacksonville International Airport Statistics
- JFK Airport Statistics
- Midway International Airport Statistics
- Chicago Rockford Airport Statistics
- Salt Lake City International Airport Statistics
- Santa Fe Regional Airport Statistics
- Wilmington International Airport Statistics
- Worcester Regional Airport (ORH) Statistics
What are the main causes of flight disruptions at Santa Barbara Municipal Airport?
- Coastal fog and marine layers, especially in winter mornings, often require IFR operations and may delay departures.
- Summer afternoon winds can affect smaller aircraft and alter approach paths.
- Weather at hub airports like Denver, Phoenix, Dallas and Seattle may cause delays to inbound or outbound SBA flights.
- Airline operational issues such as crew scheduling and aircraft positioning can disrupt schedules at this smaller, non-hub airport.
- Air traffic control delays at major West Coast airports can occasionally impact connecting flights, though less frequently than at larger hubs.
References
- Santa Barbara Municipal Airport Activity Data (Fly Santa Barbara) · flysba.santabarbaraca.gov
- FAA OPSNET — George Bush Intercontinental Airport Operations Data · aspm.faa.gov
- BTS TranStats — Airport profiles (route information by airport) · transtats.bts.gov

