

 Popular Countries
 24/7 Support
Updated
Seattle-Tacoma International Airport (SEA) is the primary air gateway for the Pacific Northwest. Each year the airport moves more than 50 million travelers and serves as a critical hub for domestic and international flights throughout the western United States.
How many passengers pass through Seattle-Tacoma International Airport each year?
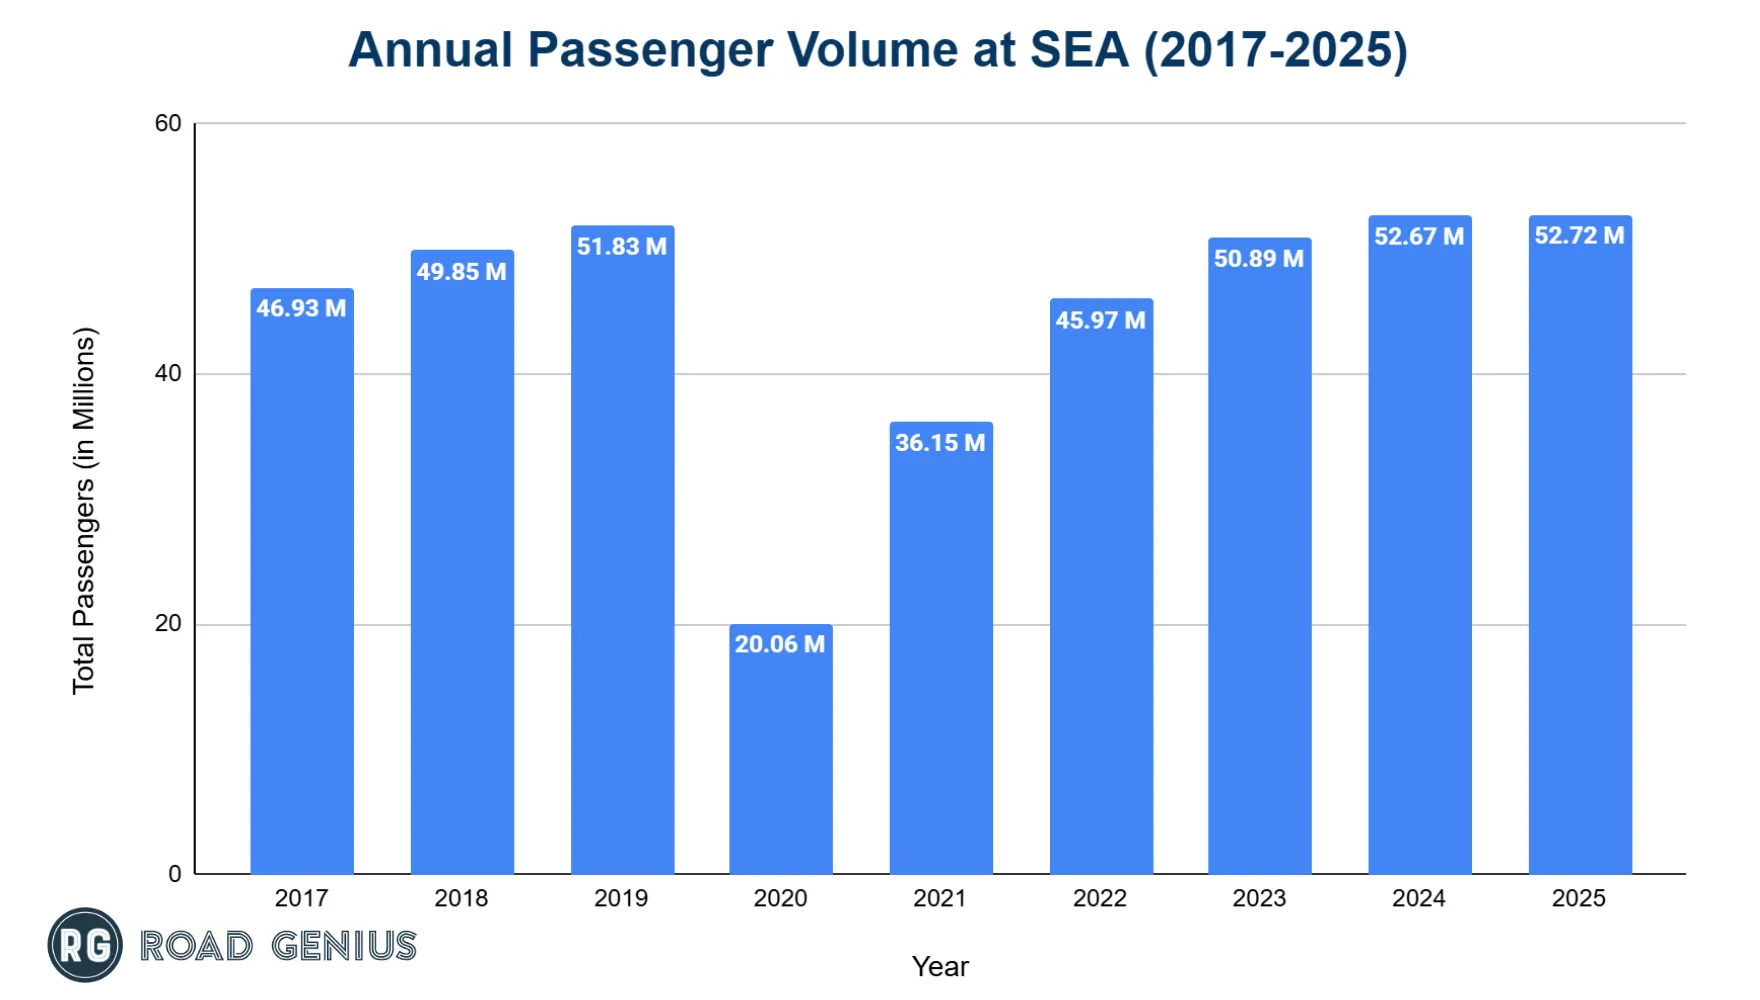
Seattle-Tacoma International Airport handles around 50 million passengers annually, and is one of the fastest-growing major airports in the United States.
- SEA processed 52.72 million passengers in 2025, a 0.1% increase from 52.67 million in 2024 and a new record. The total is also 1.7% above the pre-pandemic high of 51.83 million from 2019.
- Traffic fell to 20.06 million in 2020, then rebounded to 36.15 million in 2021
International vs Domestic Passengers
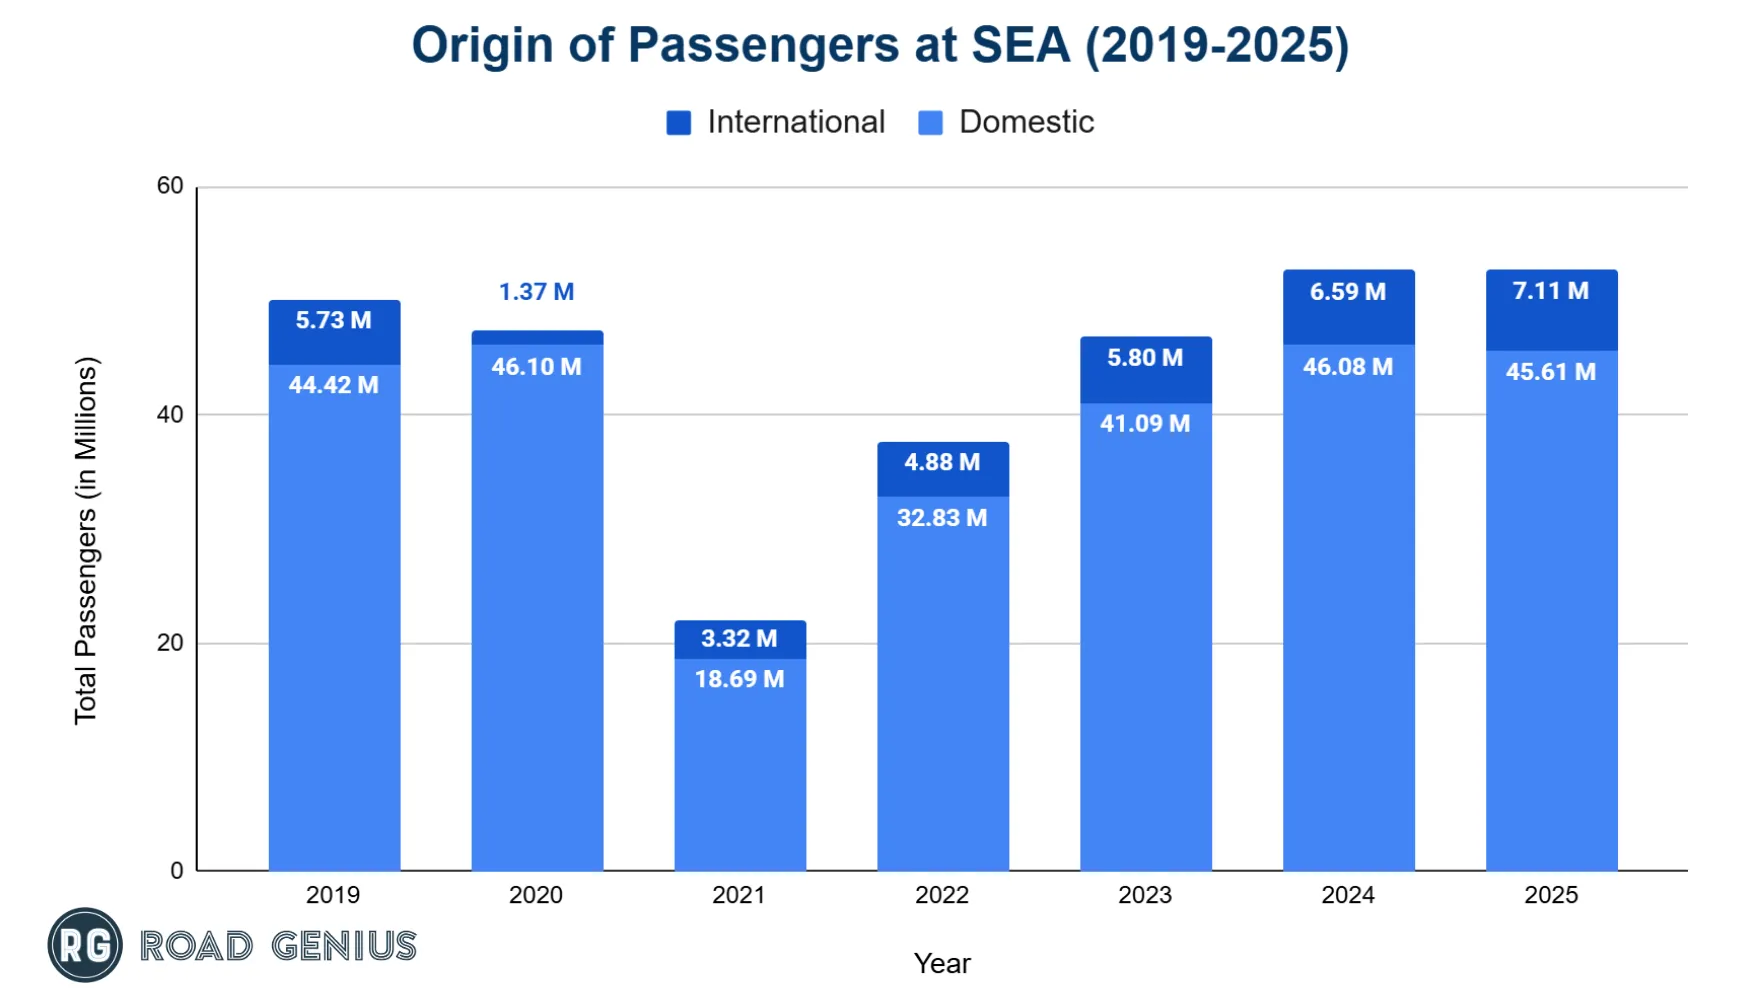
SEA remains primarily a domestic airport, though international demand is rising fast.
- Domestic passengers: 45.61 million in 2025, 86.5% of total traffic, a 1.02% decrease from 2024.
- International passengers: 7.11 million in 2025, 13.5% of total traffic, up 7.9% year over year
Inbound vs Outbound Passengers
SEA functions mainly as an origin-and-destination airport, producing almost identical inbound and outbound volumes.
- Inbound passengers in 2025: 26.4 million (22.82 million domestic, 3.58 million international)
- Outbound passengers in 2025: 26.32 million (22.79 million domestic, 3.53 million international)
| Passenger Flow: Inbound vs Outbound (2019-2025) | ||||
|---|---|---|---|---|
| Year | Domestic Inbound (in Millions) | Domestic Outbound (in Millions) | International Inbound (in Millions) | International Outbound (in Millions) |
| 2019 | 23.09 | 23.02 | 2.87 | 2.86 |
| 2020 | 9.32 | 9.37 | 0.69 | 0.66 |
| 2021 | 17.23 | 17.25 | 0.85 | 0.82 |
| 2022 | 20.80 | 20.78 | 2.20 | 2.19 |
| 2023 | 22.59 | 22.50 | 2.93 | 2.87 |
| 2024 | 23.06 | 23.02 | 3.31 | 3.28 |
| 2025 | 22.82 | 22.79 | 3.58 | 3.53 |
Source · Port of Seattle, Airport Statistics
What is the total number of aircraft operations at Seattle-Tacoma International Airport each year?
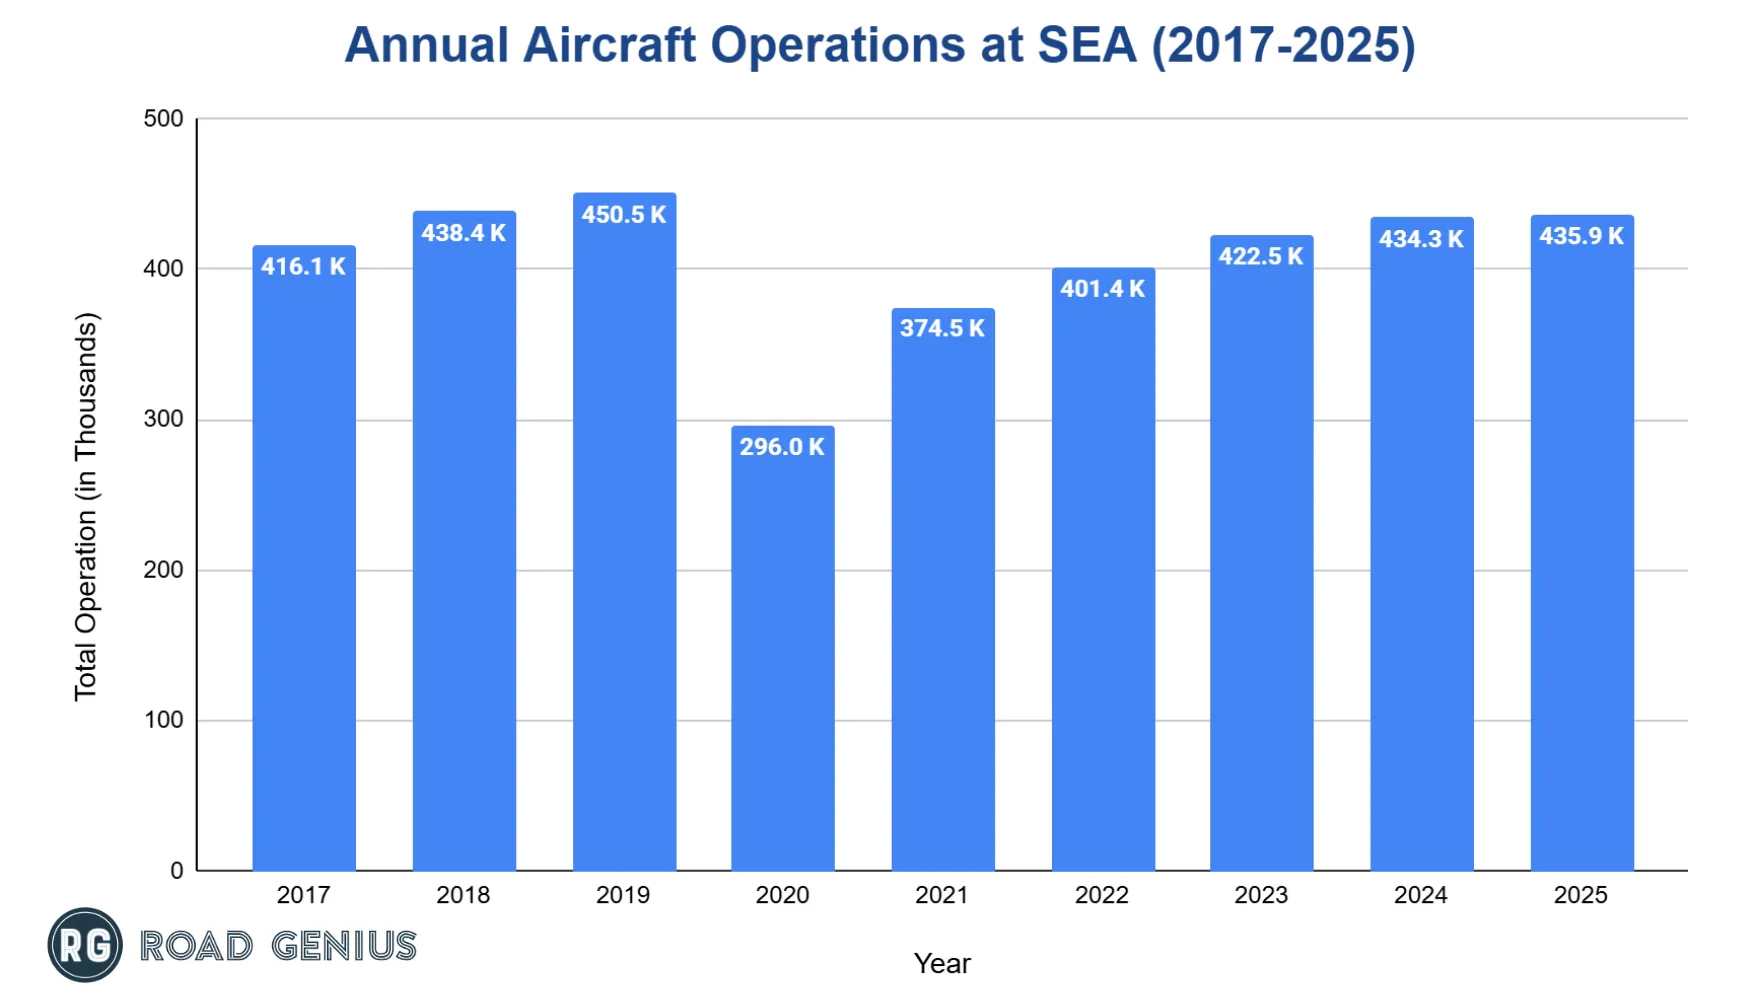
Seattle-Tacoma International Airport records over 400,300 total aircraft operations (takeoffs and landings) each year.
- SEA logged 435,896 takeoffs and landings in 2025, up from 434,321 in 2024.
- Operations remain 3.2% below the 2019 peak of 450,487 but have climbed steadily from the pandemic low of 296,048 in 2020.
- Activity rose to 374,510 in 2021 and 422,497 in 2023.
Aircraft Operations by Type
- Most operations at Seattle-Tacoma International Airport were carried out by air carriers, totaling 430,644 movements in 2025.
- Additionally, air taxi operations made up 4,077 movements, whilegeneral aviation contributed 1,143 and military flights accounted for 32 operations.
| Aircraft Operations at SEA International Airport by Type (2019-2025) | ||||
|---|---|---|---|---|
| Year | Air Carrier | Air Taxi | General Aviation | Military |
| 2019 | 443,817 | 4,456 | 2,135 | 79 |
| 2020 | 290,130 | 3,899 | 1,848 | 171 |
| 2021 | 368,872 | 4,254 | 1,328 | 56 |
| 2022 | 395,997 | 3,926 | 1,373 | 55 |
| 2023 | 417,346 | 3,795 | 1,308 | 48 |
| 2024 | 428,915 | 4,078 | 1,280 | 48 |
| 2025 | 430,644 | 4,077 | 1,143 | 32 |
Source · Port of Seattle, Airport Statistics
Which airlines operate the most flights out of Seattle-Tacoma International Airport?
Alaska Airlines dominates passenger traffic at Seattle-Tacoma International Airport.
- Alaska Airlines handled the most passengers, with 22.44 million travelers in 2025 and a 42.6% market share.
- Delta Air Lines followed: 10.39 million passengers and 19.7% of the market.
- Horizon Air served 2.92 million passengers, while United Airlines and Skywest, operating as Delta Airlines carried 2.68 million and 2.33 million passengers, respectively.
| Top 10 Airlines at SEA Airport by Passenger Volume (2025) | ||
|---|---|---|
| Airline | Total Passenger (in Millions) | Market Share |
| Alaska Airlines | 22.44 | 42.6% |
| Delta Air Lines | 10.39 | 19.7% |
| Horizon Air | 2.92 | 5.5% |
| United Airlines | 2.68 | 5.1% |
| Delta Connection/Skywest | 2.33 | 4.4% |
| Southwest Airlines | 2.19 | 4.2% |
| American Airlines | 2.06 | 3.9% |
| Alaska/Skywest | 1.39 | 2.6% |
| Hawaiian Airlines | 0.89 | 1.7% |
| Frontier Airlines | 0.54 | 1.0% |
Source · Port of Seattle, Airport Statistics
What are the monthly or seasonal trends in passenger traffic at Seattle-Tacoma International Airport?
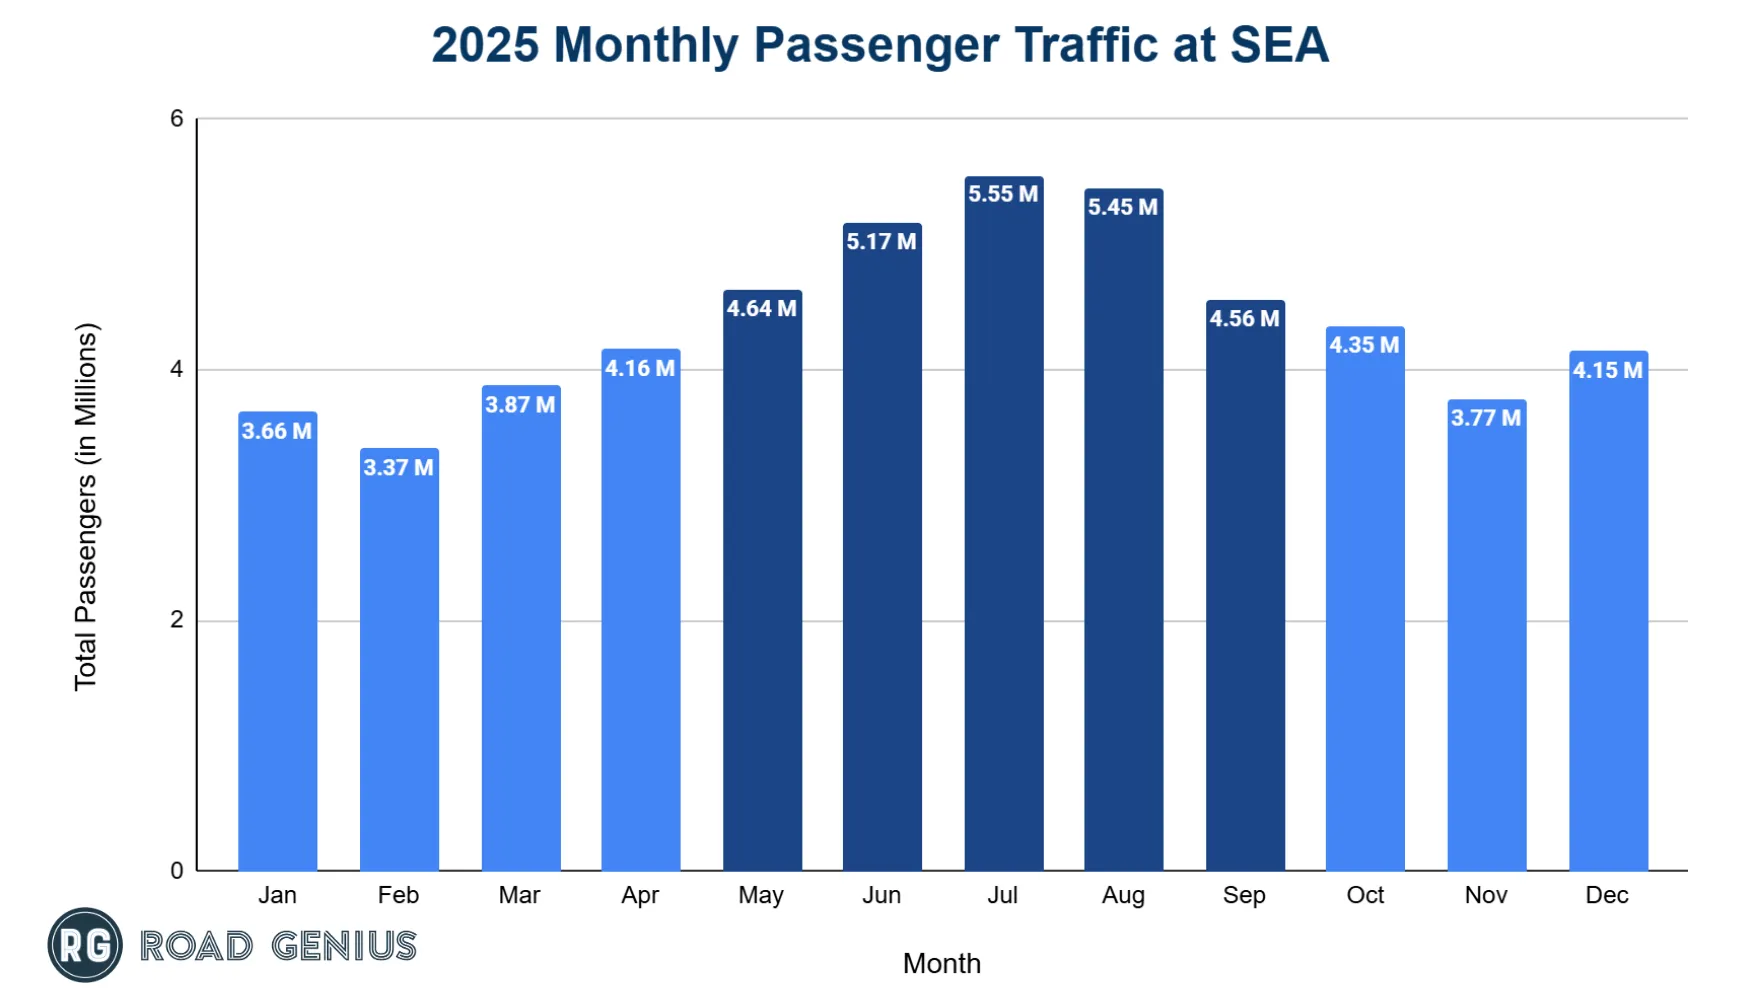
Seattle-Tacoma International Airport traffic fluctuates seasonally. Summer months represent peak travel periods and 2025 sets multiple monthly records.
- The busiest months in 2025 were July (5.55 million passengers), August (5.45 million), and June (5.17 million).
- The least busy months were January (3.66 million) and February (3.37 million passengers).
Which destinations are the most popular from Seattle-Tacoma International Airport?
Seattle-Tacoma International Airport offers connectivity with 129 total destinations, comprising 94 domestic and 35 international routes served by 37 airlines.
Domestic Destinations
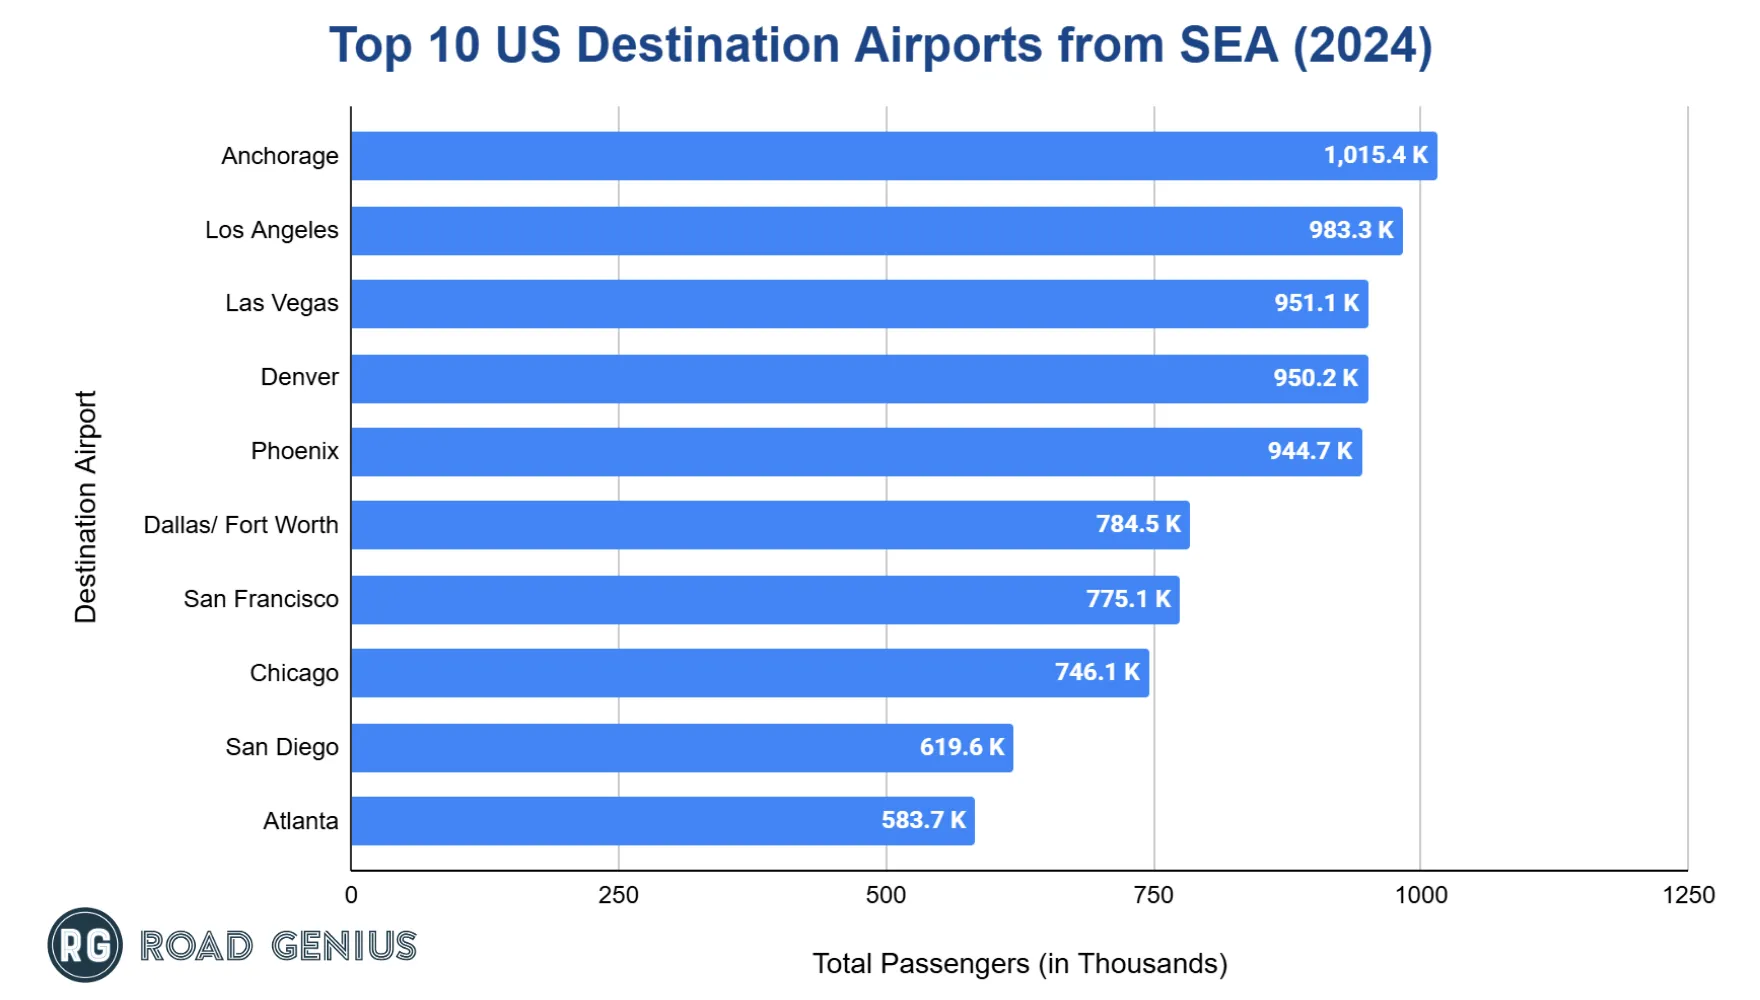
- Anchorage (ANC) was the most frequently served domestic destination at 1.02 million passengers in 2024.
- Los Angeles (LAX) was the destination for 983,250 passengers.
- Las Vegas (LAS) ranked third (951,140 passengers).
- Denver (DEN) and Phoenix (PHX) completed the top five with 950,210 and 944,730 passengers respectively.
International Destinations
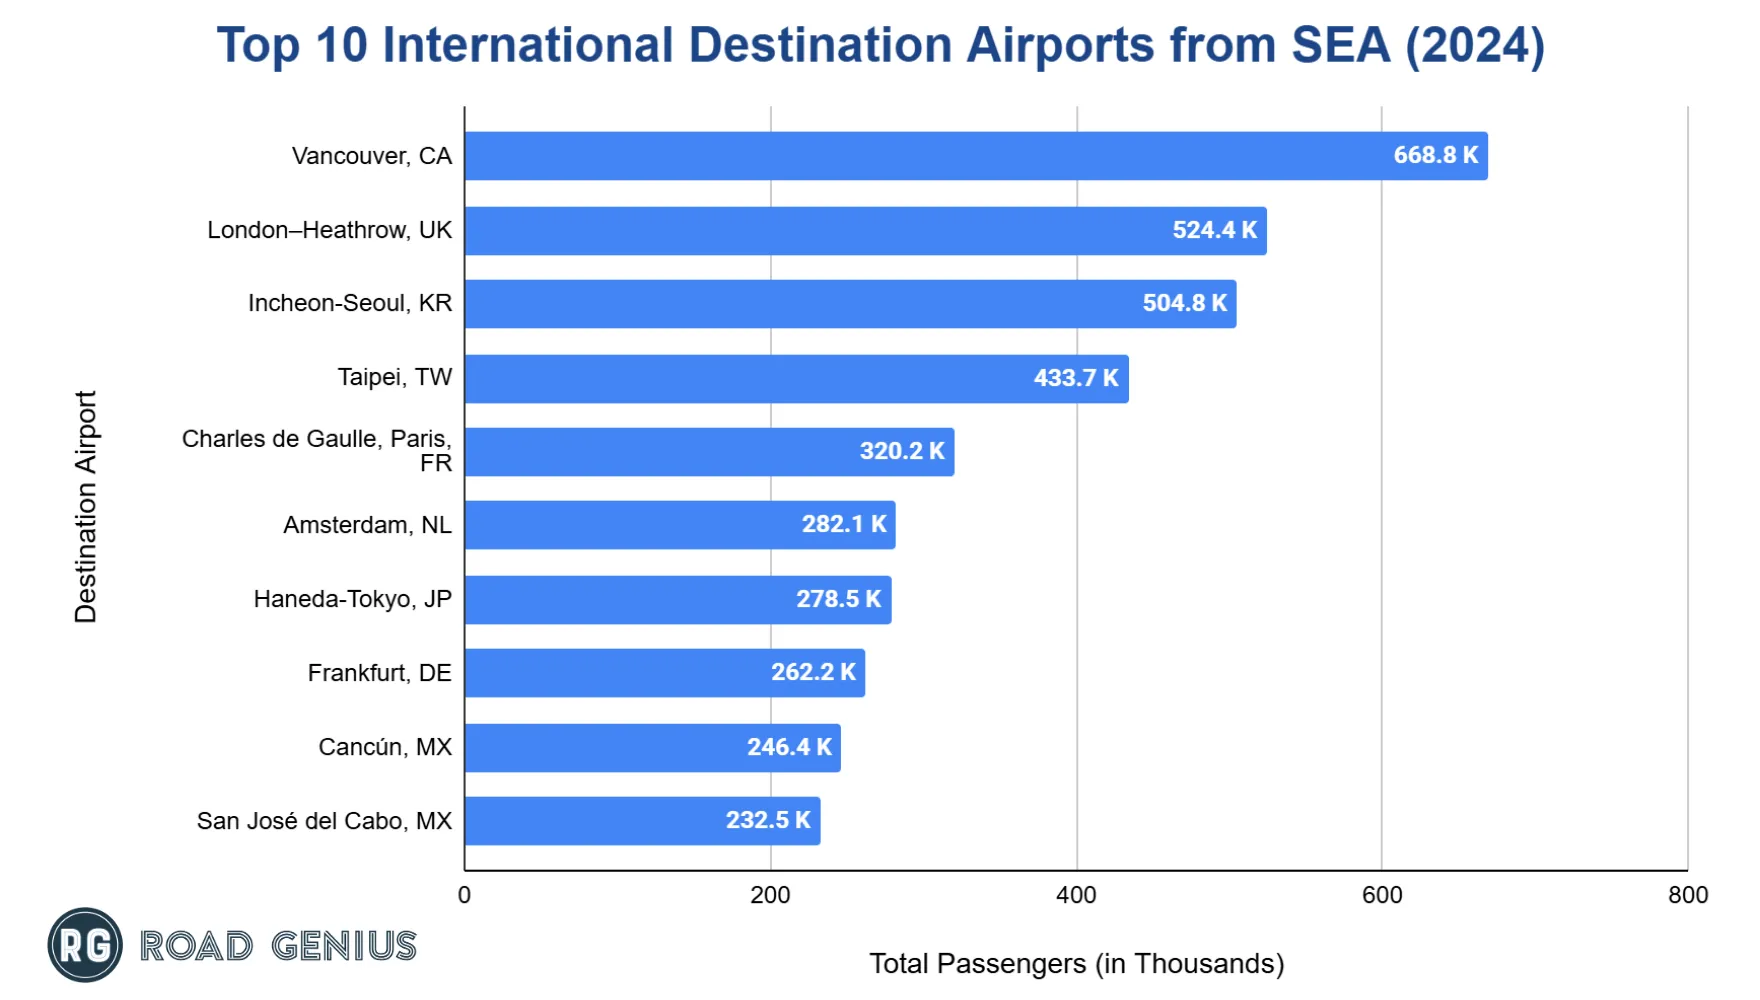
- Vancouver, Canada (YVR) led international destinations at 668,816 passengers in 2024.
- London, United Kingdom (LHR), and Incheon-Seoul, South Korea (ICN), ranked next with 524,399 and 504,758 travelers, respectively.
- Taipei, Taiwan (433,653) and Charles de Gaulle, Paris, France (320,173) complete the top five international destinations.
How much cargo does Seattle-Tacoma International Airport handle annually?
Seattle-Tacoma International Airport handles over 400,000 metric tons of cargo annually.
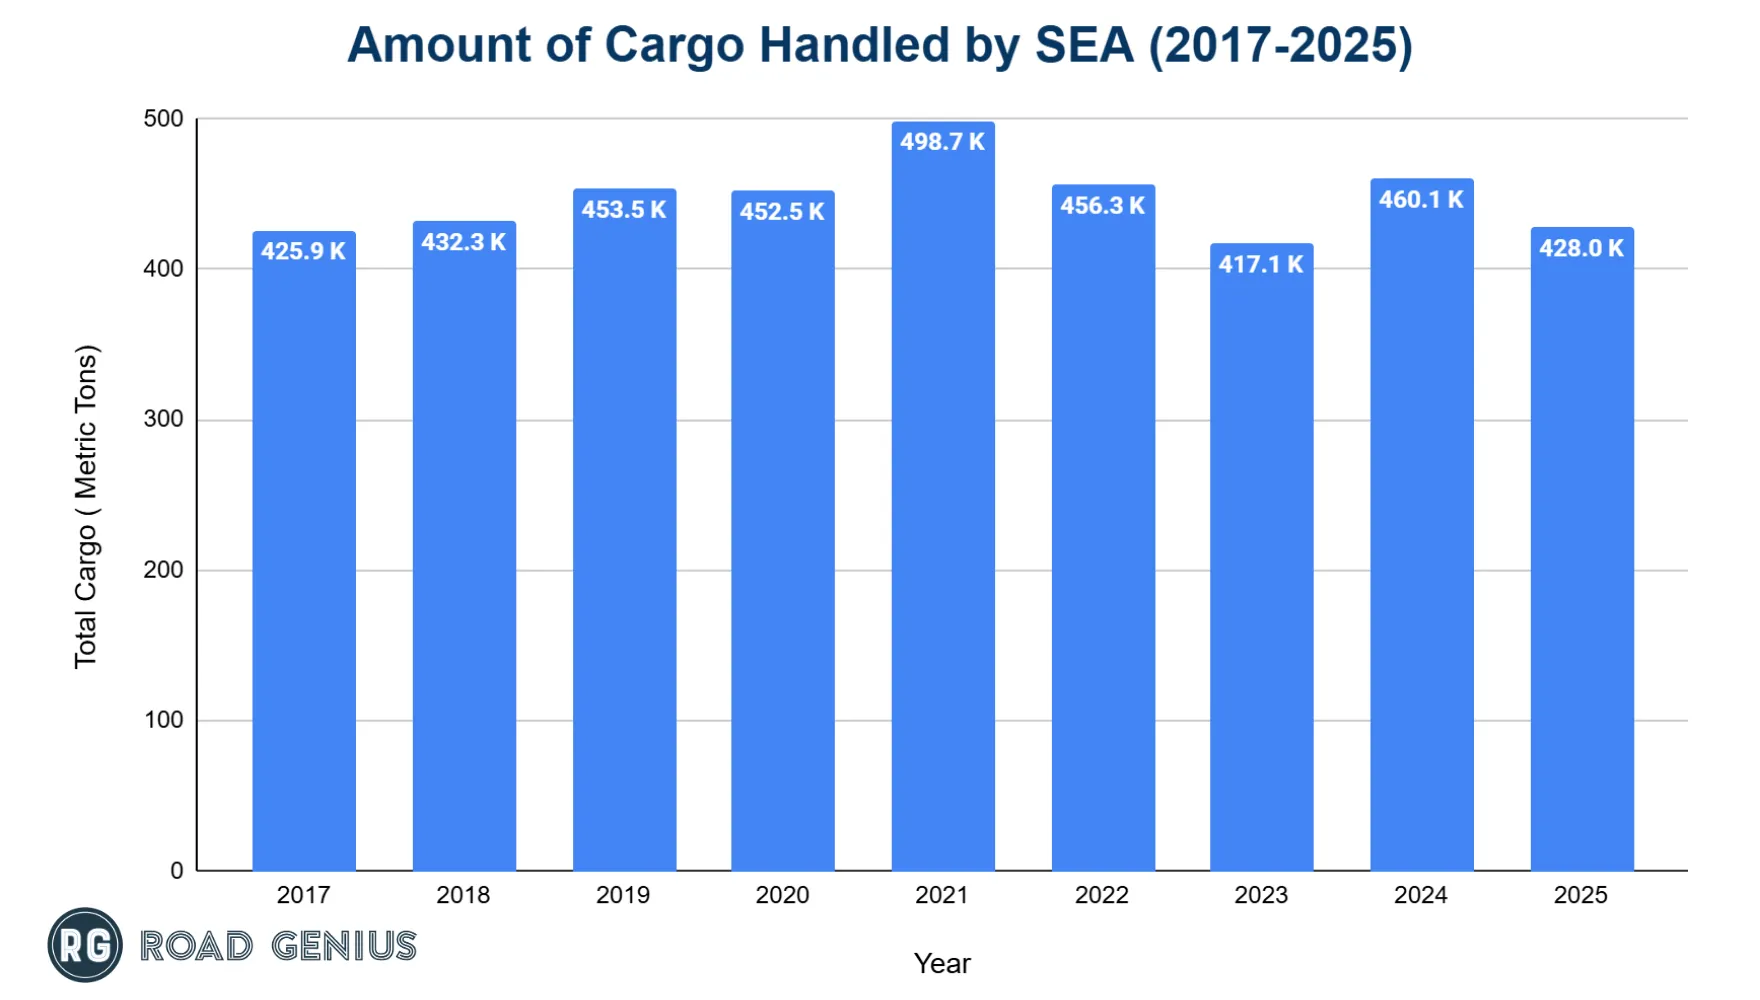
- SEA moved 427,971 metric tons of cargo in 2025, a 7.0% decrease over 2024, when 460,065 metric tons were handled.
- The 2021 peak reached 498,741 metric tons during the pandemic e-commerce surge, which then dropped by 8.5% to 456,289 metric tons in 2022 and further dropped to 417,124 metric tons in 2023.
- Pre-pandemic 2019 volume was 453,547 metric tons and remained nearly flat at 452,496 metric tons in 2020.
How many delays or cancellations occurred at Seattle-Tacoma International Airport in the last year?
- On-time departures: 78 % in 2024 (down from 82 % in 2023).
- On-time arrivals: 79 % in 2024 (down from 83 % in 2023).
- Average departure delay: 54.72 minutes, an improvement over 57.03 minutes in 2023
- Average arrival delay: 58.18 minutes, better than 61.59 minutes in 2023
- Cancellation rate: 1.11 % in 2024, up from 0.60 % in 2023
How much revenue has Seattle-Tacoma International Airport generated each year?
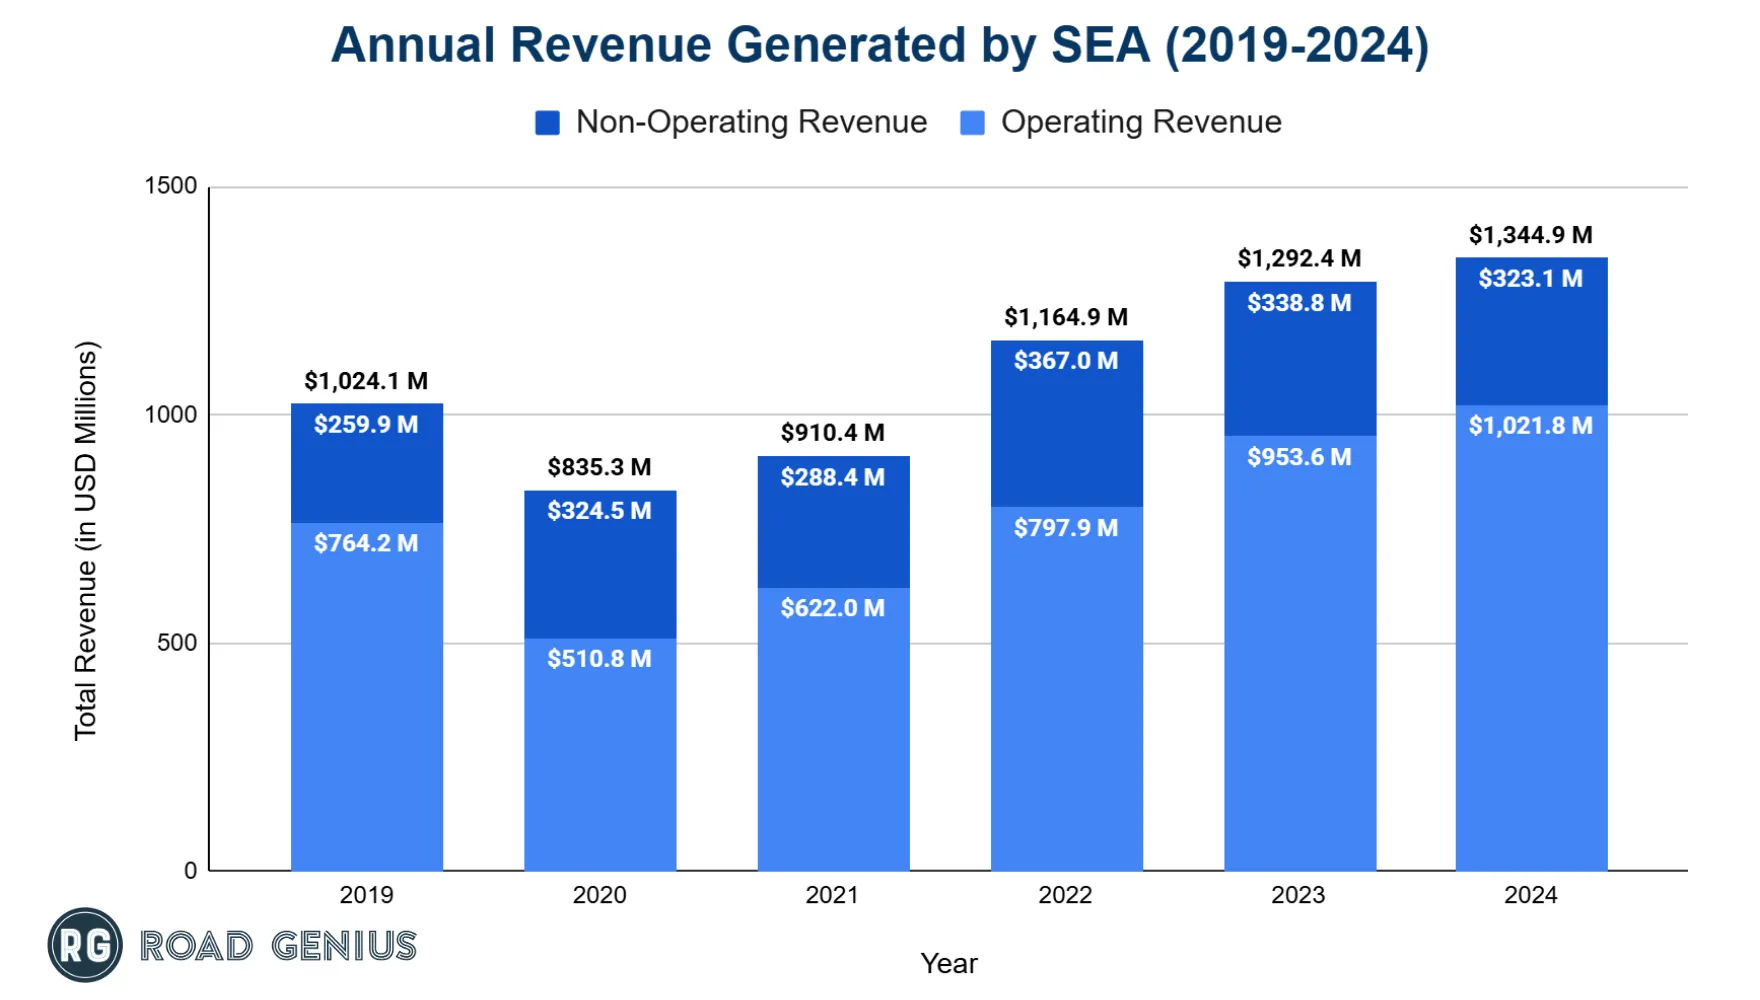
Seattle-Tacoma International Airport (SEA) earns over $1 billion in total revenue annually.
- The airport generated $1.02 billion in total revenue in 2019, which fell by 18.4% to $835.3 million in 2020 due to the pandemic.
- Revenue reached $1.34 billion in 2024, marking a 4.1% year-over-year increase and the highest total revenue recorded in the six-year span.
More Statistics
- Appleton International Airport Statistics
- Aspen/Pitkin County Airport Statistics
- Baltimore/Washington Airport Statistics
- Eastern Iowa Airport Statistics
- Detroit Metropolitan Airport Statistics
- Fayetteville Regional Airport Statistics
- Ithaca Tompkins International Airport Statistics
- Missoula Montana Airport (MSO) Statistics
- Eppley Airfield (OMA) Statistics
- Portland International Jetport Statistics
- Raleigh-Durham International Airport Statistics
- Santa Fe Regional Airport Statistics
Major Incidents at Seattle-Tacoma International Airport
- Nov 30 1947: Alaska Airlines Flight 9 overshot the runway in fog, killing nine
- Apr 2 1956: Northwest Orient Flight 2 ditched in Puget Sound, five deaths
- Nov 24 1971: Hijacker “D. B. Cooper” parachuted from Northwest Flight 305 with $200,000 and was never found
- Dec 26 1974: Harbor Airlines Flight 308 crashed due to a pitot tube blockage, four deaths
- Jan 20 1983: Hijacker killed aboard Northwest Flight 608 in Portland, no explosives found
- Apr 15 1988: Horizon Air Flight 2658 caught fire on landing, four injuries, aircraft destroyed
- Aug 10 2018: Horizon Air employee stole a Q400 and crashed on Ketron Island
- Aug 24 2024: Cyberattack crippled SEA’s systems causing major delays until the website was restored in November
References
- Port of Seattle — Current and Historic Traffic and Operations Statistics, Seattle-Tacoma International Airport · portseattle.org
- International Destinations of Passengers from Raleigh-Durham International Airport · data.transportation.gov
- BTS TranStats — Airport profiles (route information by airport) · transtats.bts.gov
- Incidents at Jackson–Medgar Wiley Evers International Airport — NTSB · ntsb.gov

