

 Popular Countries
 24/7 Support
Published Sep 9, 2026
Aspen/Pitkin County Airport (ASE), also known as Sardy Field, is Colorado's busiest mountain airport and the main gateway to Aspen and the Snowmass ski resorts. Located at an elevation of 7,820 feet in the Rocky Mountains, the airport connects Aspen to destinations across the United States through multiple partner airlines, and is among the nation's busiest airports for private aviation.
How many passengers pass through Aspen/Pitkin County Airport each year?
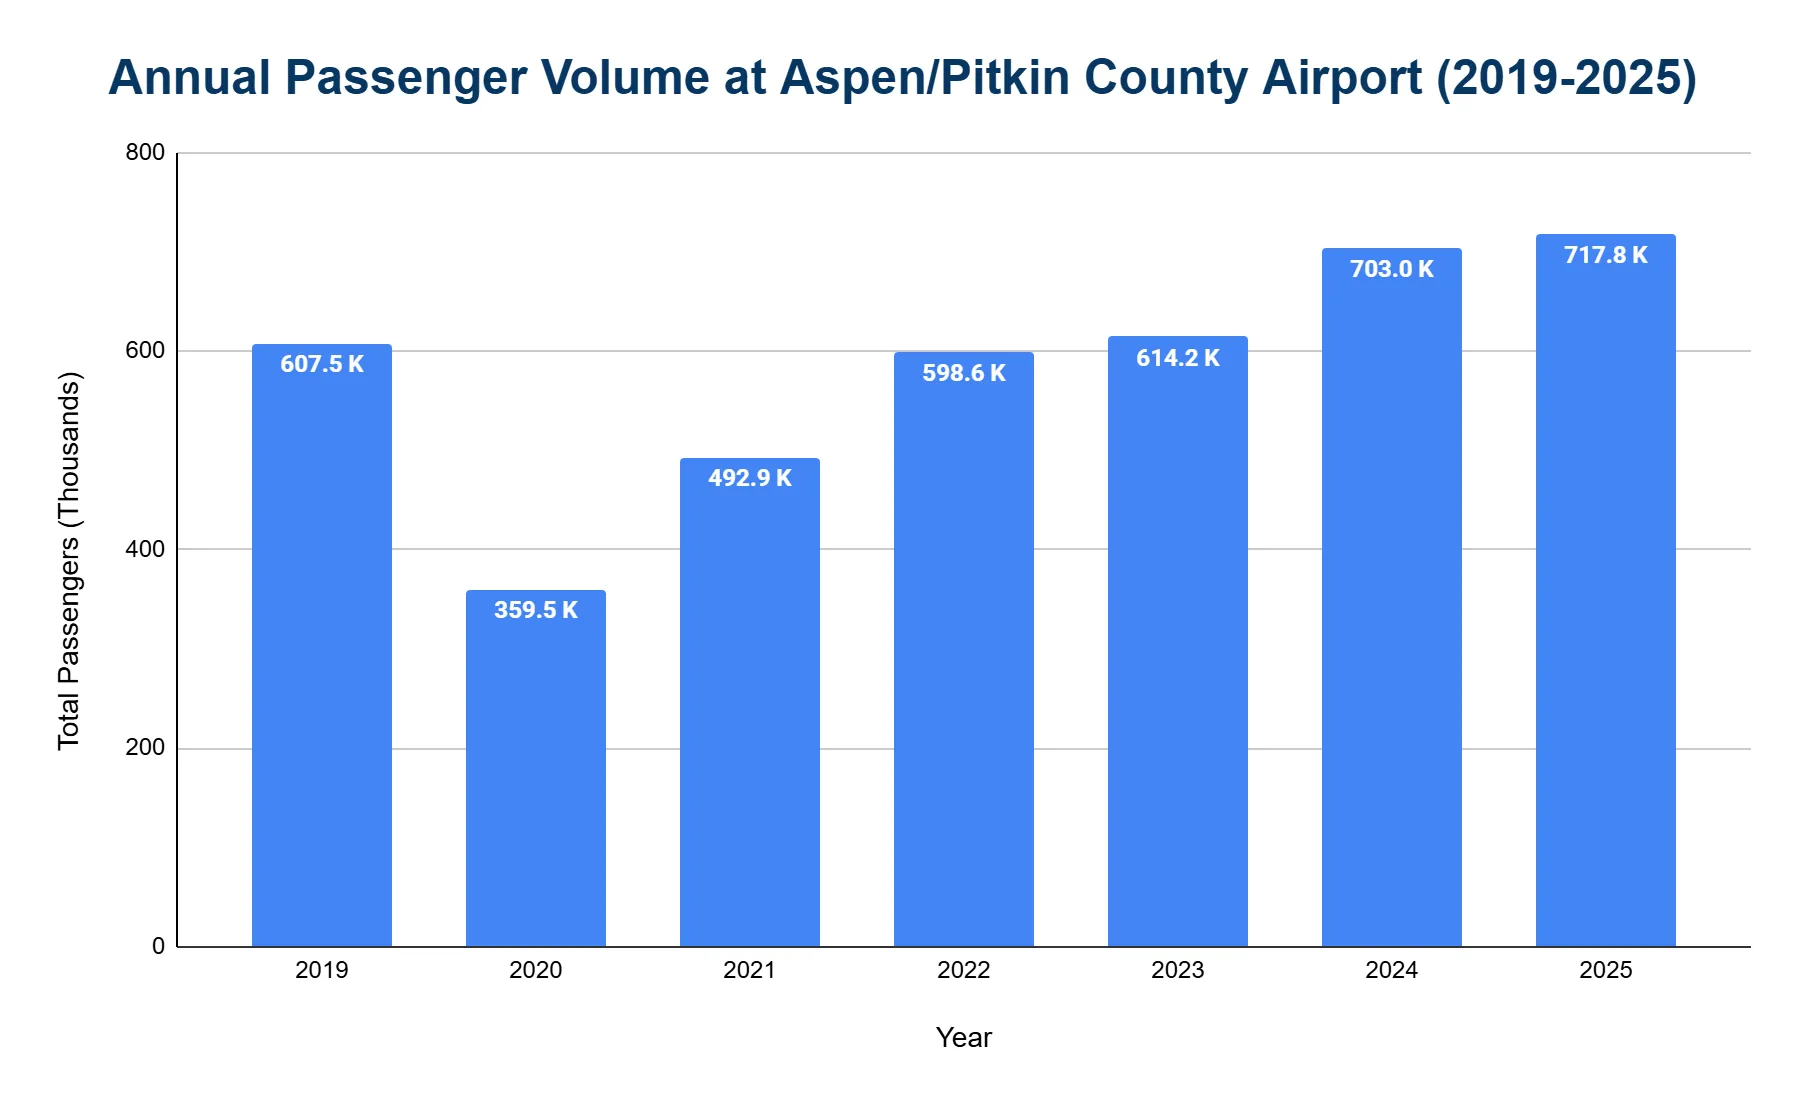
Aspen/Pitkin County Airport handles approximately 700,000 passengers annually.
- The airport served 717,784 passengers in 2025, a 2% increase from 702,962 in 2024, setting a new record.
- In 2019, passenger volume reached 607,527 before dropping due to the pandemic.
- Traffic declined to 359,481 in 2020 (a 41% decrease).
- It rebounded in 2021 to 492,936 passengers.
- The upward trend continued with 598,644 in 2022 and 614,166 in 2023.
What is the total number of aircraft operations at Aspen/Pitkin County Airport each year?
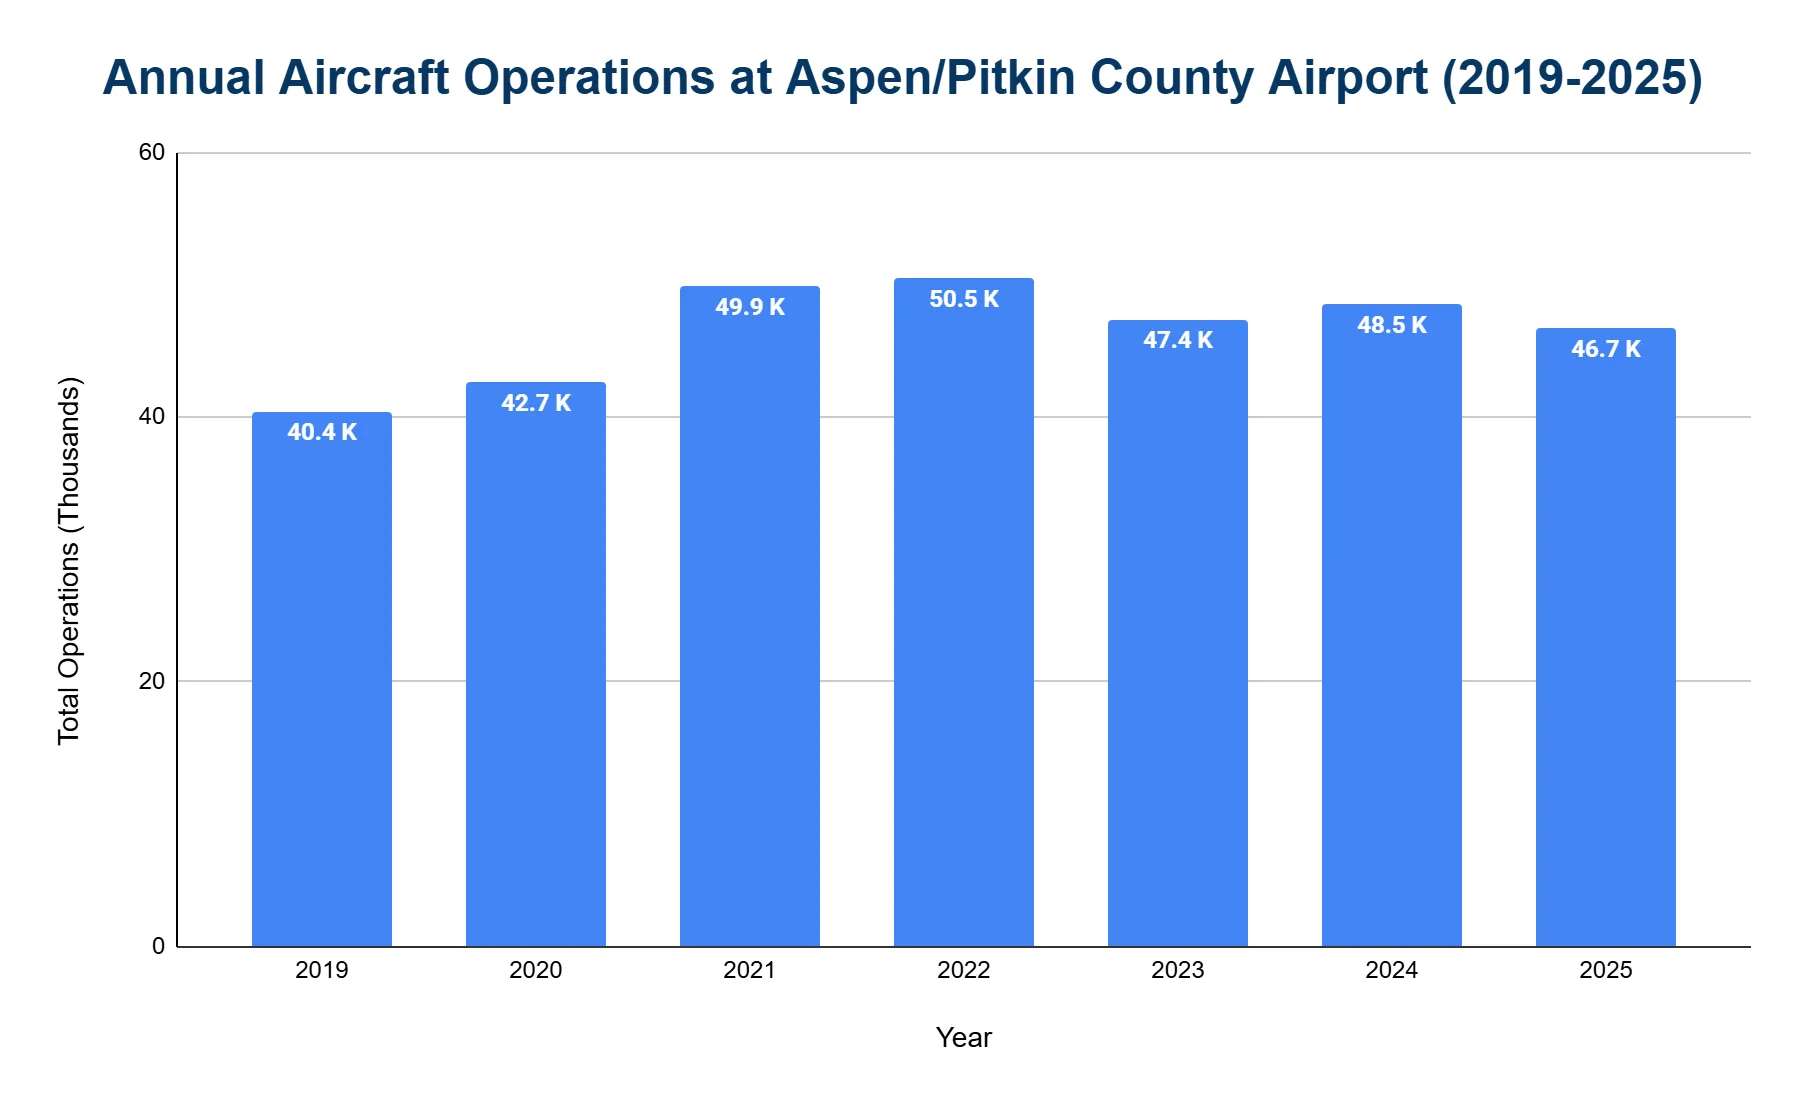
The airport averages around 48,000 aircraft takeoffs and landings annually, with the majority being private and charter flights.
- There were 46,740 total aircraft movements in 2025, a 3.6% decrease from 48,502 movements in 2024
- In 2019, movements totaled 40,413.
- Despite the pandemic, 2020 saw an increase to 42,664, reflecting a surge in private aviation.
- 2021 recorded 49,899 operations, peaking at 50,523 in 2022 (a 25% increase from 2019).
- Activity moderated slightly in 2023 to 47,385 movements.
What are the monthly trends in passenger traffic at Aspen/Pitkin County Airport?
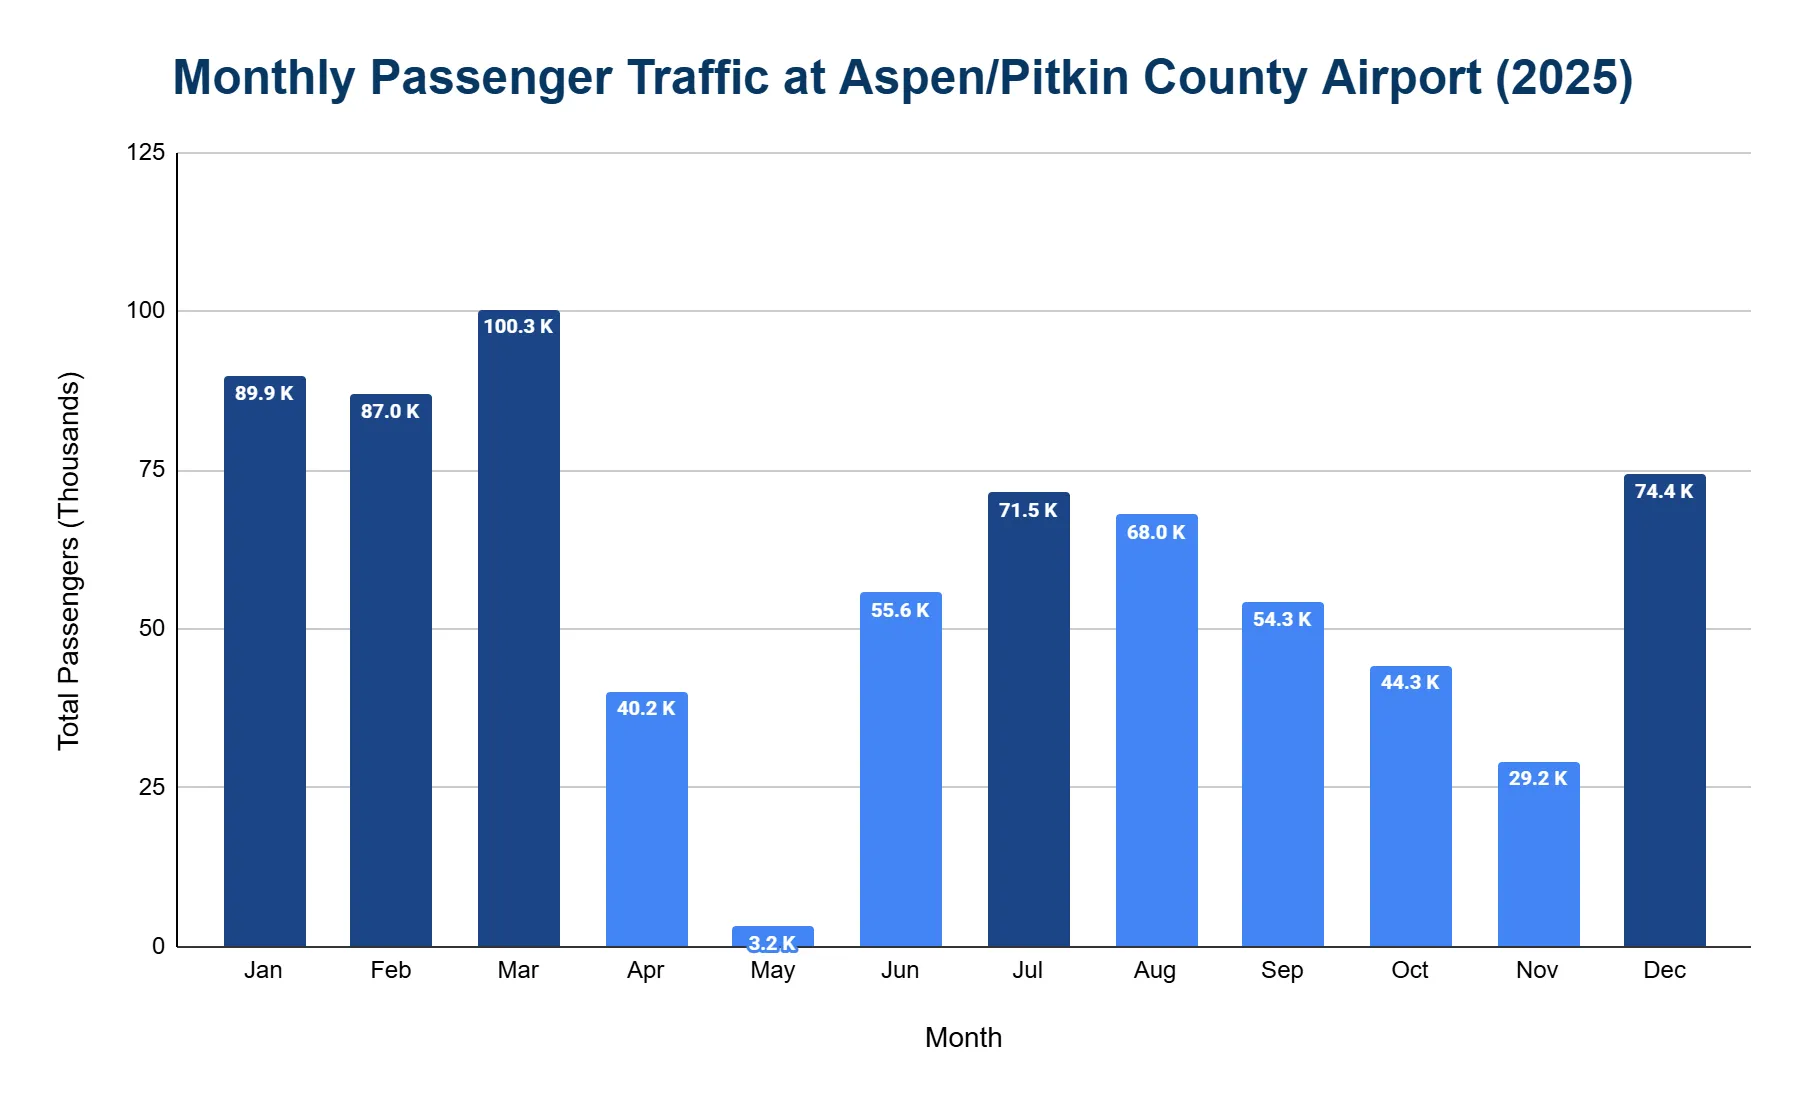
- March recorded the highest volume with 100,272 passengers, reflecting peak ski season tourism.
- January followed with 89,851 passengers.
- December saw 74,386 passengers, aligning with winter holiday travel peaks.
- May was the slowest month, with only 3,248 passengers. This aligns with the "mud season," when both winter and summer tourism slow down.
- April and November were also low-traffic months, with 40,154 and 29,204 passengers respectively.
How many routes are there at Aspen/Pitkin County Airport?
The airport serves about 11 nonstop destinations via three main airlines. All flights are domestic.
- The route network connects to major hubs including Denver, Dallas/Fort Worth, Chicago, Houston, Atlanta, and Los Angeles, allowing one-stop access to broader domestic and international destinations.
- There are no international flights as the airport lacks customs facilities and the runway cannot accommodate long-haul aircraft.
Which destinations are the most popular from Aspen/Pitkin County Airport?
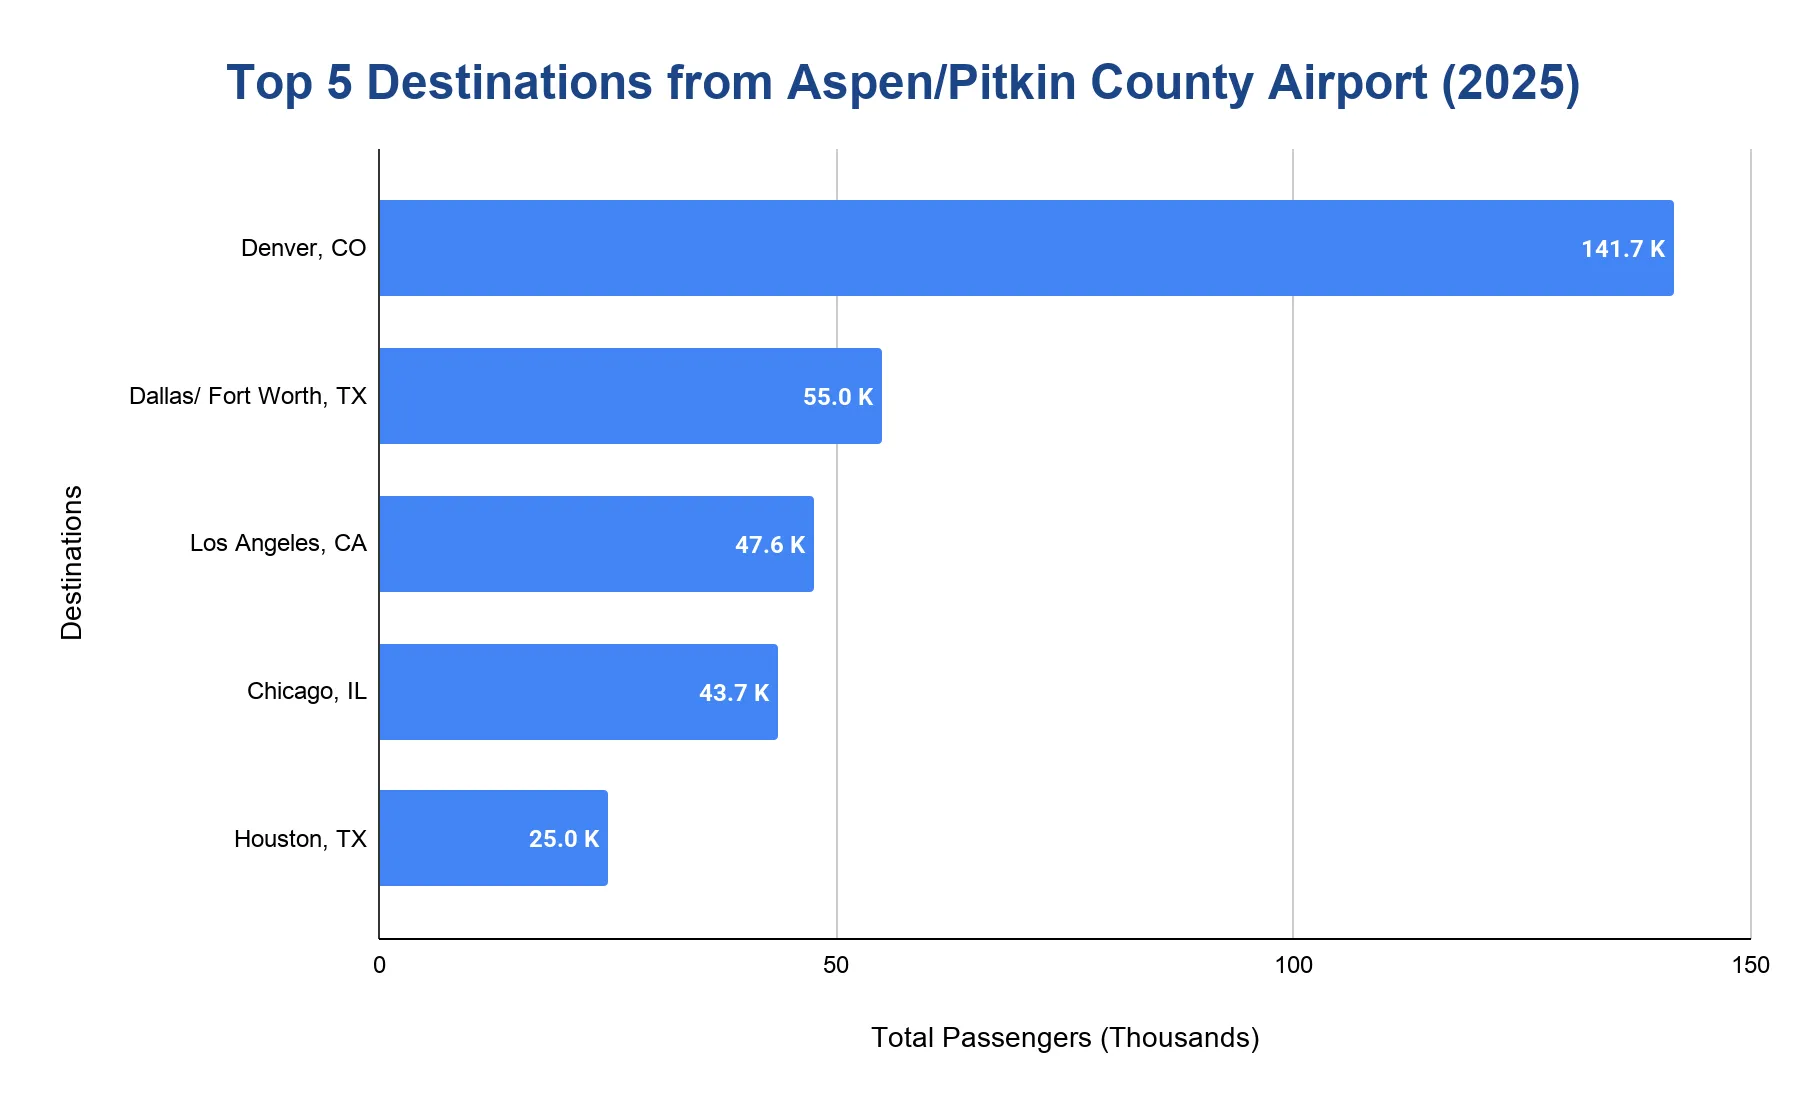
- Denver, CO (DEN) carried 141,720 passengers in 2025, making it by far the busiest route - accounting for approximately 20% of all passenger traffic.
- Dallas/Fort Worth, TX (DFW) served 55,000 passengers, maintaining its position as the second-busiest route with strong Texas-Aspen leisure travel.
- Los Angeles, CA (LAX) handled 47,620 passengers, providing essential West Coast connectivity.
- Chicago, IL (ORD) served 43,700 passengers and Houston, TX (IAH) handled 25,030 passengers, completing the top 5 domestic destinations.
How much cargo does Aspen/Pitkin County Airport handle annually?
- The airport handles relatively low cargo volumes, with about 250 to 350 tons of freight per year.
How many cancellations occur at Aspen/Pitkin County Airport annually?
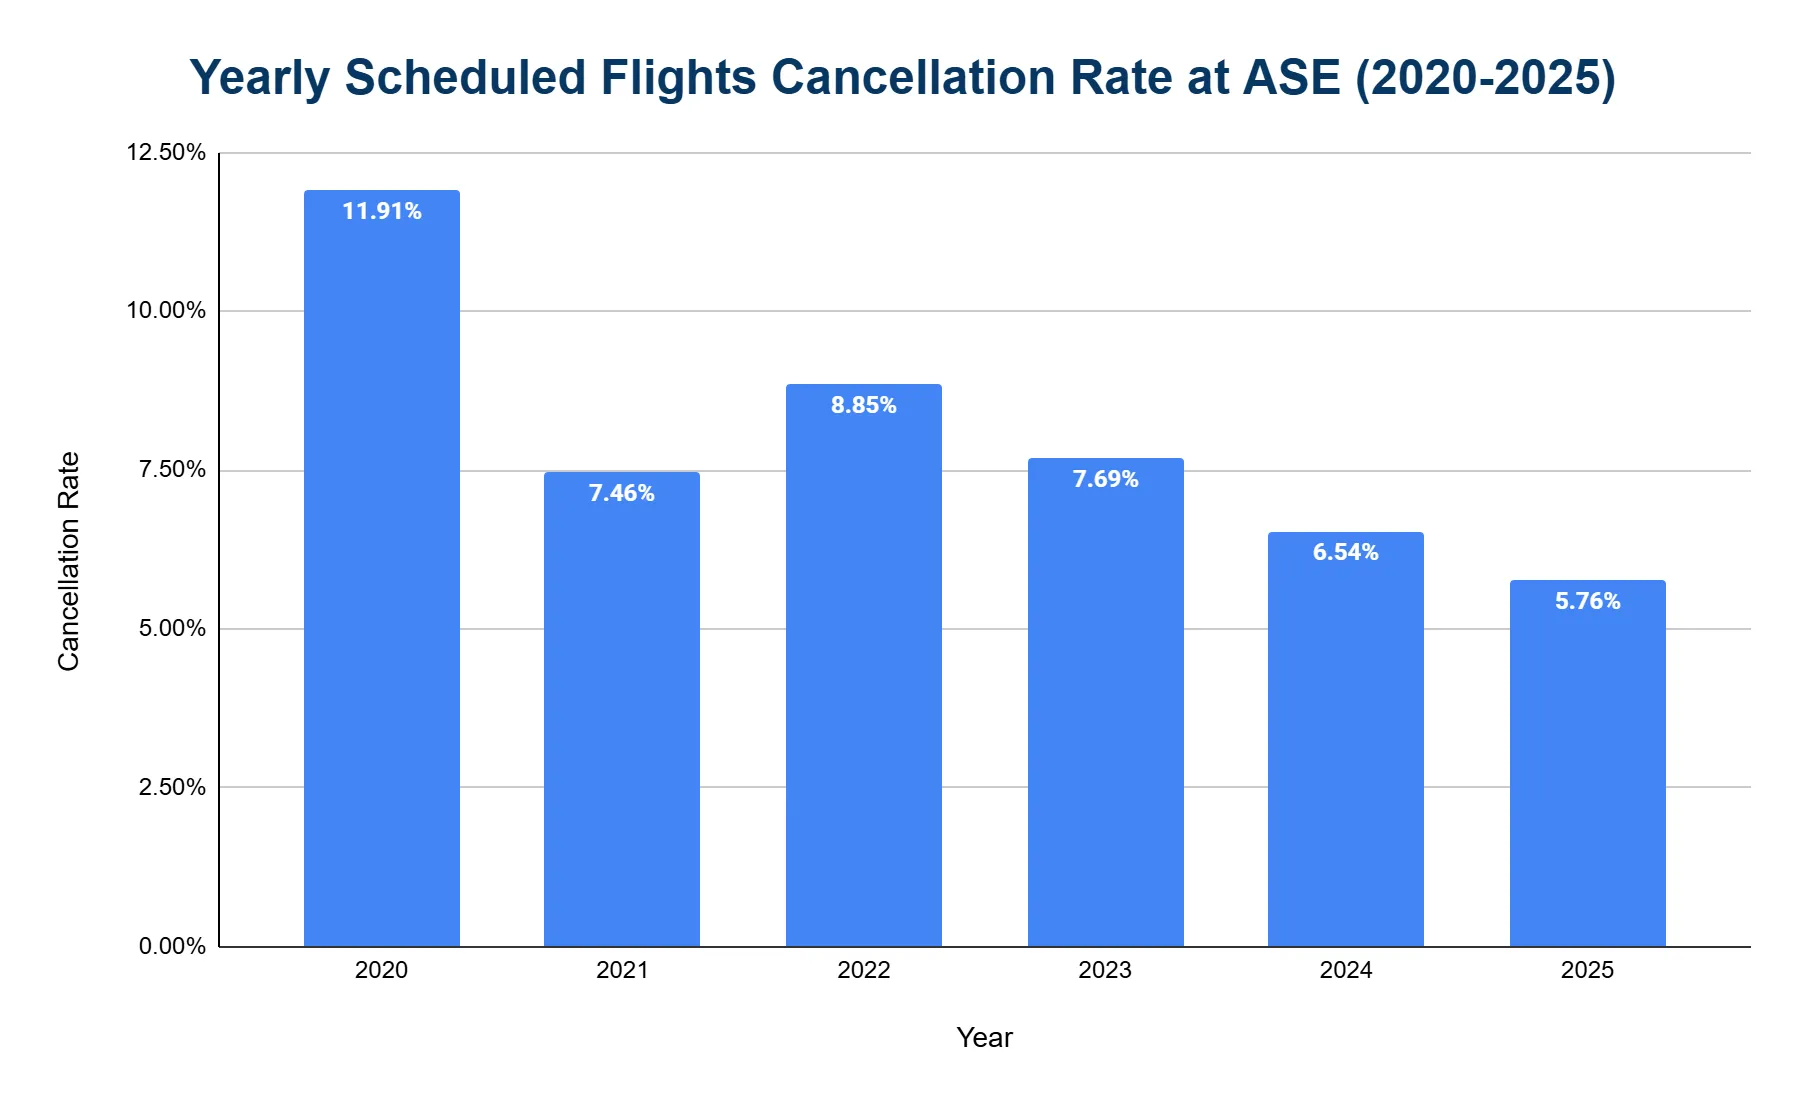
ASE experiences a higher-than-average cancellation rate due to its mountainous location and operational limits, though performance has improved.
- In 2025, the cancellation rate was 5.76%, the lowest rate in five years.
- The highest cancellation rate was in 2020, at 11.91%, during peak pandemic disruptions.
- The rate improved to 7.46% in 2021.
- It increased slightly to 8.85% in 2022, reflecting staffing shortages and weather-related issues.
- In 2023 and 2024, the rate was 7.69% and 6.54% respectively, showing continued improvement.
What are the main causes of flight disruptions at Aspen/Pitkin County Airport?
- Mountain weather, including fog, low visibility, strong winds and snow.
- Tailwind landing limits, due to the airport’s one-way layout.
- Runway capacity, since only one aircraft can operate at a time, and private jet traffic often delays scheduled flights.
- Night curfew at 11:00 PM, which forces late flights to divert.
- Weather at hub airports like Denver and Dallas, which can delay Aspen-bound flights.
- Aircraft weight restrictions, especially on hot days at high elevation.
Related Travel Statistics
- Burlington Airport (BTV) Statistics
- St. Pete-Clearwater Airport Statistics
- Detroit Metropolitan Airport Statistics
- Huntsville Airport (HSV) Statistics
- Jackson Airport (JAN) Statistics
- Jacksonville International Airport Statistics
- Midway International Airport Statistics
- Newark Airport (EWR) Statistics
- Peoria Airport (PIA) Statistics
- Pittsburgh Airport (PIT) Statistics
- Chicago Rockford Airport Statistics
- San Francisco International Airport Statistics
What is the on-time performance at Aspen/Pitkin County Airport?
The airport's on-time performance remains below the national average.
- In 2025, 64% of arrivals and 62% of departures were on time (within 15 minutes of schedule).
What are the notable incidents at Aspen/Pitkin County Airport?
- March 29, 2001 – Gulfstream III Crash: A chartered Gulfstream III crashed on night approach, killing all 18 people on board. The crew descended below minimums without runway visibility. This resulted in restrictions on night instrument approaches.
- January 5, 2014 – Bombardier Challenger 600 Crash: A Challenger 601 flipped and caught fire after landing in unstable conditions with a strong tailwind. One pilot died, two crew were seriously injured. NTSB cited pilot error and lack of local experience.
- February 13, 1991 – Learjet 35A Crash: A Learjet stalled and crashed during a snowy approach, killing all 3 on board. The incident led to improved training for mountain approaches.
- June 7, 2009 – Learjet 60 Runway Overrun: A Lear 60 overran the runway on wet pavement. There were no injuries among the 8 occupants. This led to upgrades in runway surfaces.
References
- Aspen/Pitkin County Airport Passenger Volume · aspenairport.com
- BTS TranStats — Airport profiles (route information by airport) · transtats.bts.gov
- Incidents at Jackson–Medgar Wiley Evers International Airport — NTSB · ntsb.gov

