

 Popular Countries
 24/7 Support
Published Sep 9, 2026
General Wayne A. Downing Peoria International Airport lies 7 miles west of downtown Peoria, Illinois, and serves as Central Illinois' main air gateway. The facility spans more than 3,500 acres with two intersecting runways (4/22 and 13/31), which handle commercial jets and general aviation.
How many passengers use Peoria International Airport each year?
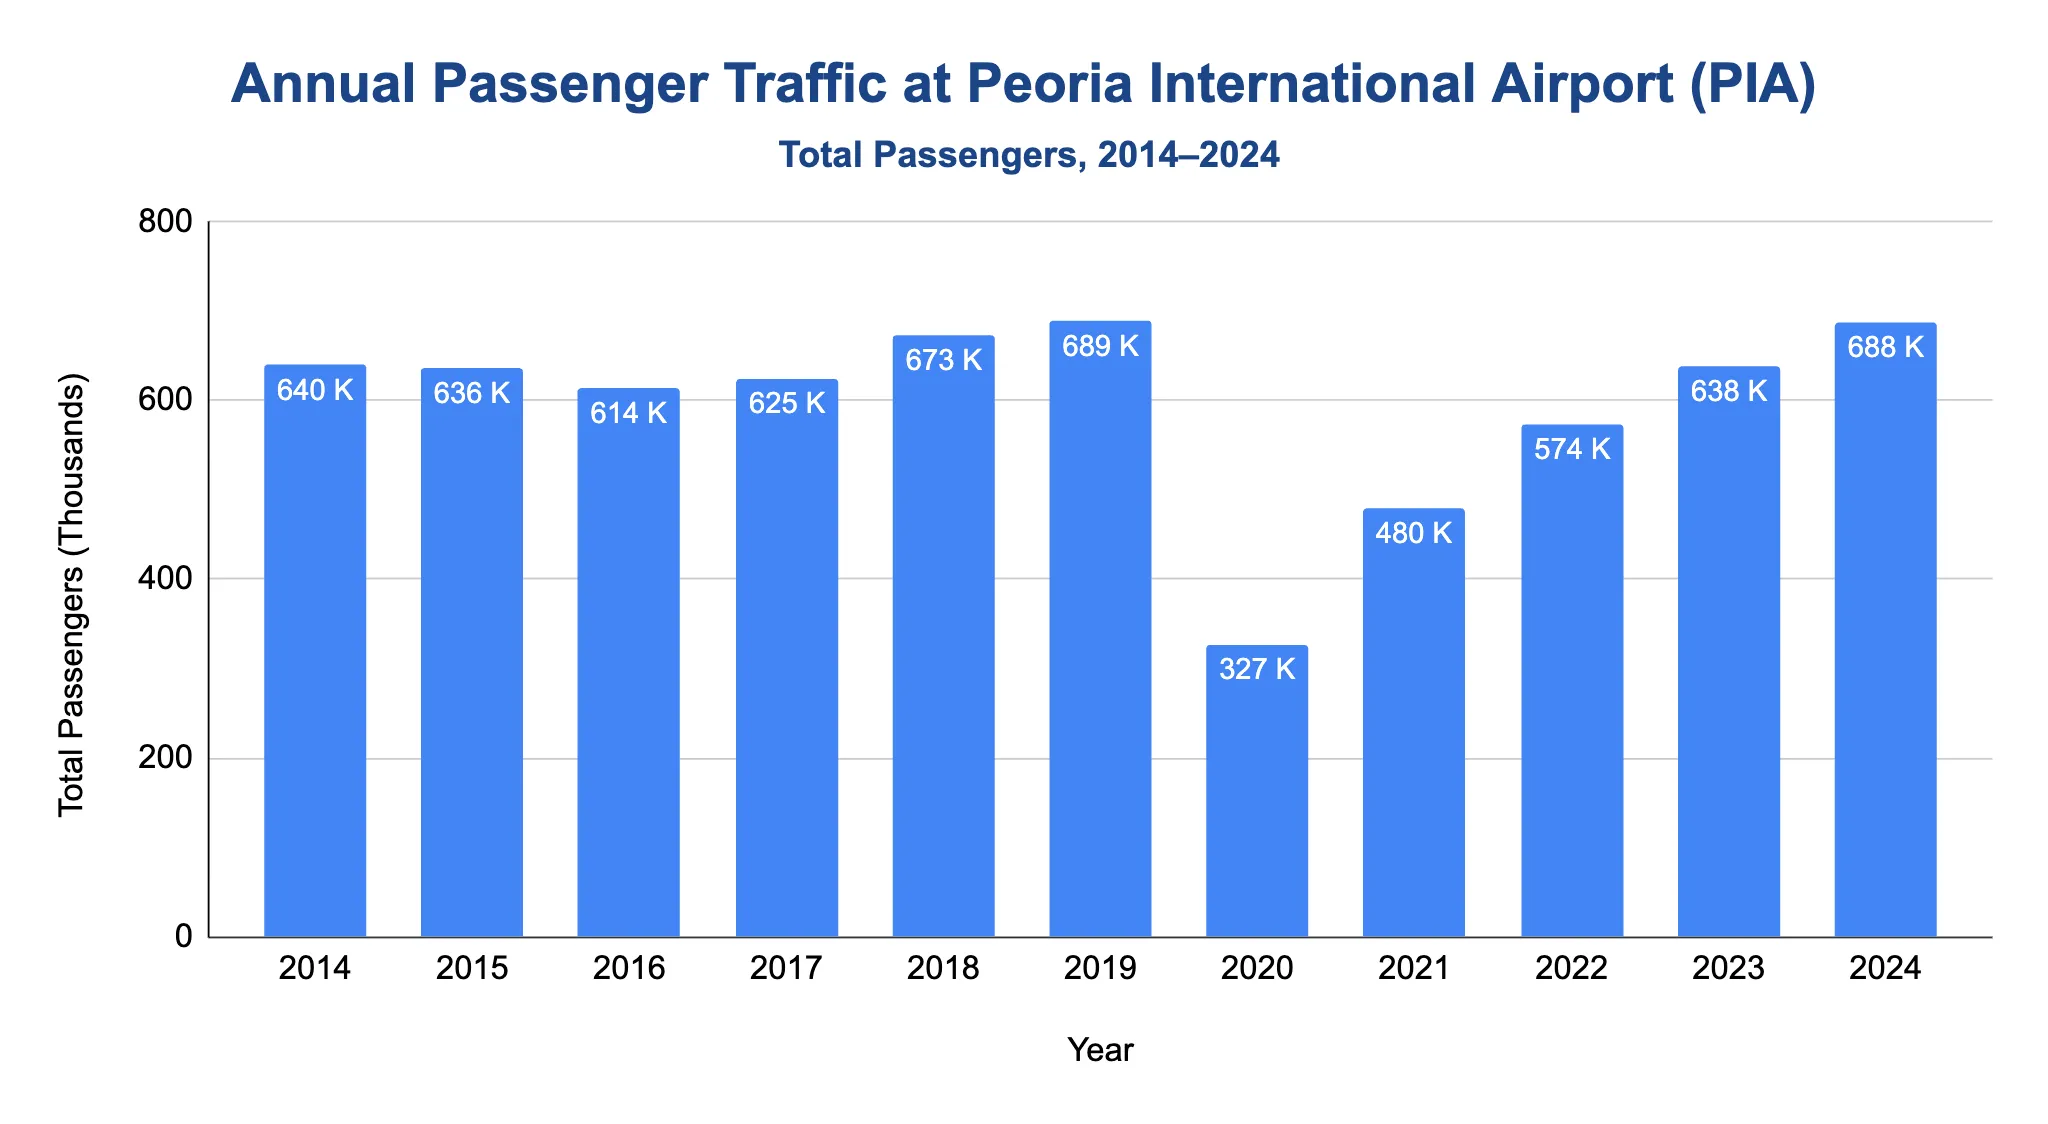
About 680,000 passengers move through PIA annually.
- Traffic peaked at 689,416 in 2019, setting a record before the pandemic hit.
- The total fell to 326,861 in 2020, less than half the previous year.
- Passenger numbers rebounded to 480,006 in 2021, 573,911 in 2022 and 638,378 in 2023.
- By 2024, the count reached 687,601, or 99.7% of the 2019 record.
Note: 2014-2018 data source: FAA; 2019-2024 data source: PIA Airport Authority. Total passenger data = enplanements multiplied by 2.
Does Peoria International Airport handle domestic flights only?
PIA does not offer a scheduled international passenger service.
- The "International" title refers to a customs facility that processes charter flights and cargo shipments requiring U.S. Customs clearance.
How many aircraft operations occur at Peoria International Airport each year?
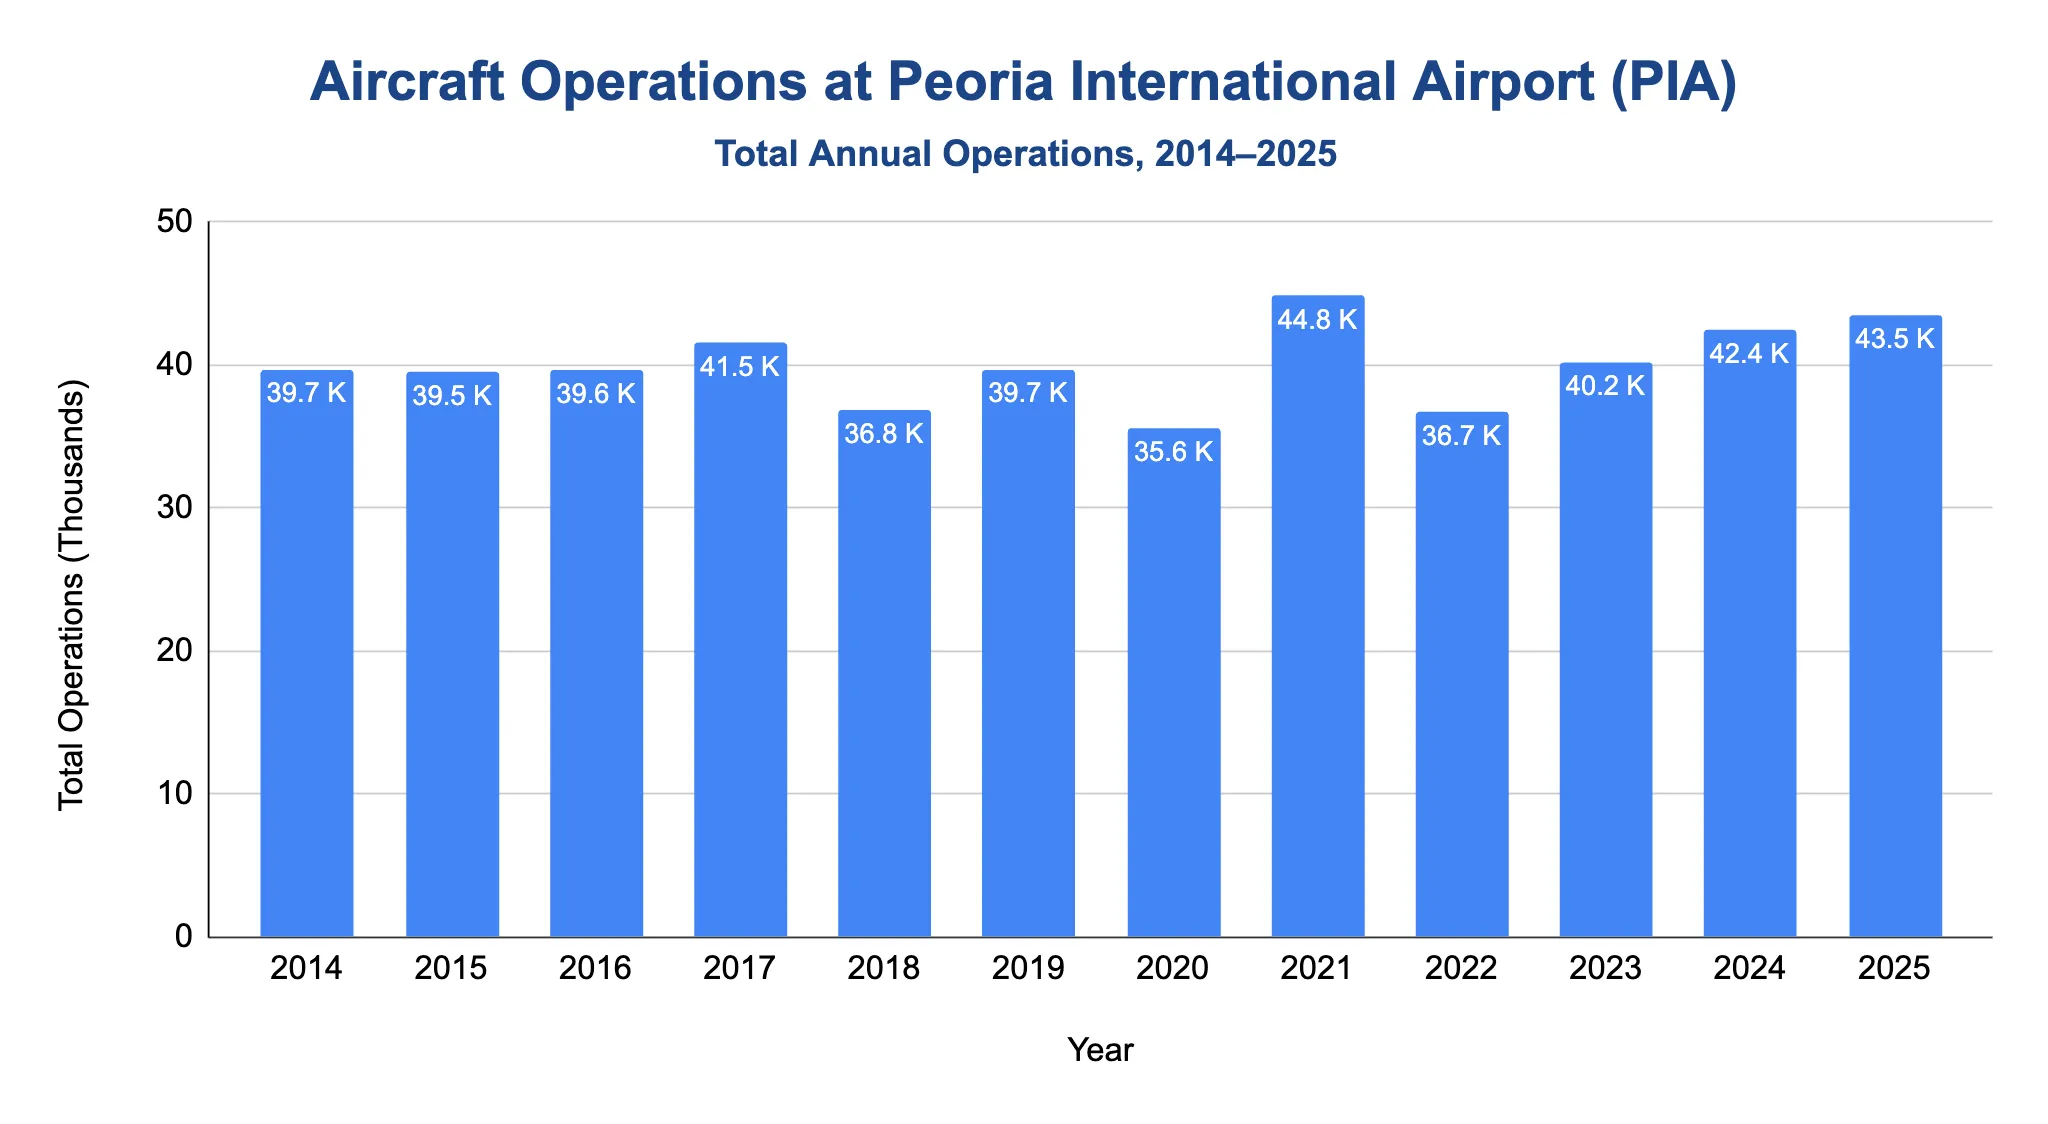
Peoria International Airport recorded 42,389 total aircraft operations in 2024, continuing a gradual stabilization in activity following the pandemic-era disruption.
- From 2014 through 2017, annual operations were consistently close to 40,000, peaking at 41,495 operations in 2017.
- Activity eased in 2018, falling to 36,836 operations, before recovering modestly to 39,696 in 2019.
- During the pandemic, operations declined to 35,588 in 2020, reflecting reduced airline schedules.
- Flight activity rebounded strongly in 2021, reaching 44,801 operations, the highest annual total in the 2014-2025 period.
- From 2022 through 2024, operations normalized, fluctuating between 36,658 and 42,389 as traffic stabilized.
- From January through November 2025, the airport recorded 43,465 operations, already exceeding the full-year total for 2024.
- General aviation accounted for the largest share of operations throughout the period, followed by air carrier, air taxi and military activity.
| Aircraft Operations by Type at PIA | |||||
|---|---|---|---|---|---|
| Year | Air Carrier | Air Taxi | General Aviation | Military | Total Operations |
| 2014 | 2,945 | 14,681 | 11,190 | 4,012 | 39,672 |
| 2015 | 2,463 | 14,398 | 11,893 | 4,473 | 39,501 |
| 2016 | 2,365 | 13,603 | 12,363 | 4,398 | 39,640 |
| 2017 | 3,787 | 12,698 | 11,620 | 3,986 | 41,495 |
| 2018 | 3,946 | 11,659 | 11,128 | 3,200 | 36,836 |
| 2019 | 5,193 | 9,753 | 12,575 | 3,427 | 39,696 |
| 2020 | 4,397 | 5,547 | 11,595 | 3,898 | 35,588 |
| 2021 | 6,183 | 5,070 | 15,402 | 4,686 | 44,801 |
| 2022 | 5,407 | 4,595 | 12,476 | 3,072 | 36,658 |
| 2023 | 5,764 | 5,358 | 12,930 | 3,321 | 40,152 |
| 2024 | 6,199 | 5,912 | 13,549 | 3,108 | 42,389 |
| 2025* | 8,827 | 4,691 | 13,410 | 2,339 | 43,465 |
Source · FAA.
Which airlines carry the most passengers at Peoria International Airport?
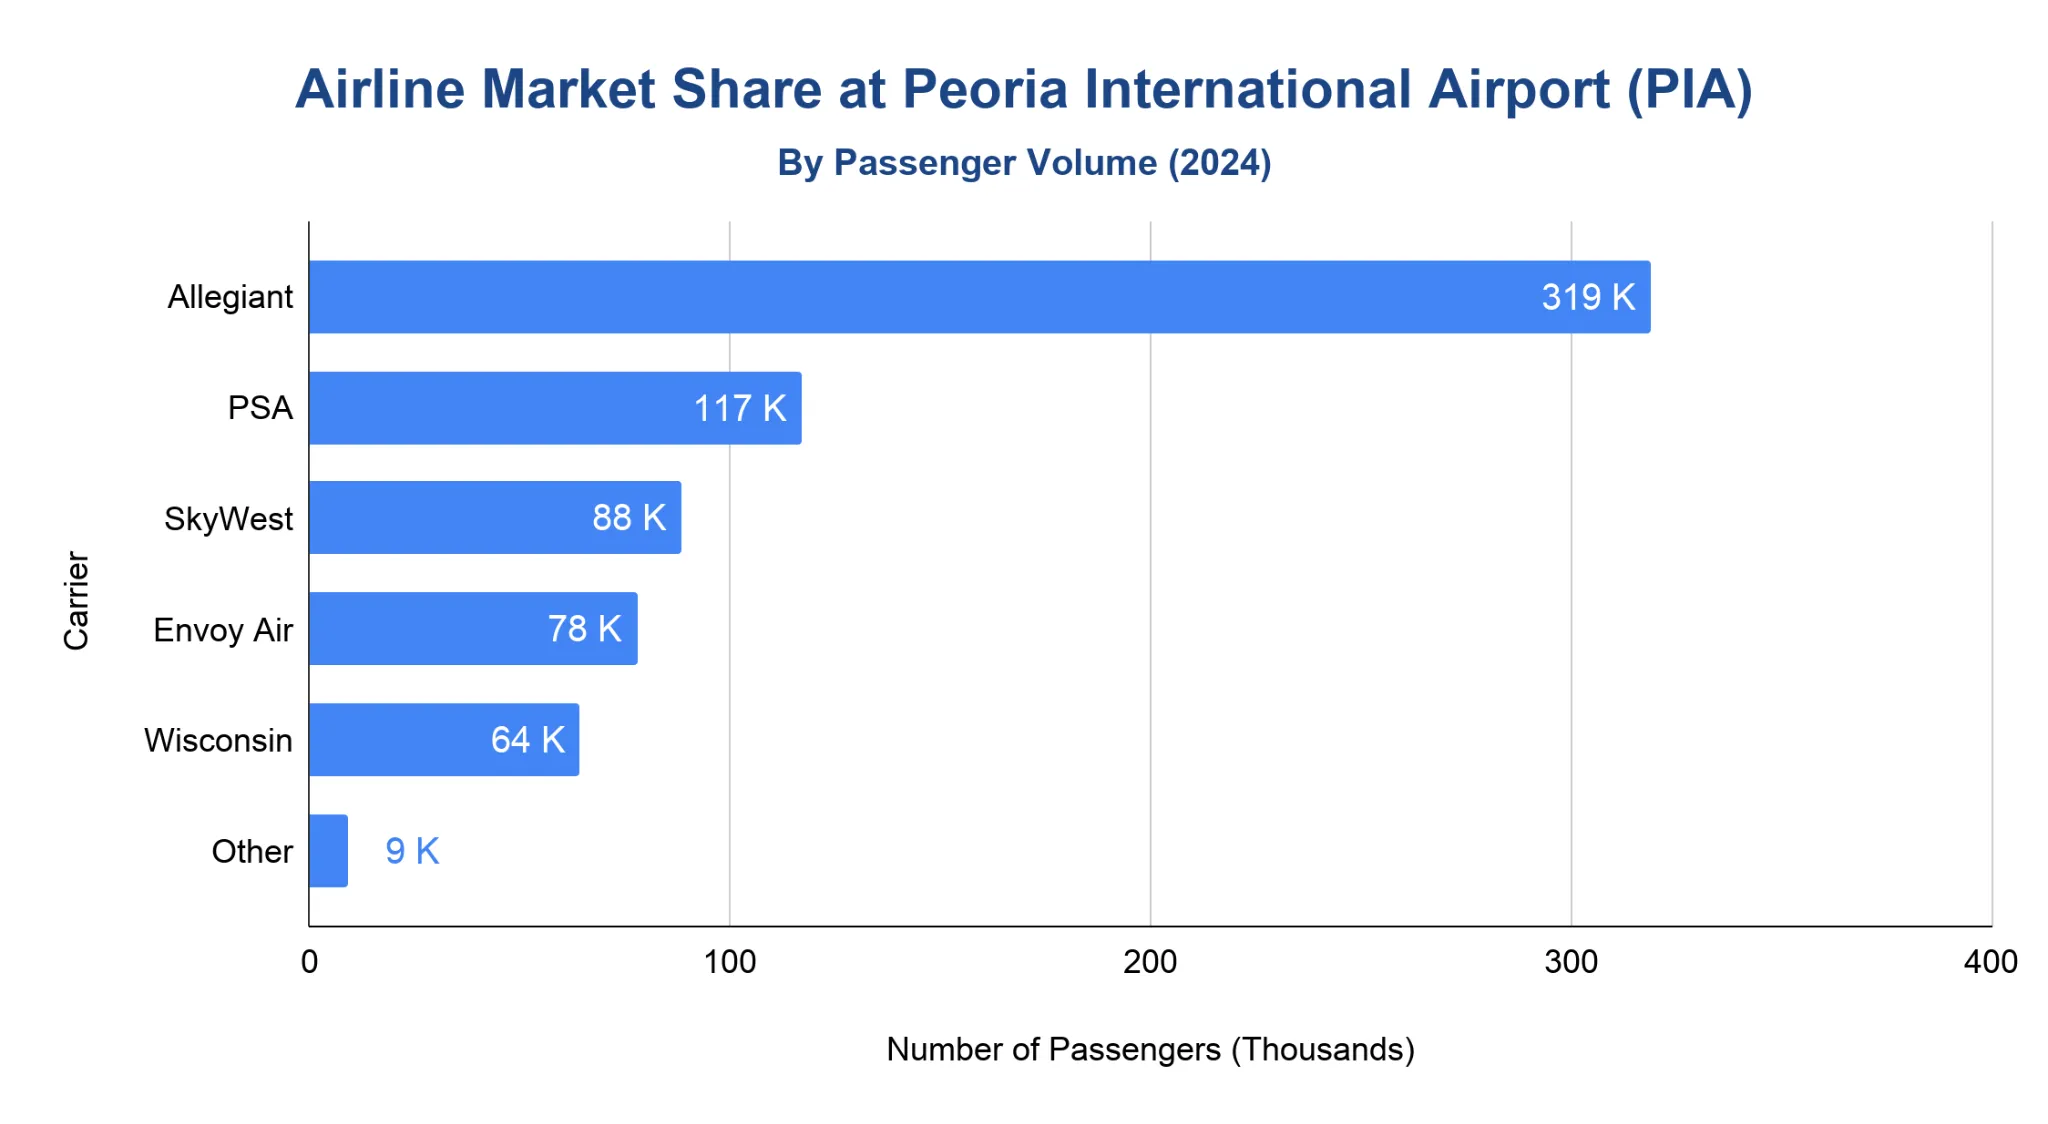
Allegiant Air was the largest carrier at Peoria International Airport in 2024, handling nearly half of all enplaned passengers.
- Allegiant Air carried approximately 319,000 passengers, accounting for 47.2% of total traffic, driven primarily by leisure-focused nonstop routes.
- PSA Airlines, operating regional flights for American Airlines, handled about 117,000 passengers, representing 17.3% of the market.
- SkyWest Airlines, primarily serving United Airlines connections, carried roughly 88,000 passengers, or 13.1% of total enplanements.
- Envoy Air accounted for 11.5% of passengers, while Wisconsin Airlines contributed 9.5%, together supporting hub connectivity.
- Other carriers combined represented 1.4% of total passenger traffic.
Note: Based on enplaned passengers (000). Source: BTS.
What are the most popular destinations from Peoria International Airport?
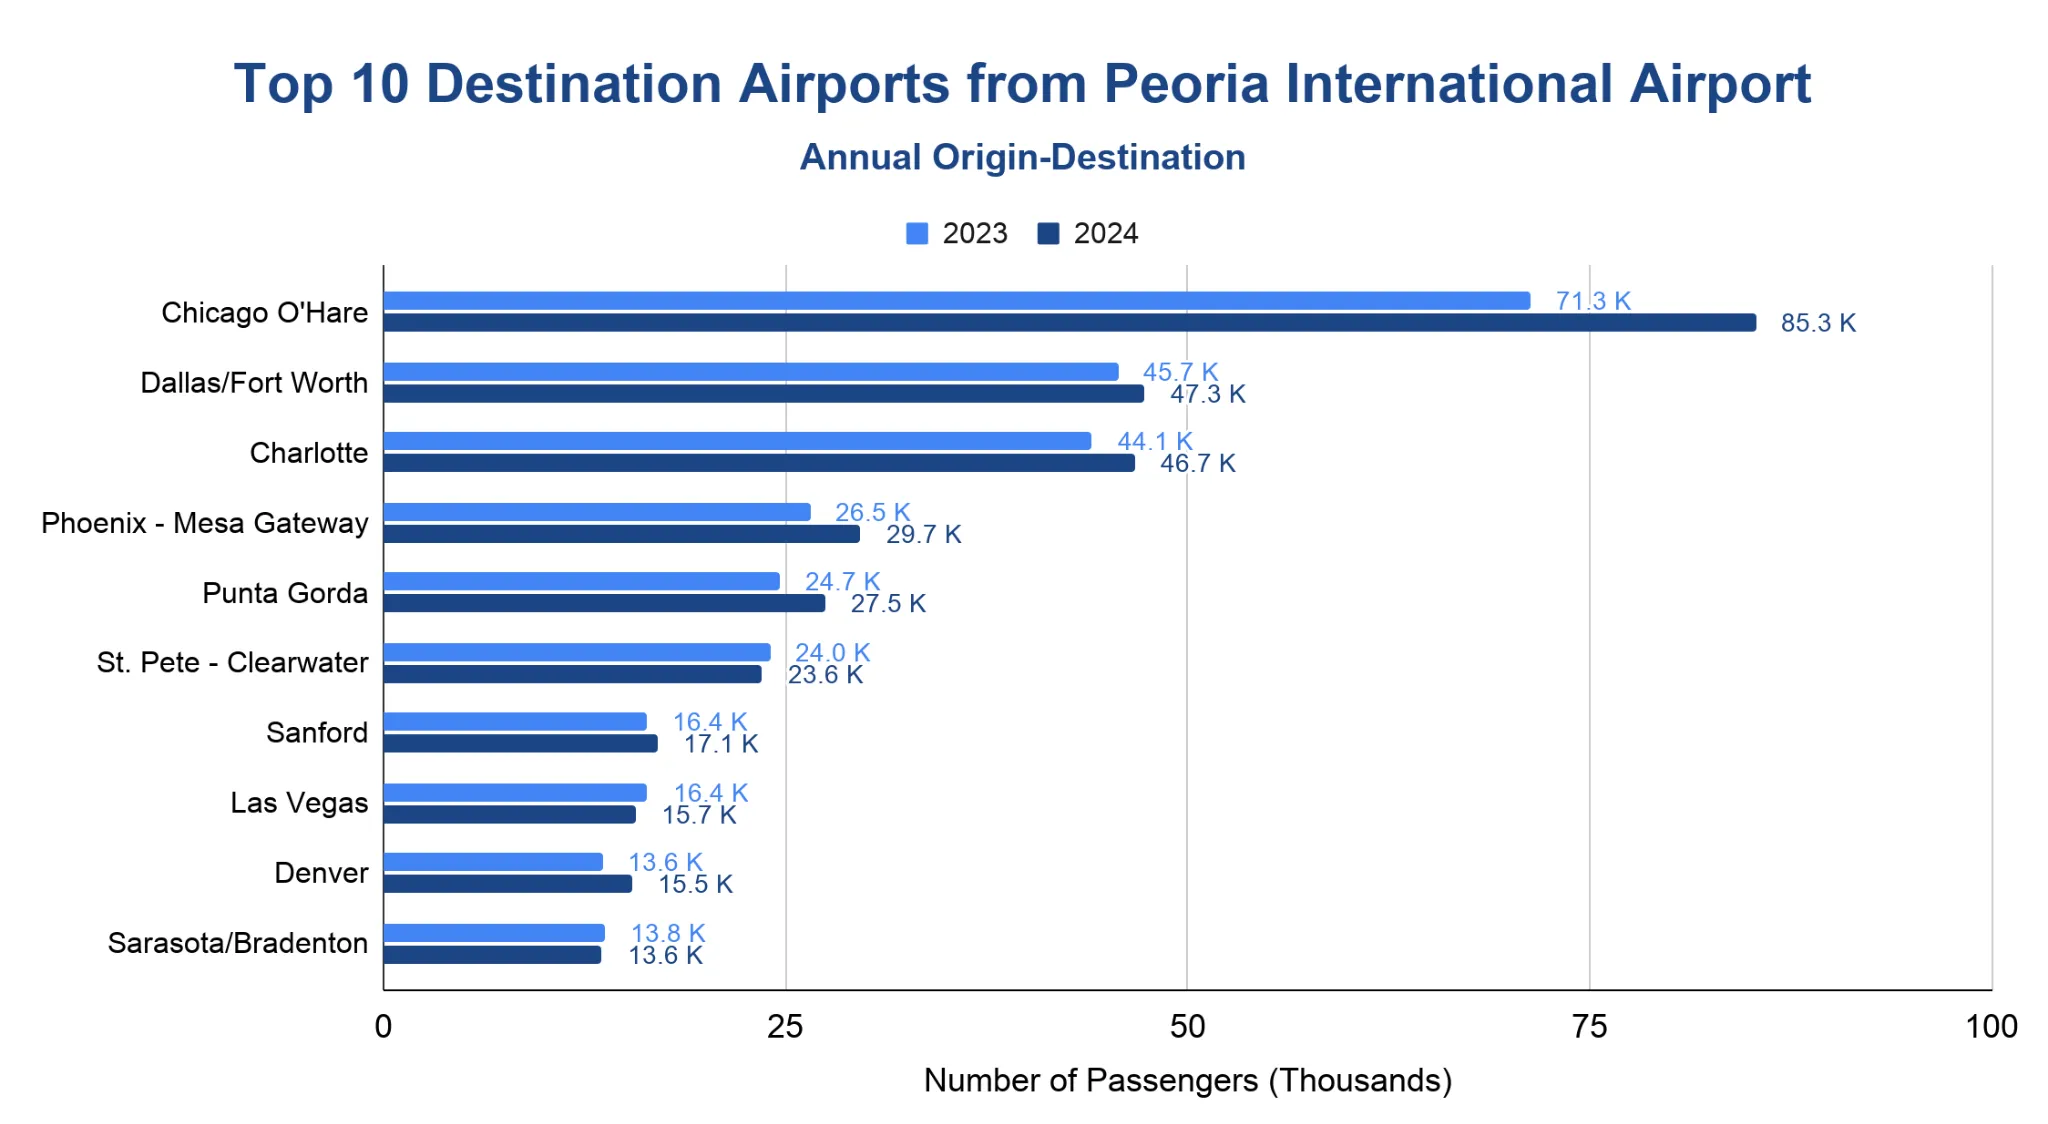
Chicago O’Hare remained the busiest destination from Peoria International Airport in 2024, while leisure-focused routes continued to show the strongest growth.
- Chicago O’Hare was the top destination, with passenger traffic rising from 71,300 in 2023 to 85,300 in 2024, reflecting strong hub connectivity.
- Dallas/Fort Worth and Charlotte followed as the next-largest markets, each handling about 47,000 passengers in 2024, with moderate year-over-year growth.
- Leisure destinations showed the most consistent increases, including Phoenix-Mesa Gateway, Punta Gorda, and Sanford, all posting higher passenger volumes in 2024.
- Florida markets dominated the destination list, accounting for half of the top ten routes by passenger volume.
- Several routes experienced mild softening, including St. Pete-Clearwater, Las Vegas, and Sarasota/Bradenton, though volumes remained broadly stable year over year.
Note: Passengers (000). Source: T-100 Domestic Market (US Carriers).
What are the peak travel months at Peoria International Airport?
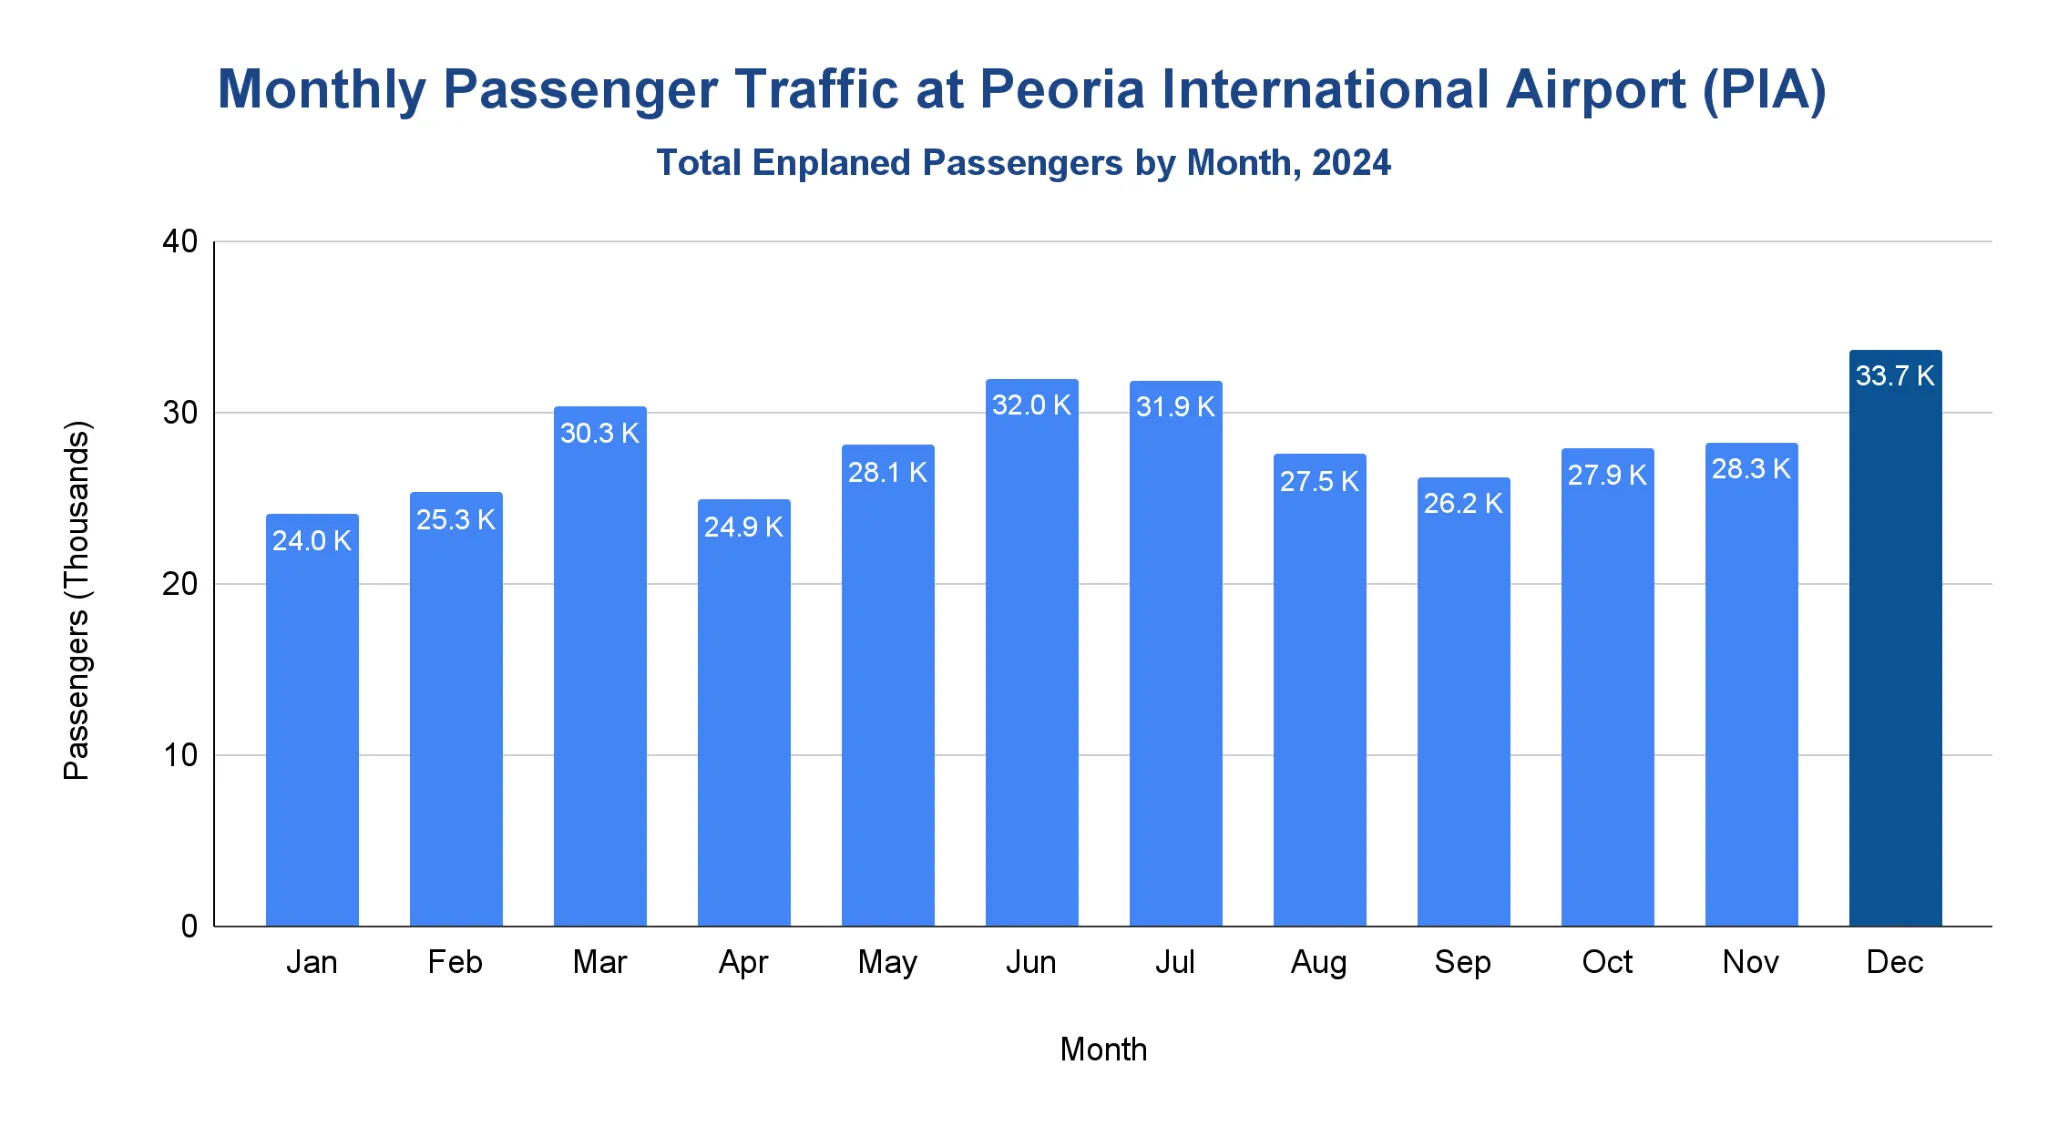
The busiest month at Peoria International Airport in 2024 was December (33,700 enplaned passengers), followed by the summer peak in June (32,000) and July (31,900).
- Passenger volumes climbed through spring, rising from 24,000 in January to 30,300 in March, then building again into early summer.
- Traffic eased after summer, with August (27,500) and September (26,200) marking the seasonal slowdown.
- January and February were the slowest months, each handling roughly 24,000 to 25,000 passengers.
Source: BTS.
How much operating revenue does Peoria International Airport generate each year?
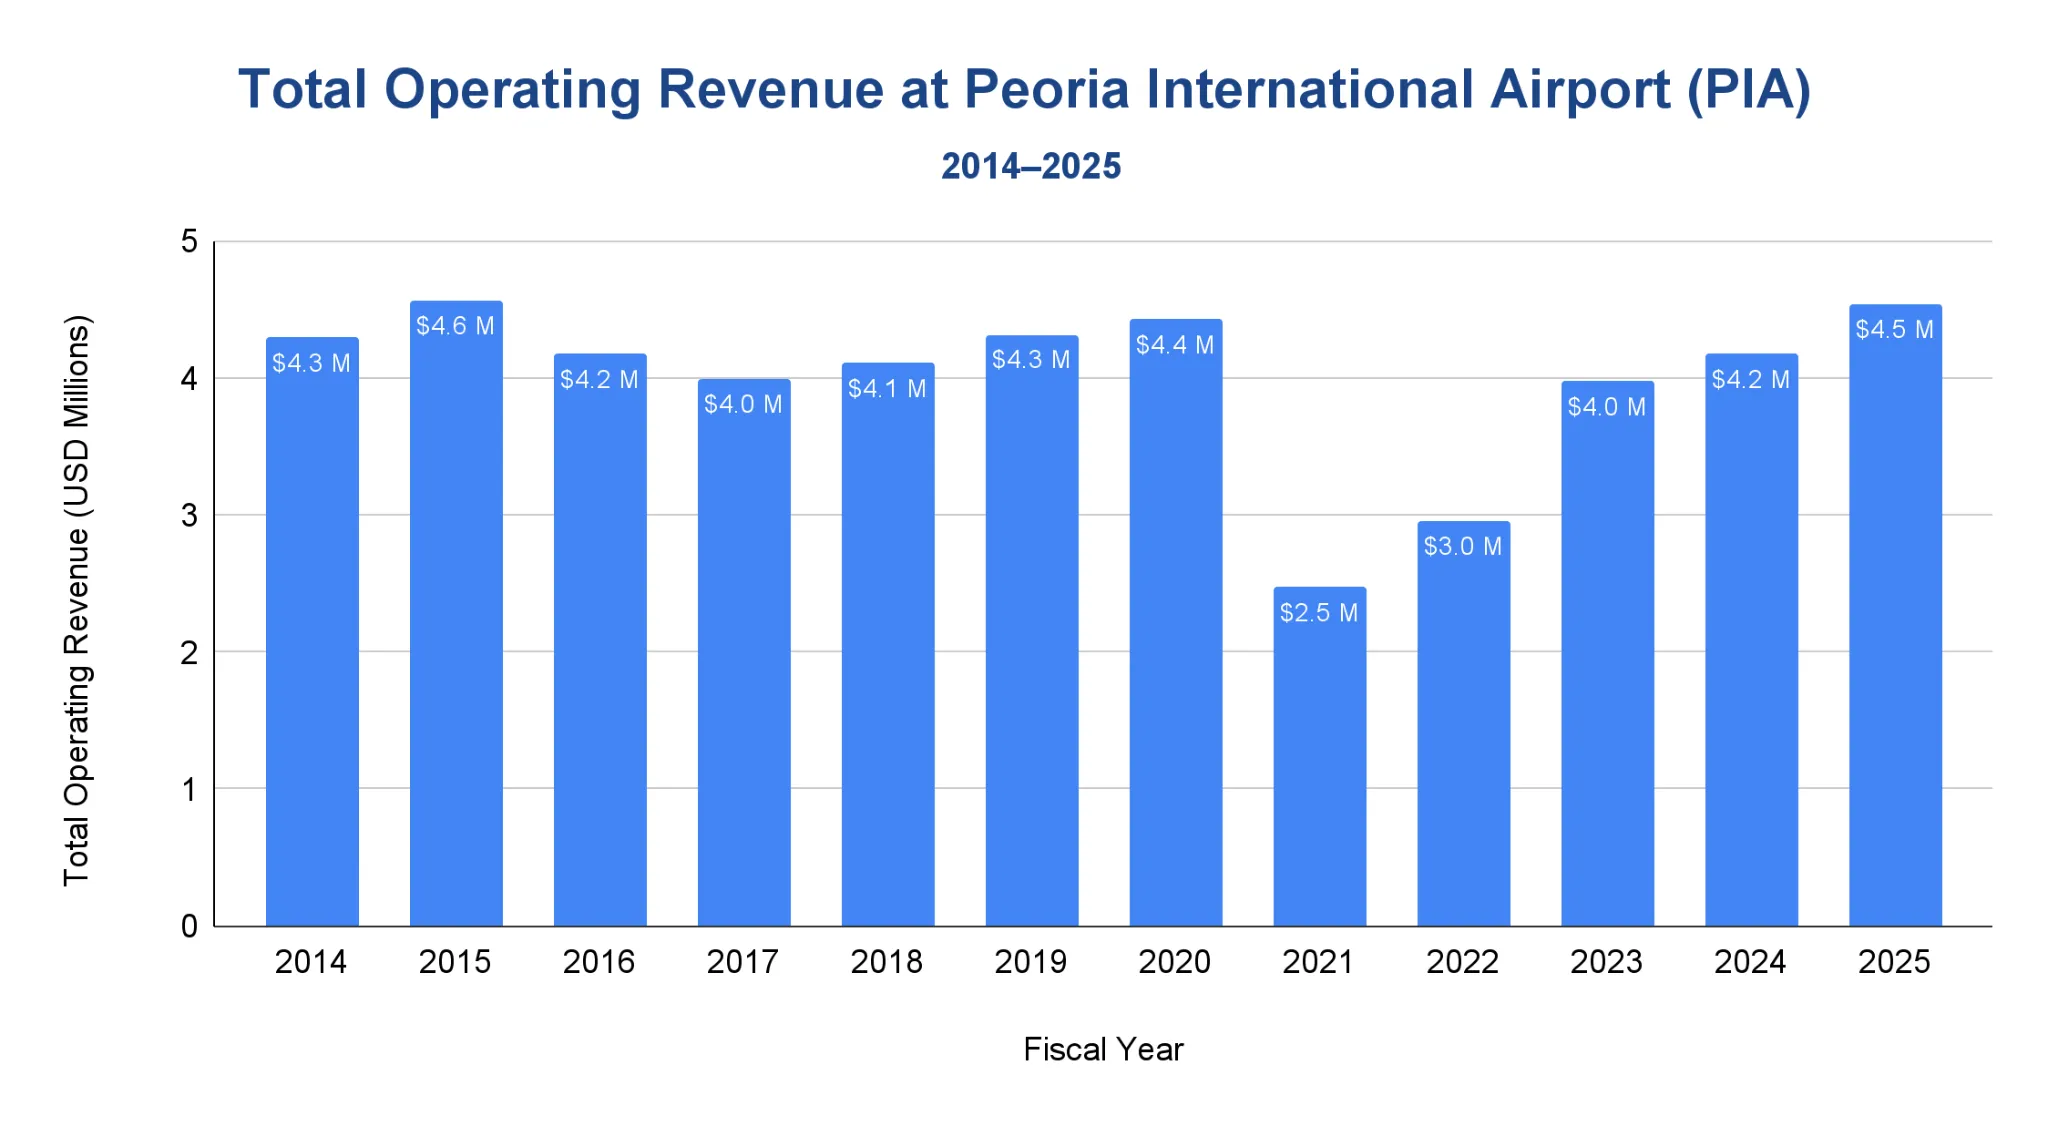
Peoria International Airport generated $4.54 million in operating revenue in fiscal year 2025, marking a full recovery from the pandemic downturn and a new post-COVID high.
- Operating revenue was stable before the pandemic, generally ranging between $4 million and $4.6 million from FY2014 through FY2020.
- Revenue dropped sharply in FY2021 to $2.47 million, reflecting the severe impact of reduced air travel.
- A steady recovery followed, with revenue rising to $2.95 million in FY2022 and $3.97 million in FY2023.
- Revenue returned to near pre-pandemic levels in FY2024 ($4.17 million).
- FY2025 set a new high at $4.54 million, exceeding all prior fiscal years.
Note: Fiscal year ends on February 28. Source: FAA CATS Reports.
How much cargo moves through Peoria International Airport each year?
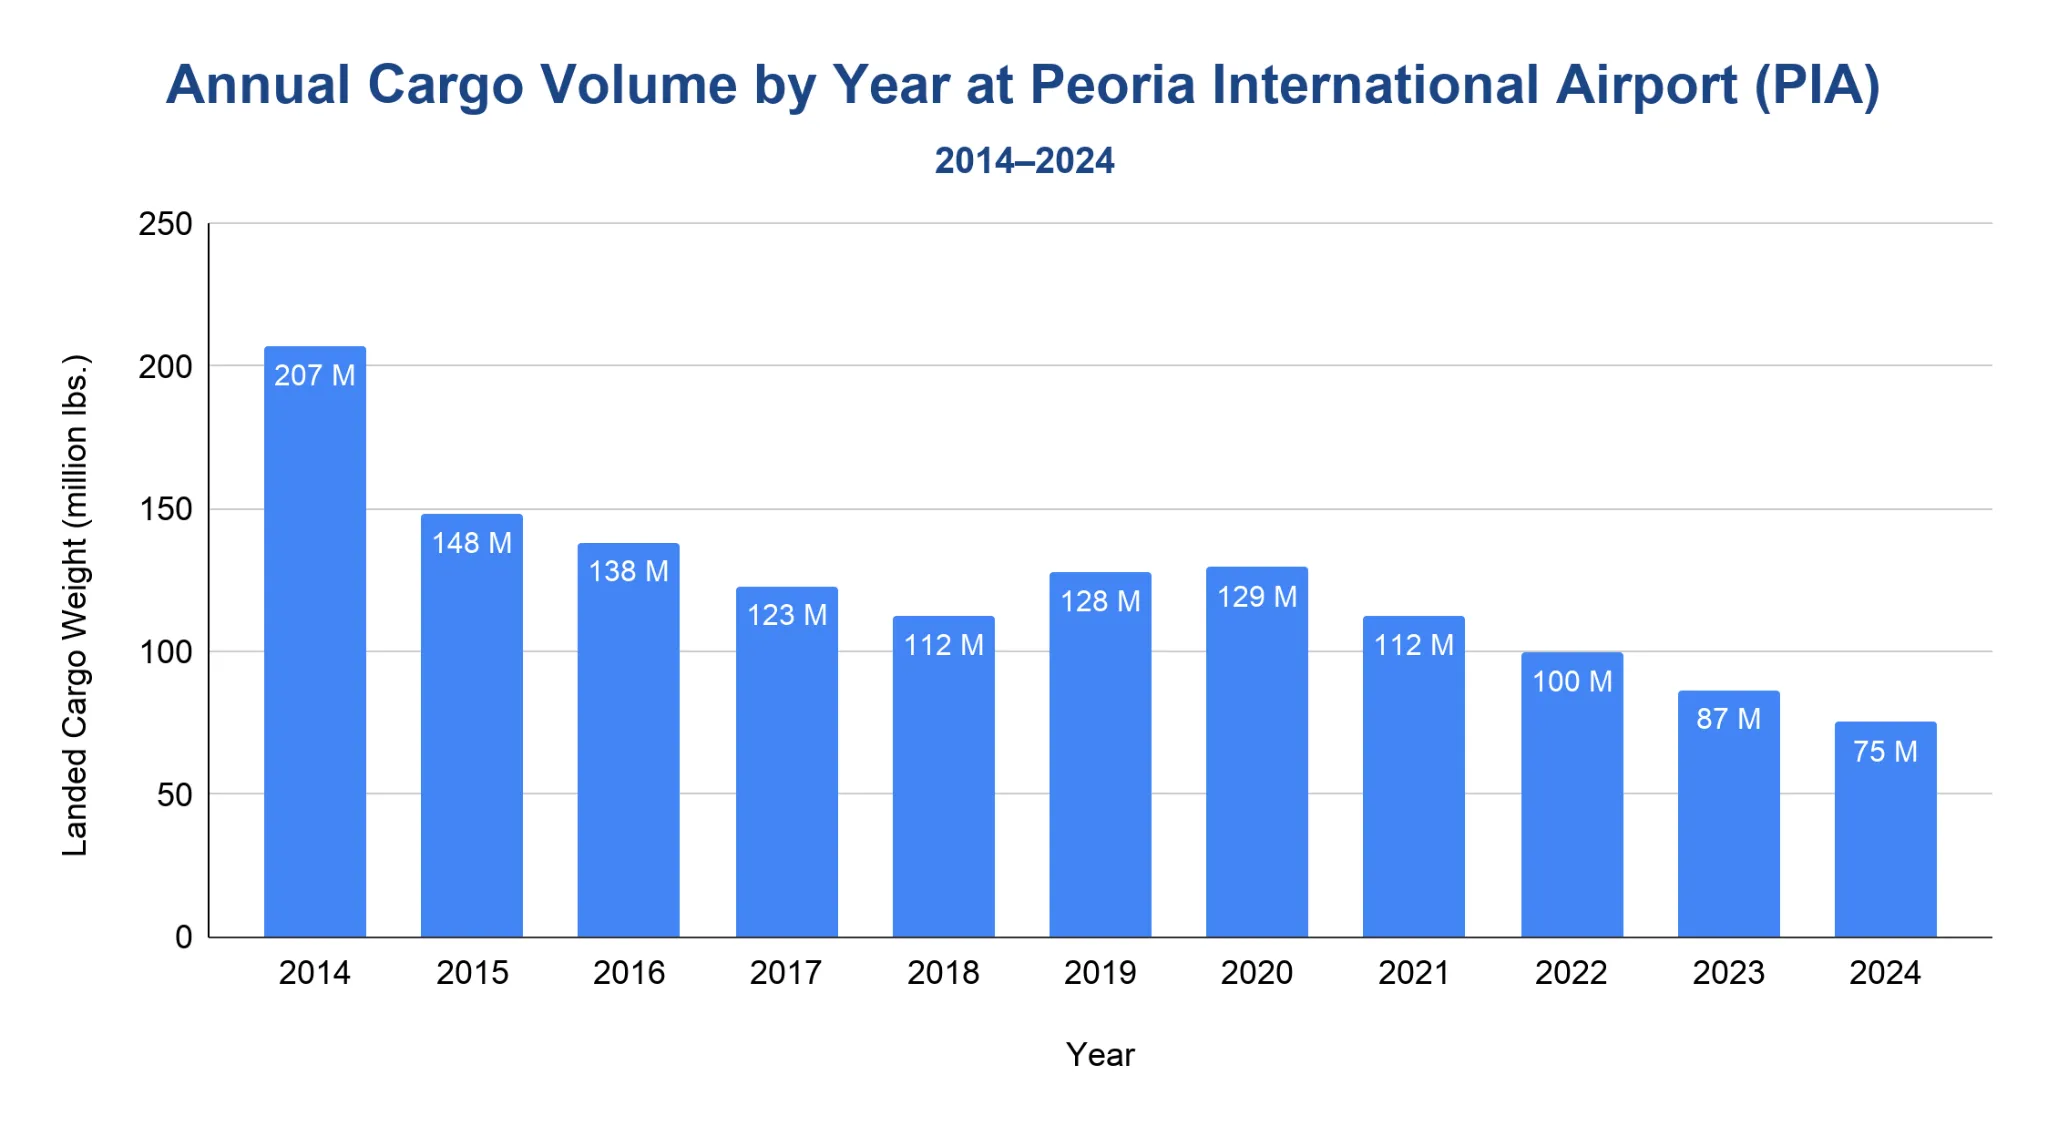
Peoria International Airport handled 75.1 million lbs. of landed cargo in calendar year 2024, continuing a long-term decline in freight volumes following earlier mid-2010s highs.
- Cargo activity peaked in 2014 at 207 million lbs., before entering a multi-year contraction through 2018.
- Volumes rebounded modestly in 2019 (127.6 million lbs.) and remained elevated through 2020 (129.4 million lbs.), supported by pandemic-era logistics demand.
- Cargo throughput declined steadily after 2021, falling below 100 million lbs. in 2022.
- The downward trend continued in 2023 (86.6 million lbs.) and 2024 (75.1 million lbs.), reflecting reduced freight activity relative to earlier years.
Source: FAA
What is Peoria International Airport’s on-time performance?
During the October 2024 to September 2025 reporting period, Peoria International Airport posted an 80% on-time departure rate and an 81% on-time arrival rate, reflecting solid schedule reliability among major U.S. carriers.
- On-time performance weakened during the pandemic period, bottoming out in 2022 with 77% on-time departures and 75% on-time arrivals.
- Performance improved in 2023, with departure punctuality rising to 82%, before softening slightly in 2024.
- In the most recent reporting year (2025 period), both departure and arrival performance improved, exceeding 2024 levels.
- Average delay times have trended downward since the pandemic peak, with departure delays falling from 109 minutes in 2020 to 83 minutes in the latest period.
- Flight cancellations declined sharply after 2020, stabilizing near 1% in both 2023 and the 2025 period.
| Airport On-Time Performance at PIA | ||||||
|---|---|---|---|---|---|---|
| Metric | 2020 | 2021 | 2022 | 2023 | 2024 | 2025* |
| On-Time Departures | 83% | 79% | 77% | 82% | 78% | 80% |
| On-Time Arrivals | 82% | 77% | 75% | 79% | 77% | 81% |
| Avg Departure Delay (min.) | 109.63 | 84.15 | 88.42 | 88.4 | 93.28 | 83.28 |
| Avg Arrival Delay (min.) | 59.93 | 71.67 | 69.61 | 65.34 | 69.6 | 64.04 |
| Cancellation Rate | 6.53% | 2.43% | 3.42% | 0.98% | 1.68% | 0.99% |
| Total Flights | 3,203 | 3,205 | 3,185 | 3,278 | 3,744 | 1,015 |
| Reporting Carriers | 8 | 6 | 5 | 4 | 4 | 5 |
Source · 2025 data covers October 2024 through September 2025. Ranking applies only among major U.S. airports. BTS publishes average delays in decimal-minute format. As such, the values have been kept exactly as reported to avoid altering the underlying data.
What are the Current Major Expansion Projects at Peoria International Airport?
A replacement air traffic control tower is Peoria International Airport’s largest active capital project, supported by multiple federal grant awards.
- Federal funding for the new tower has been announced in three phases, beginning with a $15 million grant to initiate construction, followed by a $14 million grant to continue the project.
- A subsequent announcement added $13.5 million in additional funding, bringing total federal support to $43.5 million, with $45.8 million in total funds committed to the project.
- Airport officials have noted that earlier design-era cost estimates from 2017 placed the project at about $20 million, prior to inflation and updated design standards.
- The airport authority describes the tower project as a multi-year construction effort, with work proceeding in stages.
| Major Expansion Projects at PIA | ||||
|---|---|---|---|---|
| Project | Type | Funding (Millions) | Status | Completion |
| New ATC Tower | Air Traffic Control Facility | $43.5 federal / $45.8 total | Construction underway | Multi-year (year not published) |
What is Peoria International Airport’s Safety Record?
PIA maintains a strong safety record.
- October 21, 1971: Chicago & Southern Flight 804 crashed during approach in fog after striking power lines two miles from the runway. All 16 aboard died. Investigators cited pilot error for descending below minimum altitude.
- September 22, 2008: A runway incursion placed a regional jet and a vehicle in close proximity. No collision occurred and procedures were revised.
- General aviation occasionally sees emergency landings though none recently caused serious injury or significant damage.
- The airport's Aircraft Rescue and Firefighting unit conducts regular emergency drills.
| Safety Record at PIA | |||
|---|---|---|---|
| Date | Event | Fatalities | Cause |
| Oct 21, 1971 | C&S Flight 804 crash | 16 | CFIT on approach (fog combined with pilot error) |
| Sep 22, 2008 | Runway incursion | 0 | Procedural (corrected) |
Source · The last major accident occurred in 1971. Improved landing systems and procedures have enhanced safety since then.
Related Travel Statistics
- Bangor International Airport (BGR) Statistics
- Bozeman Airport (BZN) Statistics
- Colorado Springs Airport Statistics
- Fayetteville Regional Airport Statistics
- Greenville–Spartanburg Airport Statistics
- Houston Hobby Airport Statistics
- Huntsville Airport (HSV) Statistics
- JFK Airport Statistics
- Tweed–New Haven Airport (HVN) Statistics
- Phoenix Sky Harbor Airport Statistics
- Portland International Jetport Statistics
- T.F. Green International Airport Statistics
How does Peoria International Airport rank globally?
PIA ranked at 166th position among U.S. airports by passenger traffic (total yearly enplanements) and the FAA classifies it as a non-hub primary commercial service airport.
- Within Illinois, PIA complements Chicago's large hubs as a key regional facility.
- Covering more than 3,500 acres, PIA has one of the larger footprints for a Midwest regional airport.
- It offers convenient "fly local" service for Central Illinois residents within a 60-90 minute drive.
References
- Peoria International Airport Authority — Statistics (2019–2024) · flypia.com
- FAA Passenger Boarding and All-Cargo Data Master · faa.gov
- FAA ASPM — ATADS Aircraft Operations By Year and Type (2014–2025) · aspm.faa.gov
- Bureau of Transportation Statistics Airport Data Elements Guide · transtats.bts.gov
- FAA CATS — Airport Financial Reports (2014–2025) · cats.airports.faa.gov
- Bureau of Transportation Statistics Airport Summary Database (2016–2025) · transtats.bts.gov
- Illinois DOT — 2023 Illinois Airport Inventory Report / Airport Economic Impact Study (2019–2023) · idot.illinois.gov
- NTSB — Aviation Safety Investigation Reports (1971–2008) · data.ntsb.gov

