

 Popular Countries
 24/7 Support
Published Sep 9, 2026
Officially listed by the Federal Aviation Administration (FAA) as Huntsville International-Carl T. Jones Field, Huntsville International Airport (HSV) sits southwest of downtown Huntsville in Madison County, Alabama. The Port of Huntsville opened in 1967 and now includes HSV, the International Intermodal Center, Jetplex Industrial Park and Spaceport across roughly 7,000 acres.
How many passengers use Huntsville International Airport each year?
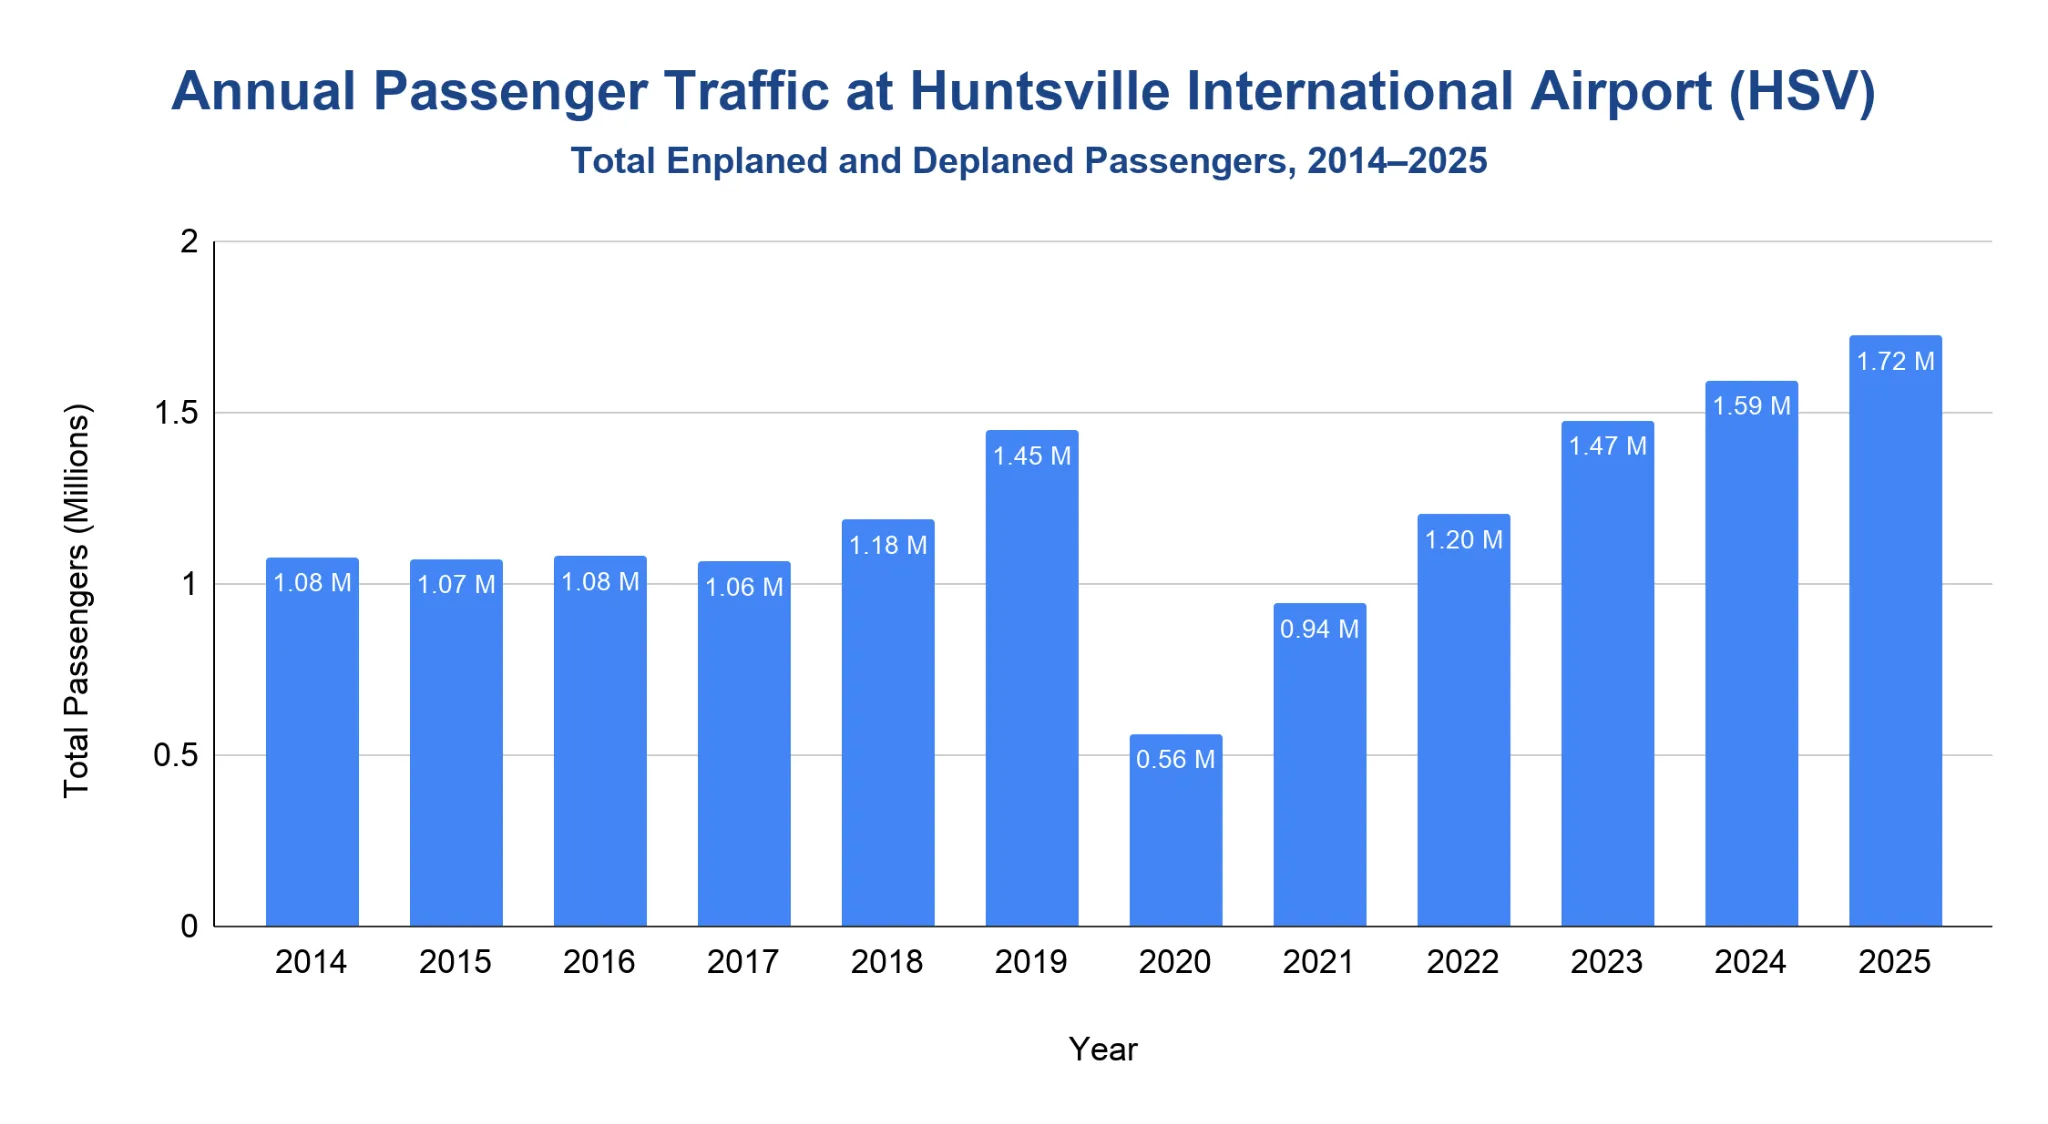
HSV handled 1.72 million total passengers in 2025, its latest full-year record.
- The 2014–2018 period was mostly stable, rising from 1.08 million total passengers in 2014 to 1.18 million in 2018.
- Pre-pandemic traffic jumped to 1.45 million total passengers in 2019, up 34.4% from 2014.
- Passenger traffic fell to 559,420 in 2020, a 61.3% drop from 2019.
- Recovery began with 940,830 passengers in 2021, then continued to 1.2 million in 2022 and 1.47 million in 2023.
- HSV reached 1.59 million passengers in 2024 and then set another record with 1.72 million in 2025.
- As of March 2026, HSV had handled 392,943 total passengers year to date, up 5.8% from the same period in 2025.
Note: Total passengers combine enplaned and deplaned passengers.
Does Huntsville International Airport offer domestic or international flights?
HSV’s currently published nonstop passenger network is domestic, with 18 U.S. cities listed on the airport’s route page.
- HSV lists scheduled passenger service via Allegiant, American Airlines, Breeze Airways, Delta Air Lines and United Airlines.
- Current nonstop destinations include major U.S. hubs and leisure markets such as Atlanta, Charlotte, Chicago, Dallas/Fort Worth, Denver, Detroit, Houston, Las Vegas, New York City, Orlando, Tampa and Washington, D.C.
- The “International” name is reflected more directly in HSV’s cargo and logistics role, including domestic and international air cargo operations.
- The airport’s cargo network includes international freight activity, with the Port describing scheduled cargo service to Luxembourg and Hong Kong.
Note: Flight schedules change, so the destination count should be treated as current published nonstop service rather than a fixed historical total.
How many aircraft operations take place each year?
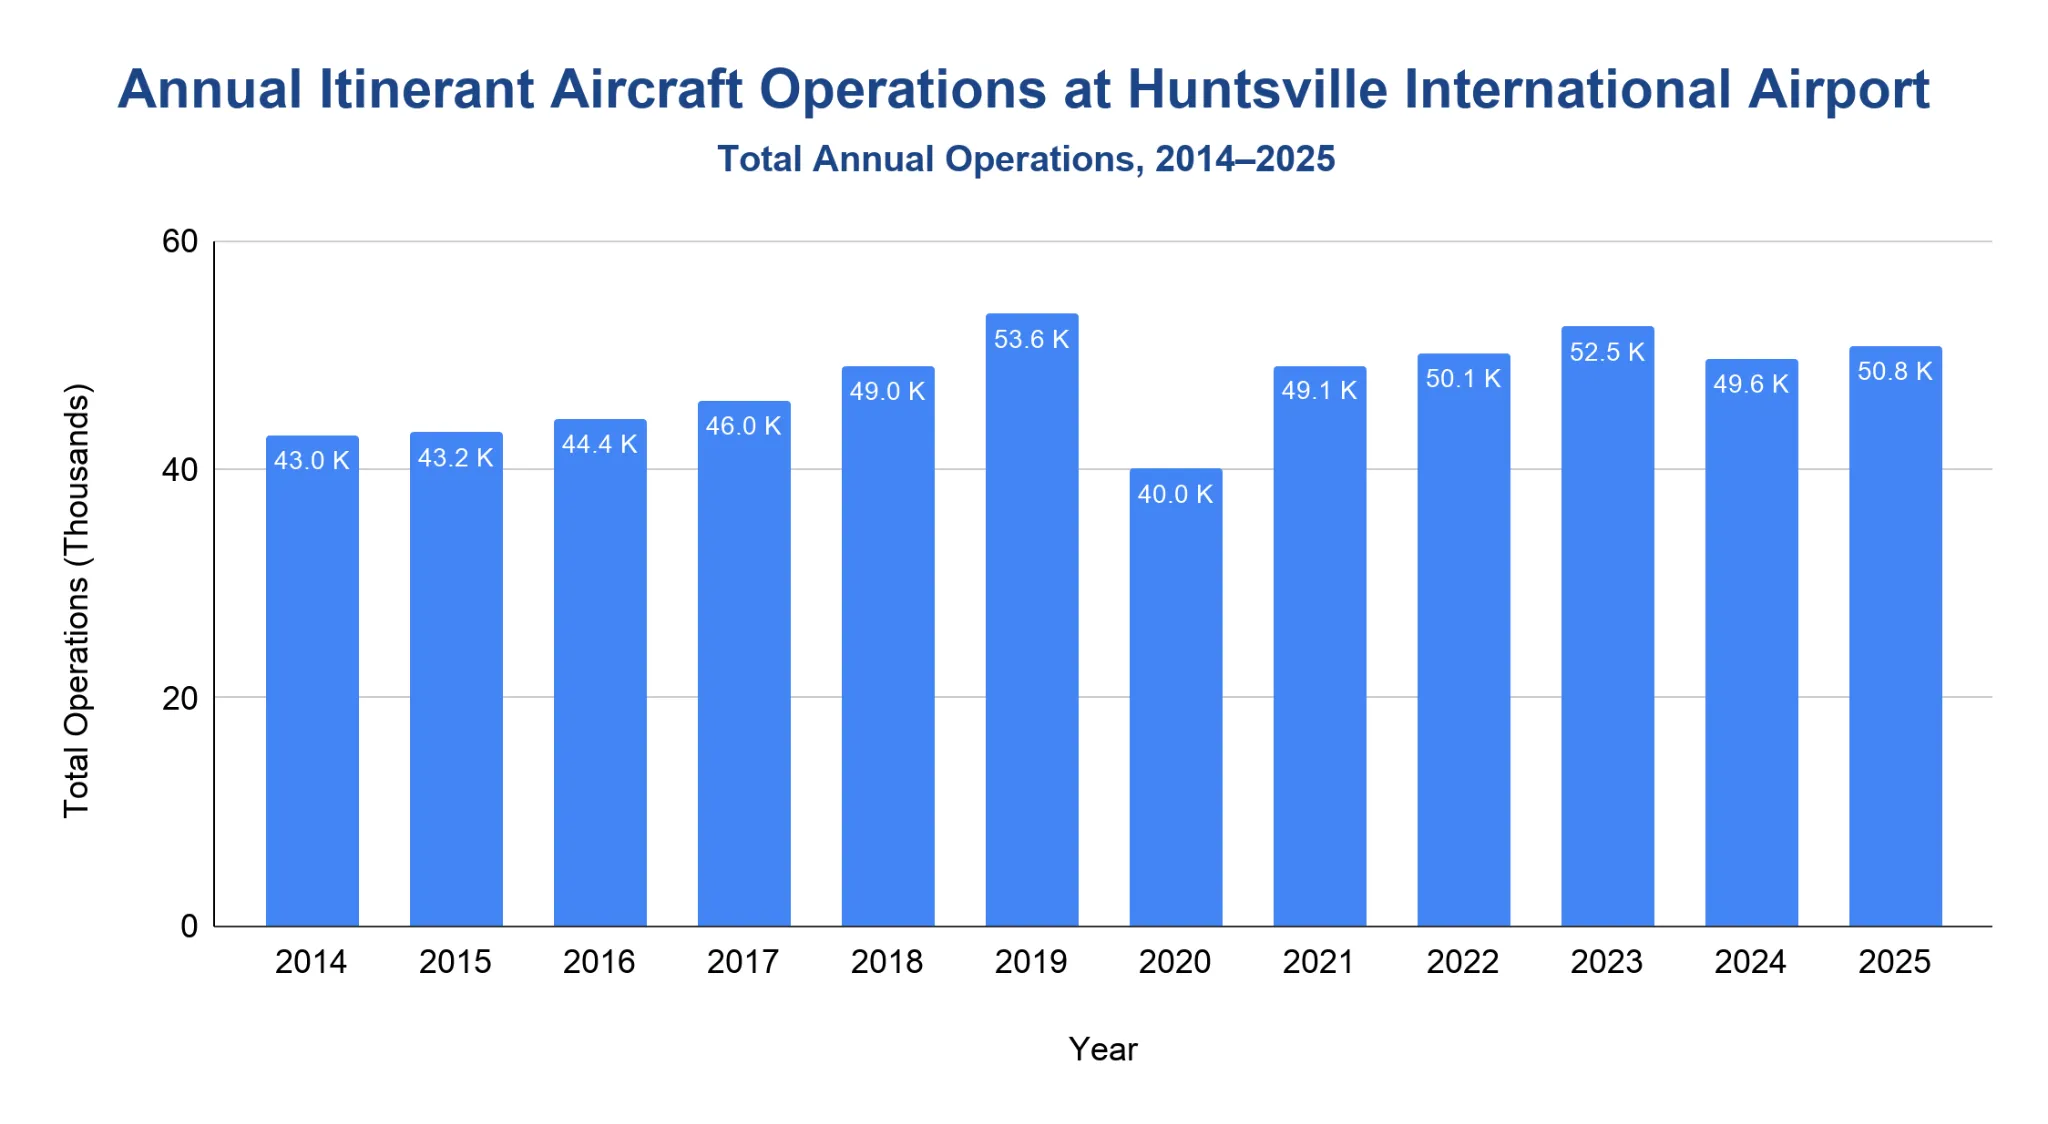
HSV recorded 50,791 FAA-reported itinerant aircraft operations in 2025.
- Activity rose from 42,973 operations in 2014 to 49,018 in 2018, a 14.1% increase.
- Pre-pandemic activity peaked at 53,588 operations in 2019.
- The total fell to 40,029 in 2020, down 25.3% from 2019.
- HSV recovered to 49,095 operations in 2021 and 50,110 in 2022.
- Post-pandemic activity reached 52,450 in 2023, then moved to 49,630 in 2024 and 50,791 in 2025.
- As of March 2026, HSV had recorded 11,453 operations.
| Aircraft Operations by Type at HSV | ||||
|---|---|---|---|---|
| Year | Air Carrier | Air Taxi | General Aviation | Military |
| 2014 | 10,081 | 11,284 | 11,726 | 9,882 |
| 2015 | 9,179 | 12,580 | 10,759 | 10,715 |
| 2016 | 10,520 | 11,843 | 11,425 | 10,635 |
| 2017 | 11,502 | 10,103 | 12,690 | 11,731 |
| 2018 | 13,025 | 10,528 | 13,867 | 11,598 |
| 2019 | 15,085 | 10,872 | 15,082 | 12,549 |
| 2020 | 10,229 | 5,742 | 15,376 | 8,682 |
| 2021 | 13,681 | 7,860 | 16,958 | 10,596 |
| 2022 | 13,247 | 9,268 | 16,375 | 11,220 |
| 2023 | 14,693 | 11,273 | 15,452 | 11,032 |
| 2024 | 15,720 | 12,827 | 12,042 | 9,041 |
| 2025 | 17,759 | 13,164 | 12,394 | 7,474 |
Source · FAA itinerant operations count aircraft arrivals and departures that leave the airport traffic pattern or arrive from another airport.
Which airlines fly most passengers out of Huntsville?
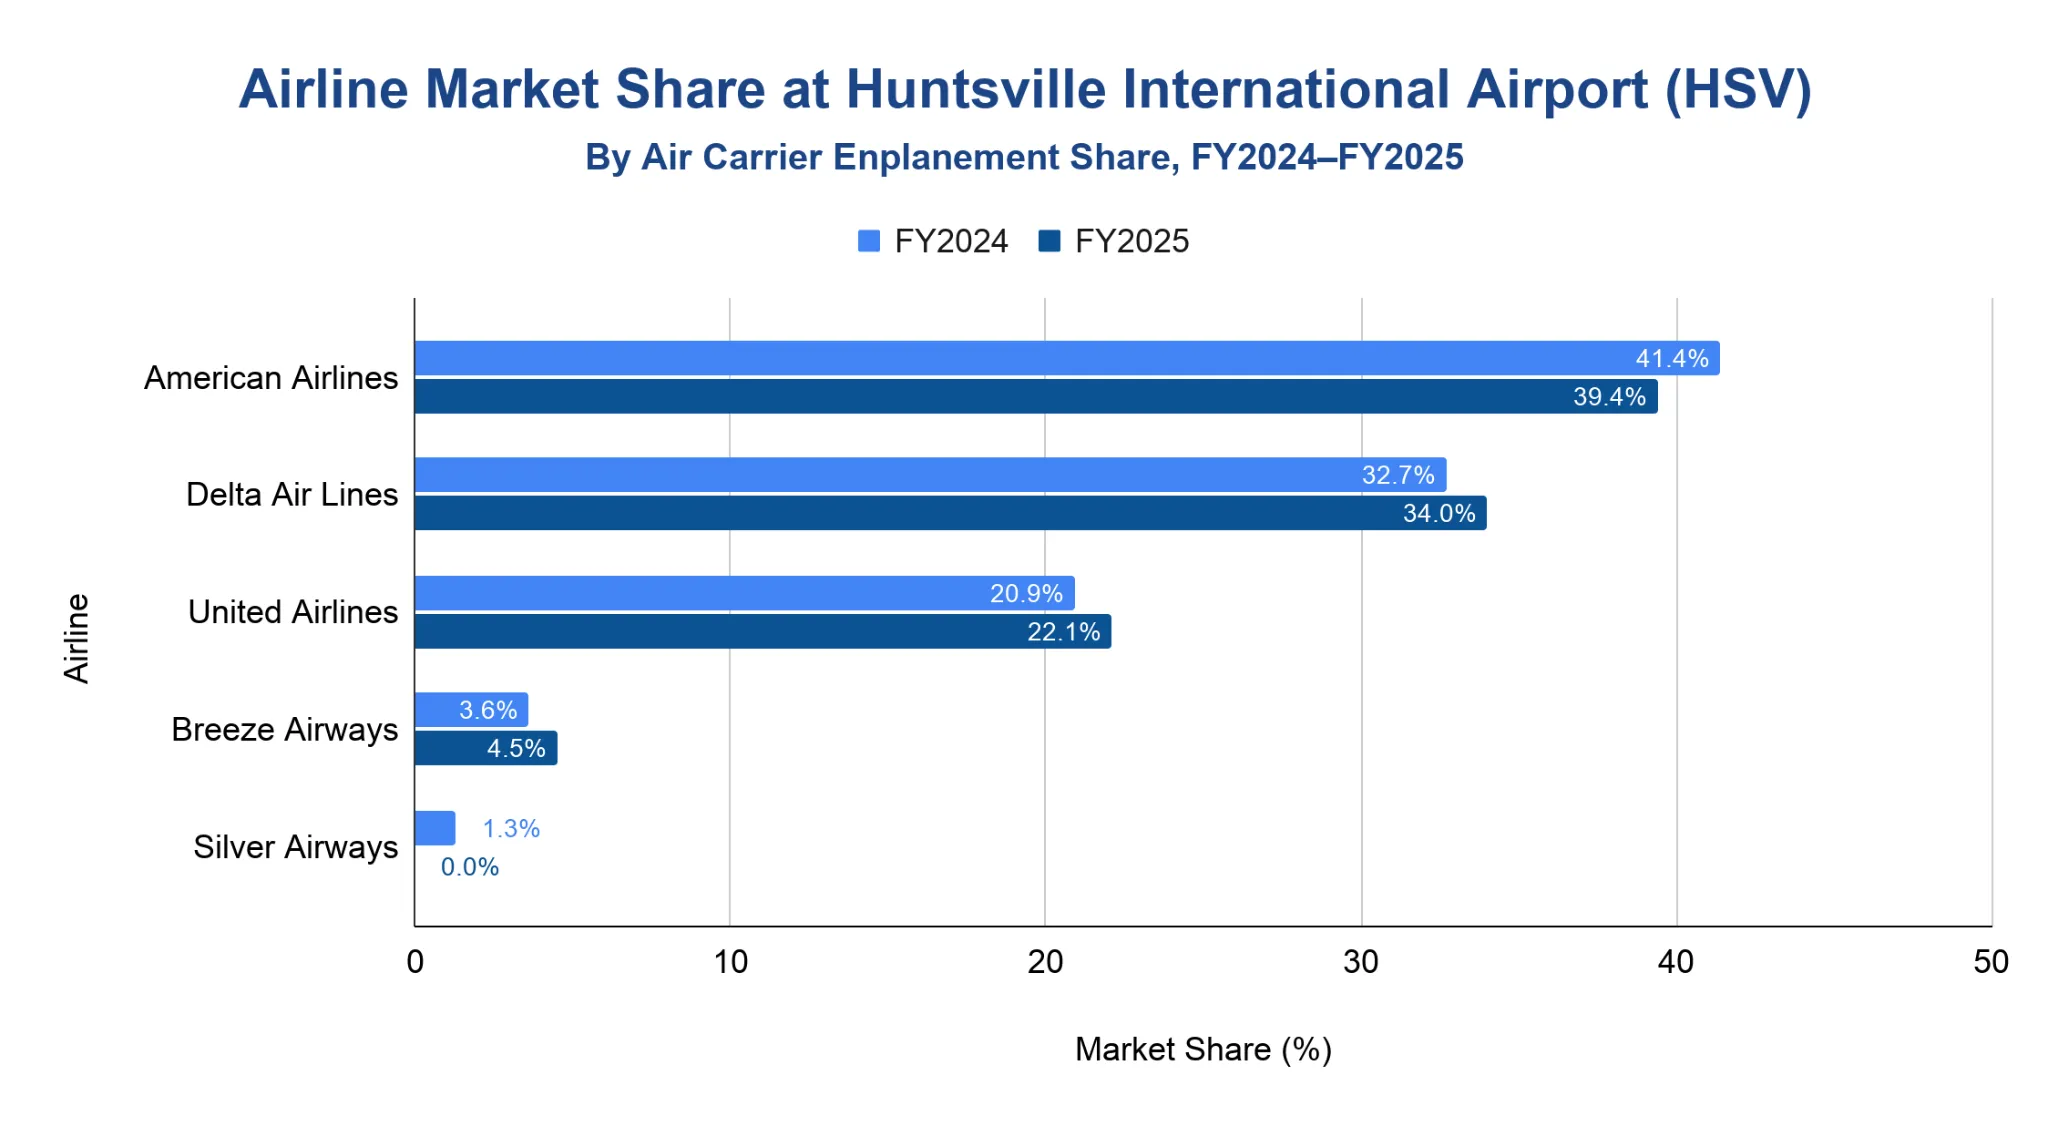
American Airlines and Delta Air Lines accounted for 73.4% of HSV air carrier enplanements in fiscal year 2025.
- American Airlines led HSV in fiscal year 2025 with 39.4% of air carrier enplanements.
- Delta Air Lines ranked second at 34%, up from 32.7% in fiscal year 2024.
- United Airlines accounted for 22.1% of fiscal year 2025 air carrier enplanements.
- Breeze Airways increased its share to 4.5% in fiscal year 2025.
- Silver Airways, which still appeared in the fiscal year 2024 mix, had 0% share in fiscal year 2025 after discontinuing service in 2024.
What are the most popular destinations from Huntsville International Airport?
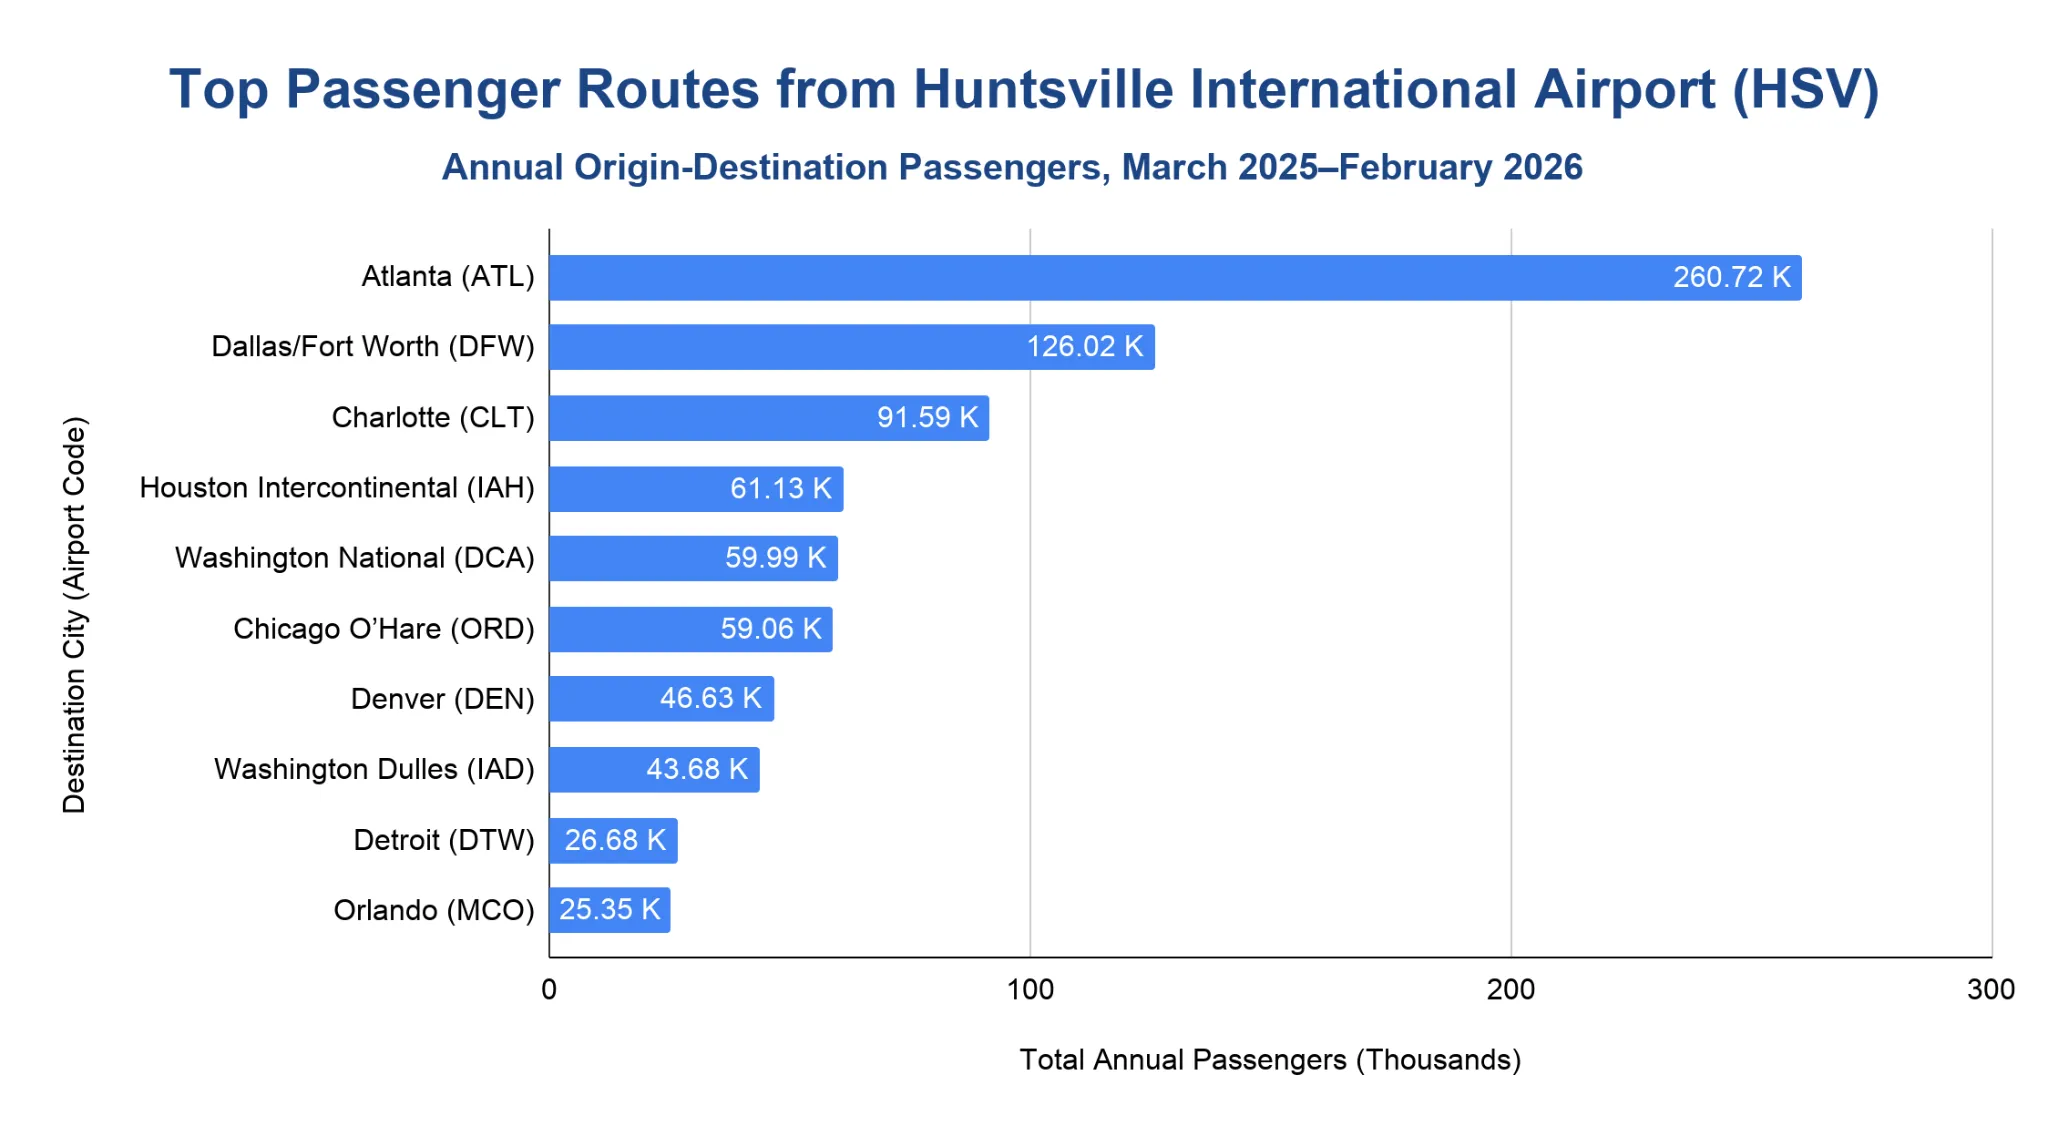
In the Bureau of Transportation Statistics (BTS) T-100 Domestic Market rolling period, March 2025–February 2026, Atlanta was HSV’s top destination airport with 260.72 thousand passengers.
- Atlanta led by a wide margin, carrying more than twice as many passengers as Dallas/Fort Worth.
- Dallas/Fort Worth ranked second with 126.02 thousand passengers.
- Charlotte ranked third with 91.59 thousand passengers.
- Houston Intercontinental, Washington National and Chicago O’Hare followed with 61.13 thousand, 59.99 thousand and 59.06 thousand passengers, respectively.
- Orlando and Detroit were also among the top 10 destination airports, with 25.35 thousand and 26.68 thousand passengers, respectively.
Peak Travel Months at Huntsville International Airport
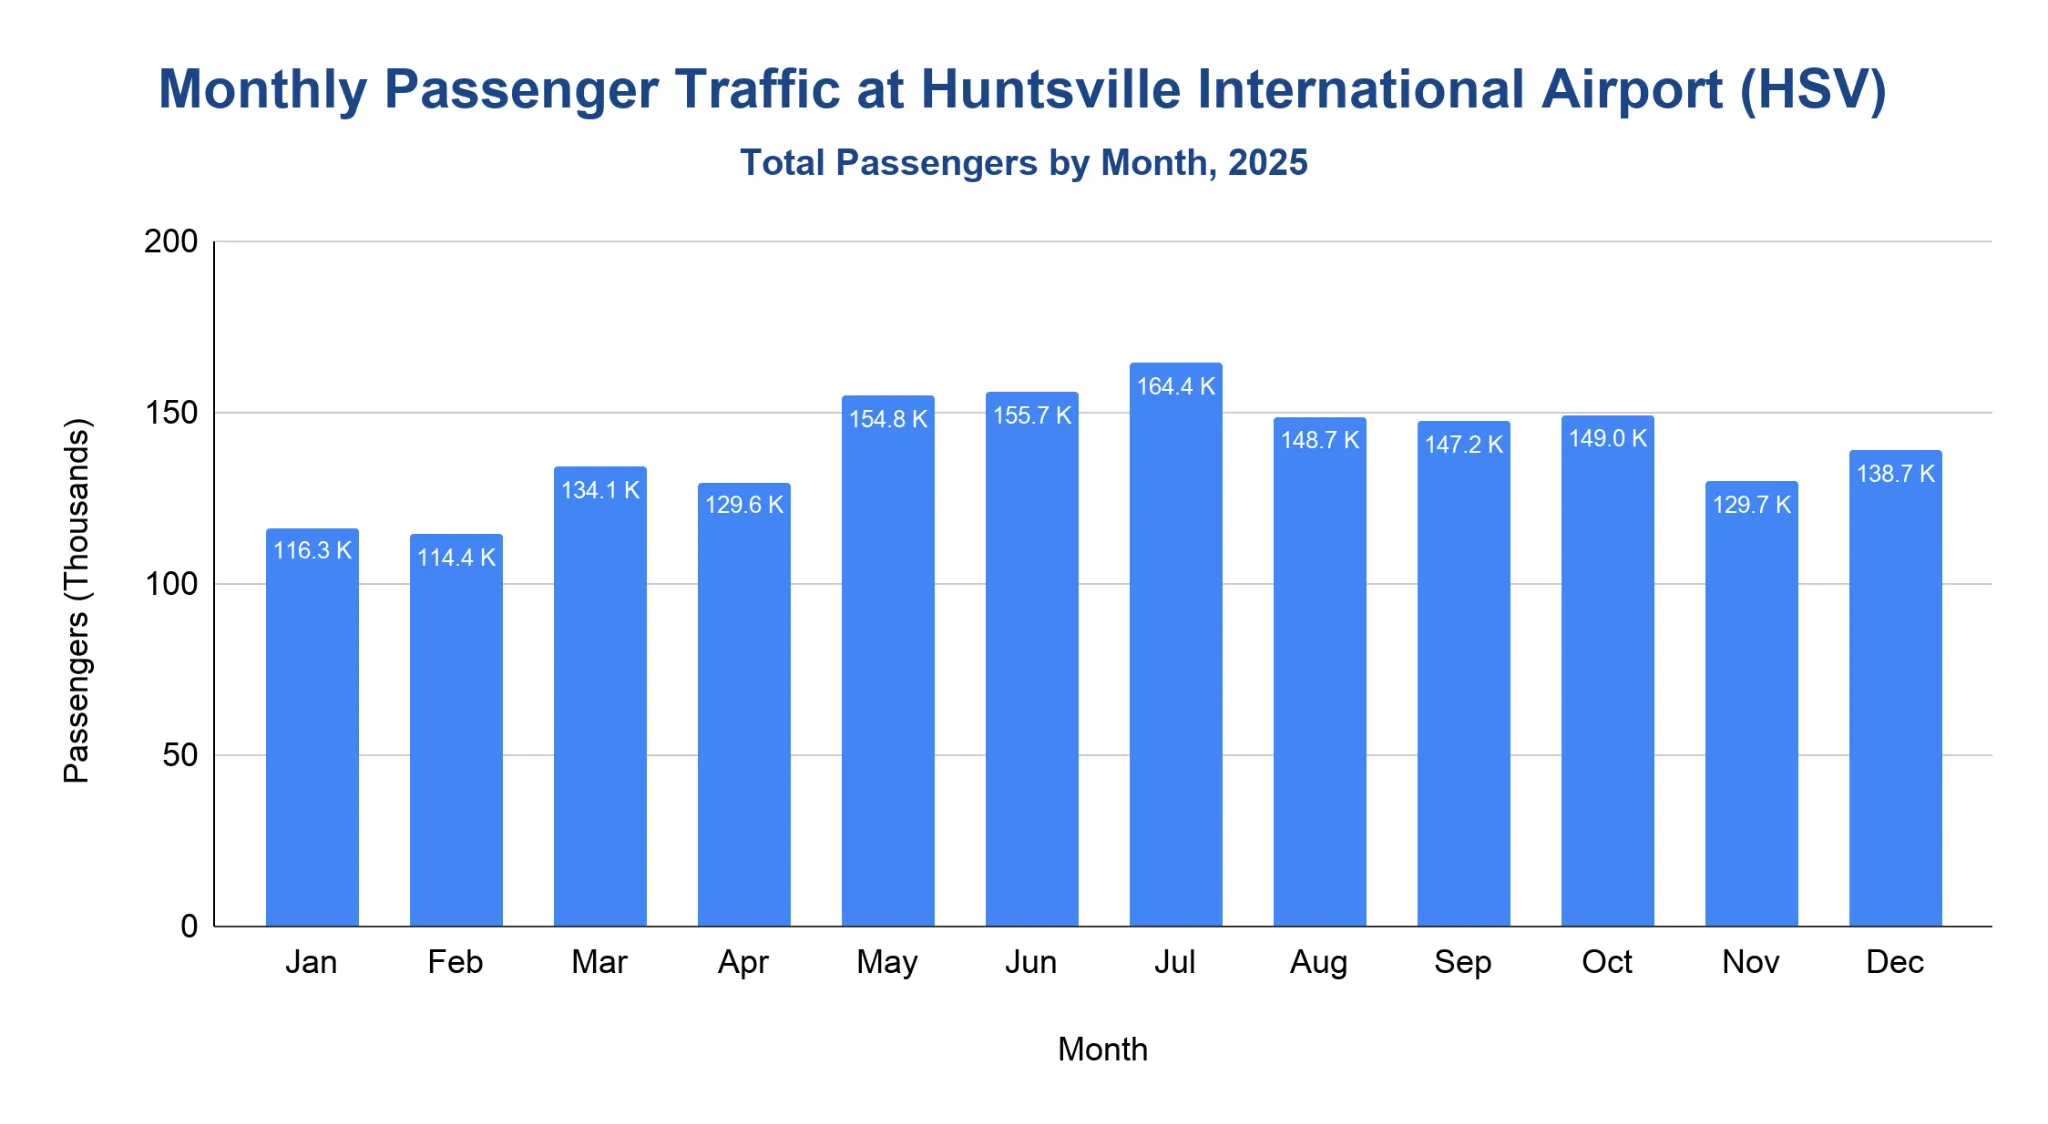
July was HSV’s busiest month in 2025, with 164,419 passengers in BTS T-100 Market records where HSV appeared as the origin or destination.
- Summer was the strongest travel period, with May, June and July each above 154,000 combined origin-and-destination passengers.
- July 2025 led the year with 81,543 origin passengers and 82,876 destination passengers.
- June 2025 ranked second with 155,738 combined passengers.
- May 2025 ranked third with 154,791 combined passengers.
- February 2025 was the slowest month in this series, with 114,388 combined passengers.
Note: This table adds passengers reported with HSV as the origin and passengers reported with HSV as the destination. It should be read as a monthly BTS market view, not as a replacement for the airport authority’s total passenger counts.
How much cargo moves through Huntsville International Airport?
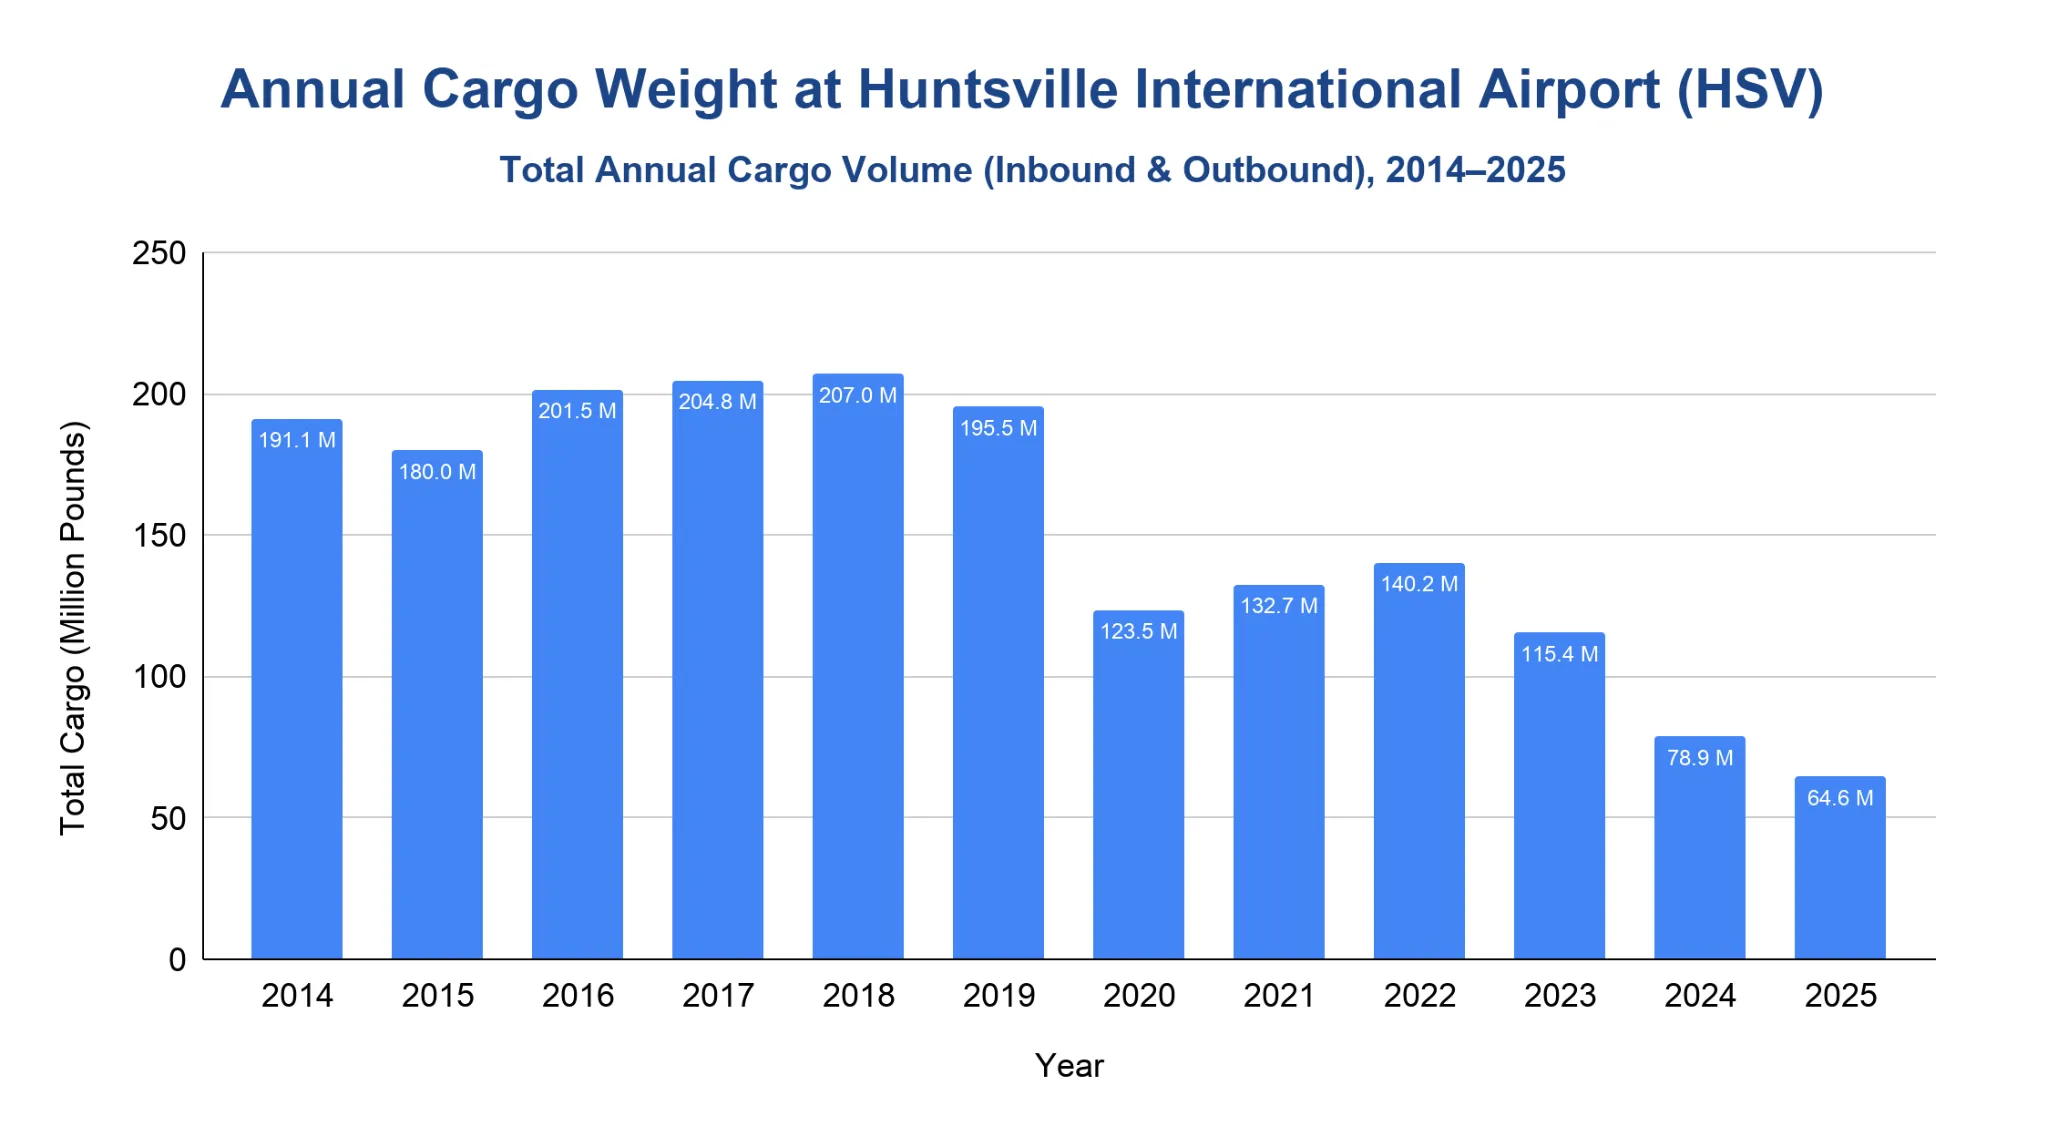
HSV processed 64.6 million pounds of cargo freight in 2025, below its 2018 peak.
- Cargo freight weight rose from 191.1 million pounds in 2014 to 207 million pounds in 2018, the highest year.
- Pre-pandemic cargo remained high at 195.5 million pounds in 2019.
- Cargo fell to 123.5 million pounds in 2020, down 36.8% from 2019.
- Post-pandemic cargo rebounded to 132.7 million pounds in 2021 and 140.2 million pounds in 2022.
- Volumes then declined to 115.4 million pounds in 2023, 78.9 million pounds in 2024 and 64.6 million pounds in 2025.
- As of March 2026, HSV had processed 18.8 million pounds year to date, up 29.8% from the same period in 2025.
How much revenue does Huntsville International Airport generate each year?
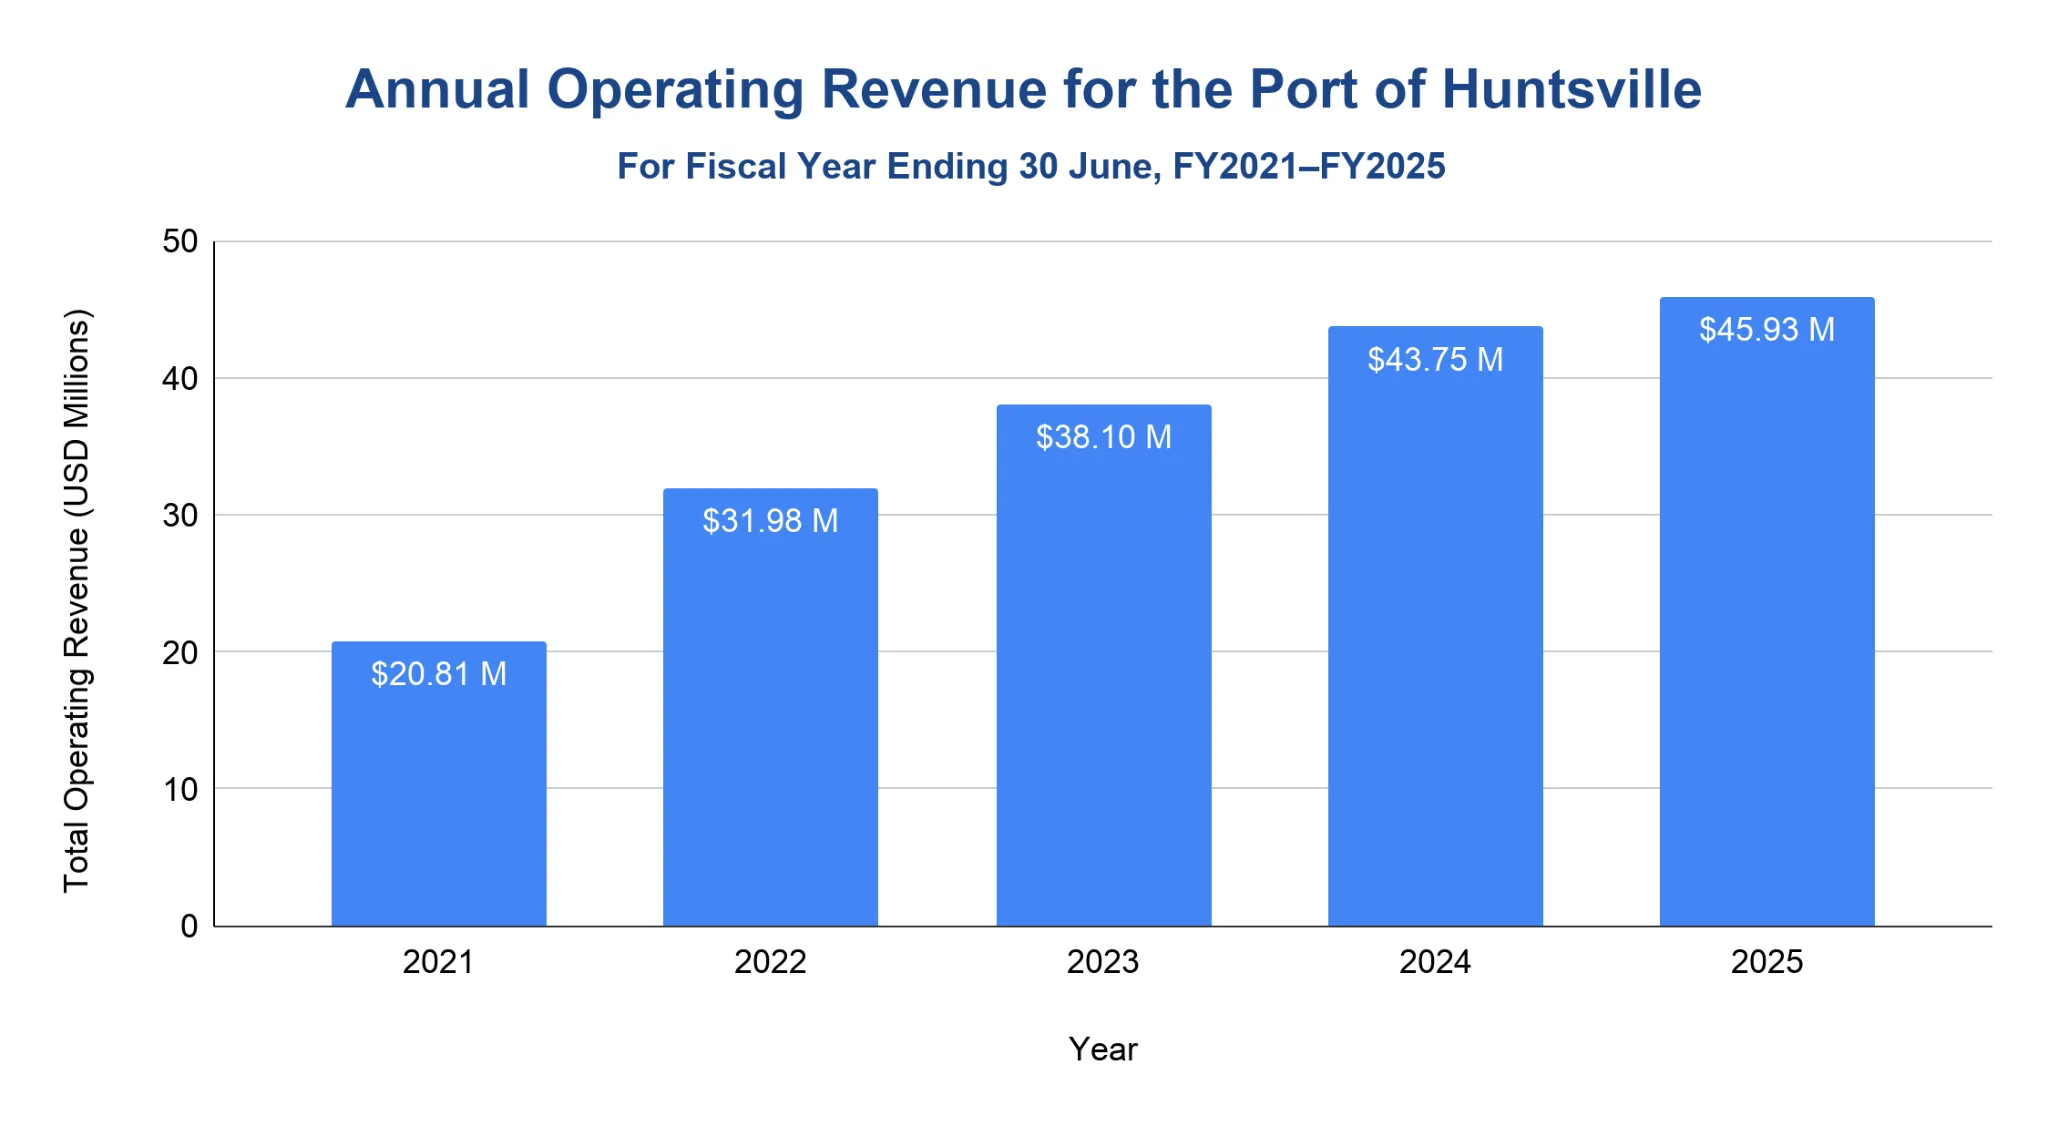
The Huntsville-Madison County Airport Authority reported $45.93 million in total operating revenue for fiscal year 2025.
- Operating revenue fell to $20.81 million in fiscal year 2021, the lowest year in the available audited series below.
- Revenue recovered to $31.98 million in fiscal year 2022, though the authority said that was still $5 million below fiscal year 2019.
- Fiscal year 2023 operating revenue reached $38.1 million, then rose to $43.75 million in fiscal year 2024.
- Fiscal year 2025 operating revenue increased again to $45.93 million, up 5% from fiscal year 2024.
- About 23% of fiscal year 2025 revenues were earned directly from passenger airlines.
Note: The authority’s fiscal year ends June 30.
Huntsville International Airport's On-Time Performance
In the BTS latest rolling period, March 2025–February 2026, 75% of HSV departures and 73% of arrivals were on time.
- Departure on-time performance was slightly above the 2025 calendar-year figure of 74%.
- Arrival on-time performance matched the 2025 calendar-year figure at 73%.
- The average departure delay was 89.47 minutes, while the average arrival delay was 76.82 minutes.
- The cancellation rate improved from 2.85% in 2025 to 2.46% in the latest rolling period.
- Performance remained below the stronger post-pandemic years of 2021–2023, when departure on-time rates ranged from 80% to 86%.
| Metric | 2021 | 2022 | 2023 | 2024 | 2025 | 2026* |
|---|---|---|---|---|---|---|
| On-time departures | 86% | 80% | 83% | 78% | 74% | 75% |
| On-time arrivals | 83% | 78% | 82% | 78% | 73% | 73% |
| Avg. departure delay (min.) | 78.04 | 78.46 | 84.71 | 78.58 | 91.43 | 89.47 |
| Avg. arrival delay (min.) | 56.82 | 66.78 | 67.54 | 67.39 | 77.37 | 76.82 |
| Cancellation rate | 1.74% | 2.26% | 0.96% | 1.50% | 2.85% | 2.46% |
Source · BTS counts a flight as delayed when it arrives or departs 15 minutes or more after schedule. Average delay minutes are calculated from delayed flights only. 2026 covers March 2025 through February 2026. BTS publishes average delays in decimal-minute format. As such, the values have been kept exactly as reported to avoid altering the underlying data.
Major Expansion Projects at Huntsville International Airport
The Port of Huntsville completed $61 million in construction projects in fiscal year 2025 while continuing HSV Refresh terminal improvements.
- The fiscal year 2025 program included a $14 million renovation of concourse elevators and escalators, improving accessibility and adding breach-control exit lanes.
- A $5.7 million expansion and renovation of concourse restrooms opened in 2025, including larger restroom space and passenger amenities.
- HSV completed a $9.8 million rehabilitation of Taxiway Whiskey in fiscal year 2025.
- The Port also began a $17 million Airport Rescue and Fire Fighting (ARFF) facility project in fiscal year 2025.
- HSV Refresh updates included a new cell phone waiting lot, expanded rental car return capacity, dedicated family and mobility restrooms, expanded concourse restrooms, added surface parking and new food-and-beverage options near Gate 8.
Note: Project timing follows the Port’s fiscal-year reporting and HSV Refresh public updates; costs are shown only where the Port published project amounts.
Related Travel Statistics
- Albany International Airport (ALB) Statistics
- Boise Airport Statistics
- Buffalo Airport (BUF) Statistics
- Colorado Springs Airport Statistics
- Gainesville Regional Airport Statistics
- Grand Rapids Airport (GRR) Statistics
- Miami International Airport Statistics
- Missoula Montana Airport (MSO) Statistics
- Monterey Regional Airport (MRY) Statistics
- Tweed–New Haven Airport (HVN) Statistics
- Raleigh-Durham International Airport Statistics
- Roanoke-Blacksburg Regional Airport Statistics
Huntsville International Airport Safety
HSV’s official safety materials describe a proactive Safety Management System and 24-hour on-site public safety coverage.
- The airport’s Safety Management System identifies, assesses and mitigates safety risks before incidents occur.
- The system is built around safety policy, safety promotion, safety risk management and safety assurance.
- The Port’s Department of Public Safety provides police, fire and first-response emergency medical services for HSV and other Port facilities.
- Public safety personnel provide 24-hour on-site police, fire and emergency medical services.
Note: This section describes documented safety programs and emergency-response capacity.
How does Huntsville International rank in the United States and worldwide?
The latest FAA commercial-service ranking places HSV 111th by 2024 passenger enplanements.
- The FAA ranked HSV 111th among U.S. commercial service airports in calendar year 2024, with 804,665 passenger enplanements.
- HSV was classified as a small-hub primary airport in the FAA’s 2024 enplanement list.
- By the same FAA enplanement metric, HSV ranked behind Birmingham-Shuttlesworth International Airport in Alabama.
- FAA all-cargo data ranked HSV 86th in calendar year 2024 by all-cargo landed weight, with 254.2 million pounds.
- The FAA had not yet published final calendar year 2025 passenger enplanement rankings at the time of review.
References
- Port of Huntsville — Airport, Passenger, Cargo, Route, Safety and HSV Refresh Data · portofhuntsville.com
- Huntsville-Madison County Airport Authority — Annual Reports, Audited Financials, Airline Share and Capital Projects (FY2021–FY2025) · annualreport.portofhuntsville.com
- FAA Passenger Boarding and All-Cargo Data Master · faa.gov
- FAA OPSNET — Airport Operations Standard Report for HSV (January 2014–March 2026) · aspm.faa.gov
- BTS Airline, Destination, Monthly Passenger, and On-Time Data (2021–2026) · transtats.bts.gov

