

 Popular Countries
 24/7 Support
Published Sep 9, 2026
Located in Cascade Township southeast of downtown Grand Rapids, Gerald R. Ford International Airport (GRR) has operated at its current site since 1963 and was renamed in 1999 to honor President Gerald R. Ford. Today, it is Michigan’s second-busiest airport, serving more than 4 million total passengers in 2025.
How many passengers fly through Gerald R. Ford International Airport each year?
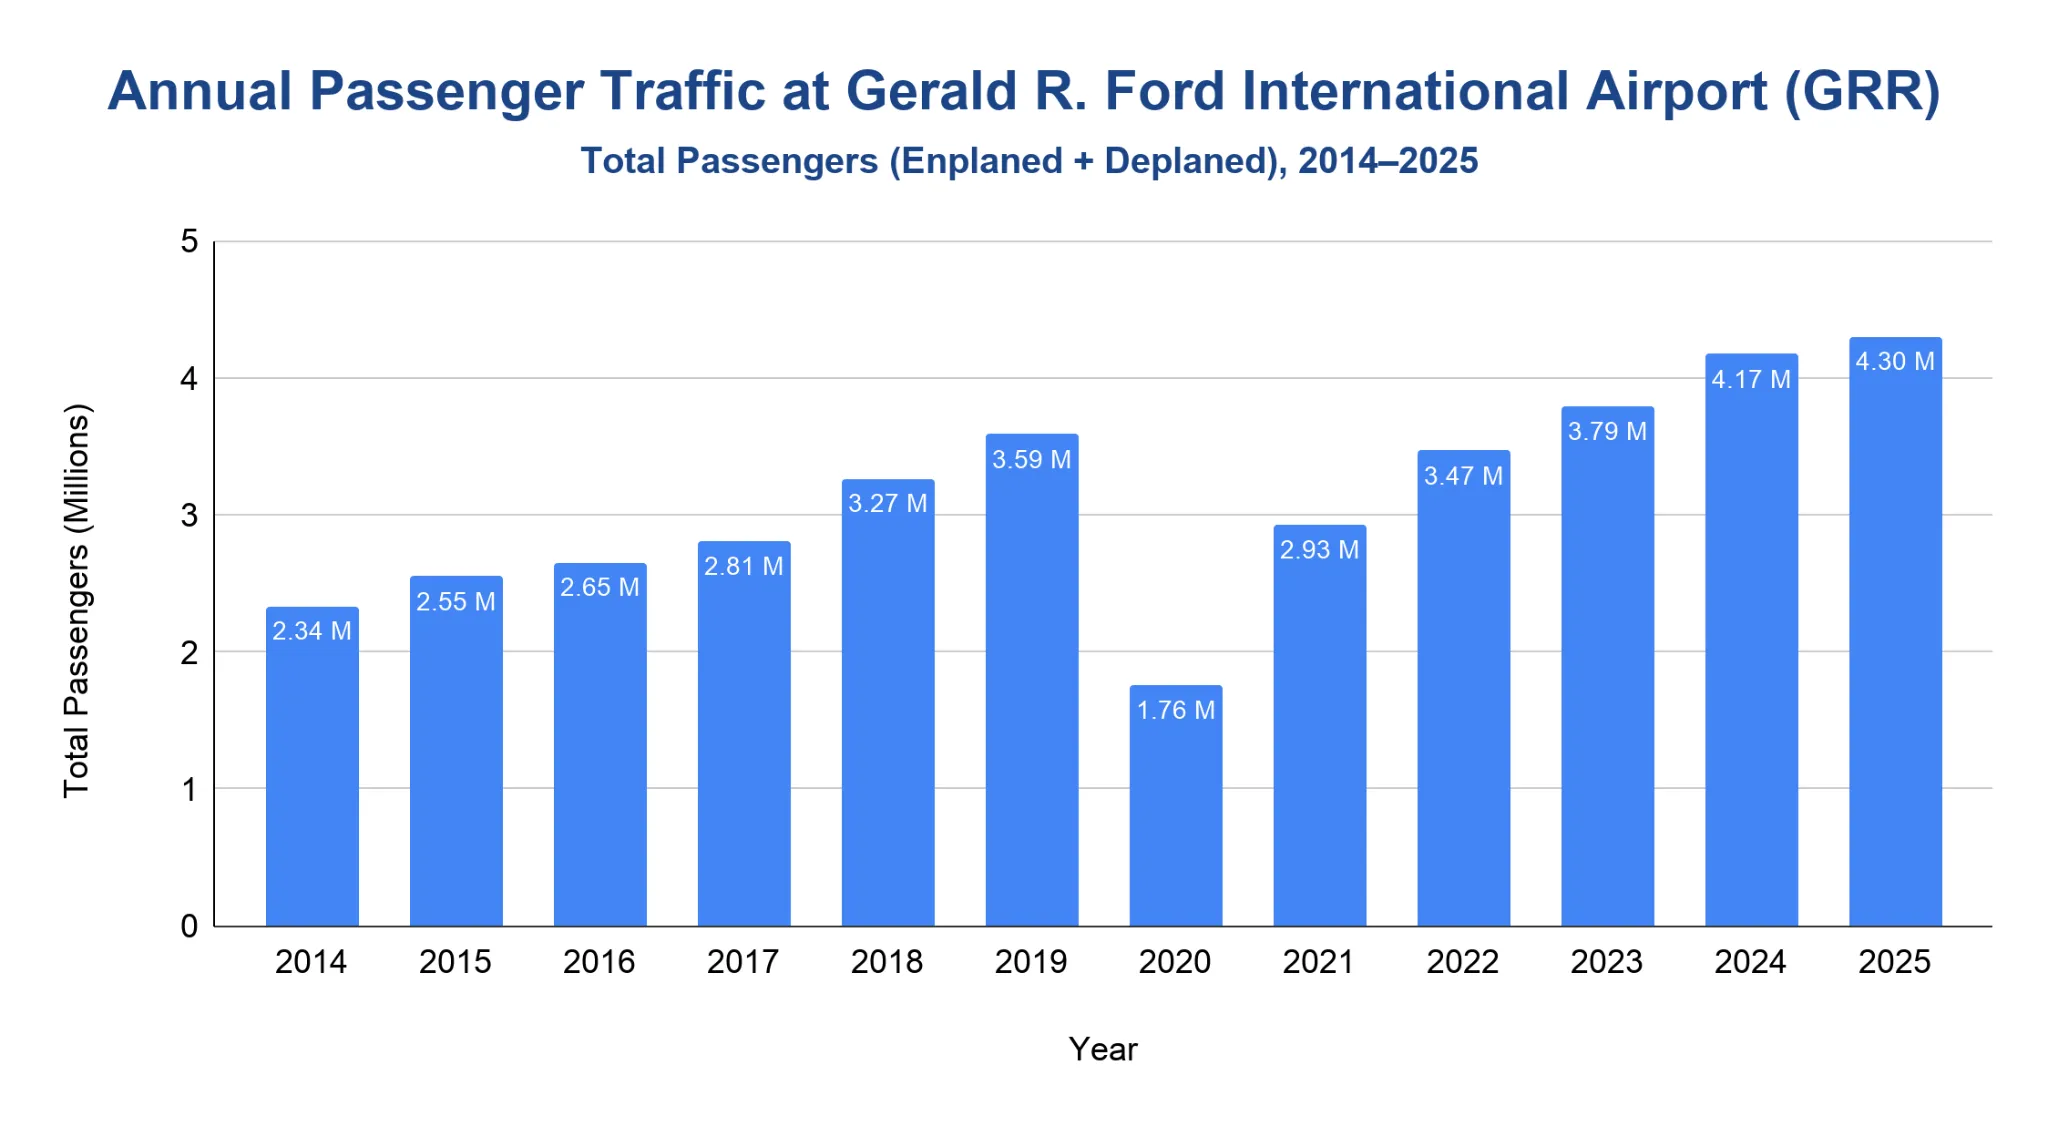
Gerald R. Ford International Airport handled 4.3 million total passengers in 2025, setting another annual passenger record.
- From 2014 through 2018, passenger traffic rose steadily from 2.34 million to 3.27 million as GRR moved past the 3 million passenger mark.
- Pre-pandemic traffic peaked at 3.59 million passengers in 2019, up about 53.6% from 2014.
- The pandemic cut traffic to 1.76 million passengers in 2020, a 51% drop from 2019.
- Recovery was quick, with volumes rebounding to 2.93 million passengers in 2021, 3.47 million in 2022 and 3.79 million in 2023.
- The airport crossed the 4 million mark in 2024 and reached 4.3 million total passengers in 2025, a 3.15% increase over 2024.
- As of March 2026, GRR had handled 1.01 million total passengers, representing a slight decrease compared to the same period in 2025.
Note: Total passengers / passenger traffic equals enplaned plus deplaned passengers.
Does Gerald R. Ford International Airport offer domestic and international service?
GRR lists nonstop service to more than 35 cities in the United States through its commercial airline network. Scheduled service at GRR is primarily domestic - however, there is a Federal Inspection Station project in progress that is intended to support future international passenger processing.
- The airport’s official nonstop-route page describes service to more than 35 major cities in the U.S.
- The airport’s Frequently Asked Questions (FAQ) page lists 8 passenger airlines and 100+ daily nonstop scheduled flights.
- Official airport materials describe GRR as serving more than 4 million passengers annually.
- A Federal Inspection Station project is planned to support passenger customs processing for arriving international passengers.
- Phase 1 of the Federal Inspection Station was a $10 million investment completed in 2021; Phases 2 and 3 are listed at $35 million and scheduled for completion in 2027.
How many aircraft operations take place at Gerald R. Ford International Airport each year?
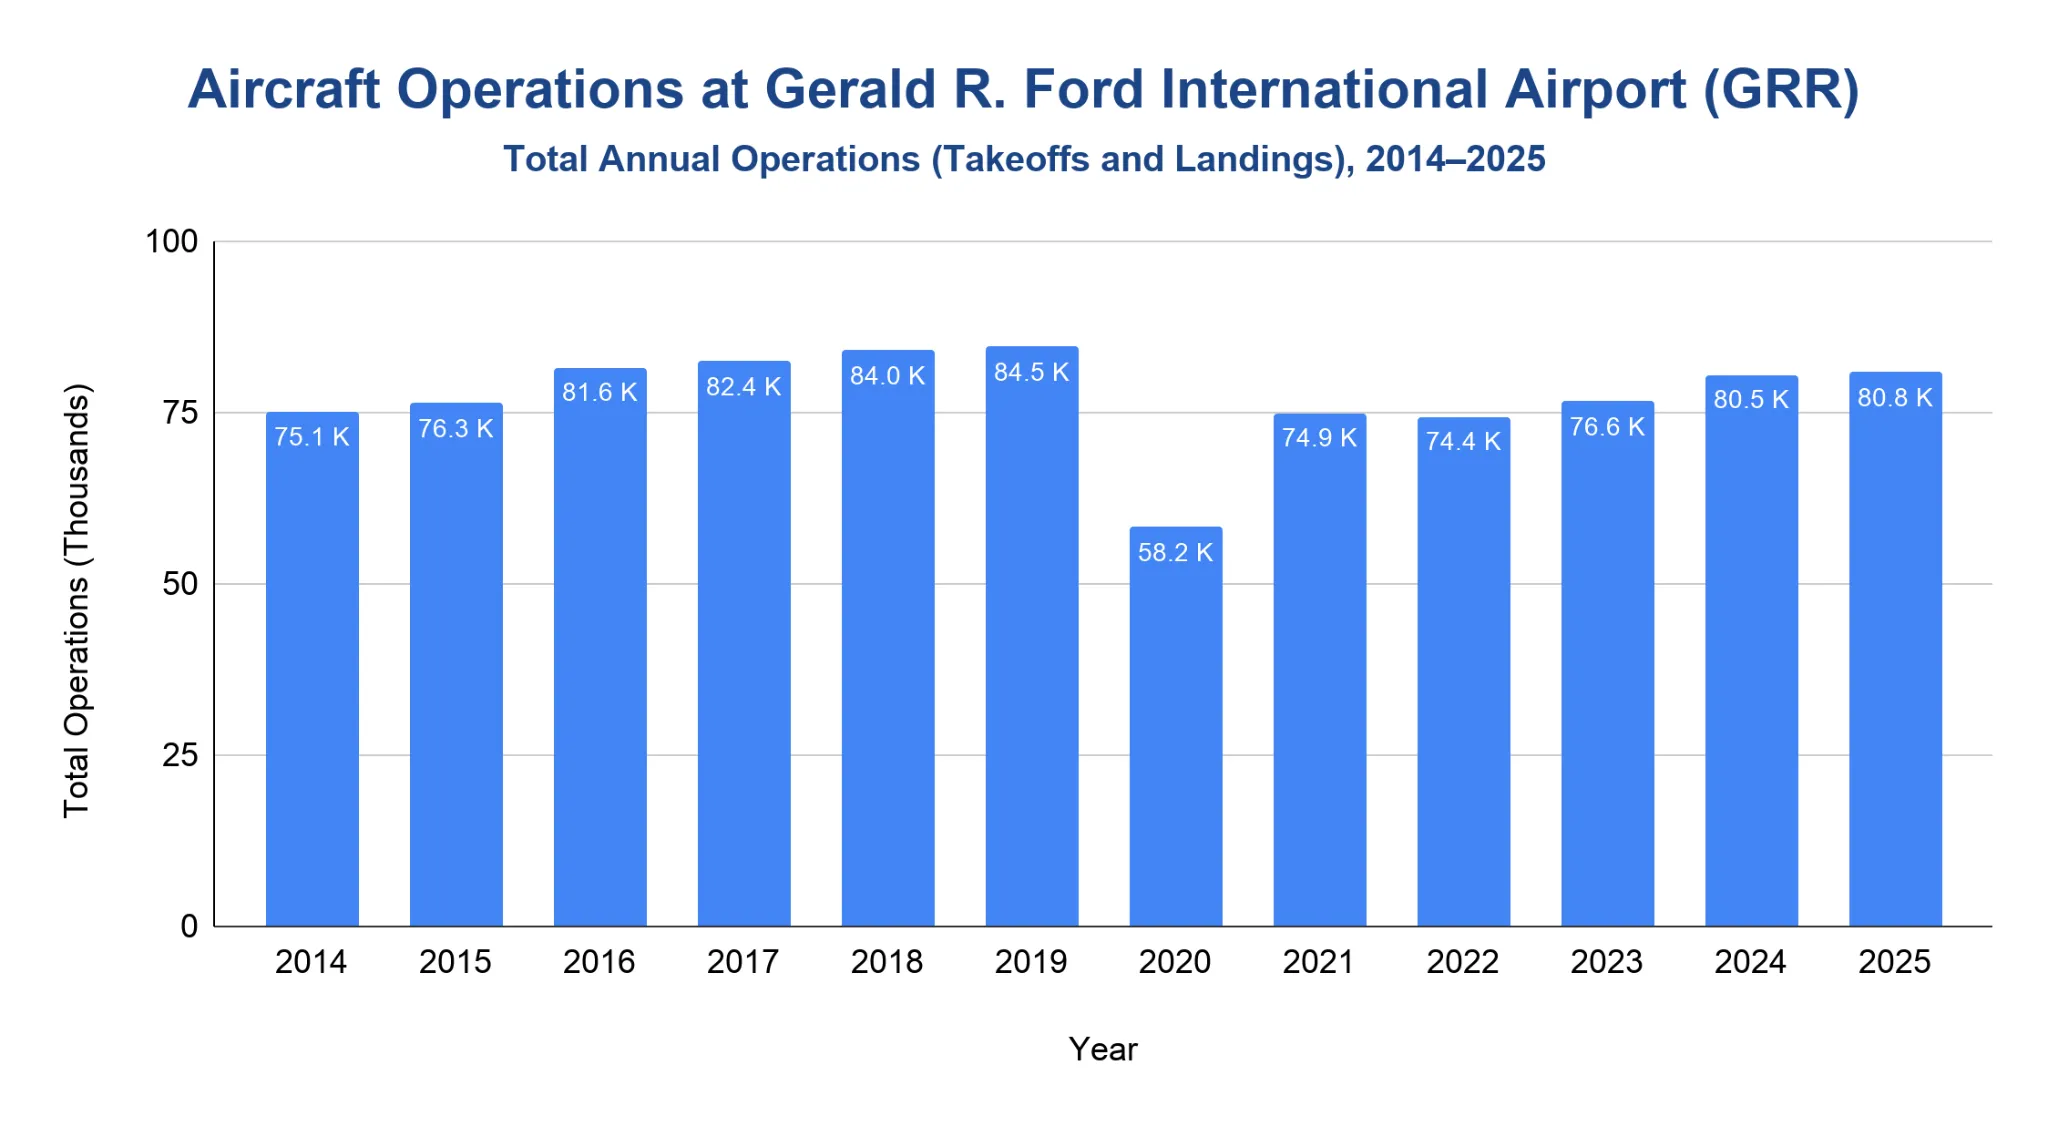
GRR recorded 80,849 total aircraft operations in 2025, slightly above the 80,469 operations logged in 2024.
- From 2014 through 2019, total aircraft operations stayed consistently between 75,000 and 85,000, reaching 84,538 in 2019.
- Operations fell to 58,170 in 2020 during the pandemic, then rebounded to 74,876 in 2021.
- Post-pandemic operations remained in the mid-70,000s in 2022 and 2023 before rising above 80,000 in 2024.
- Air carrier operations reached 41,306 in 2025, while commuter operations totaled 11,242.
- General aviation contributed 27,884 operations in 2025, split between 21,427 itinerant and 6,457 local operations.
- As of March 2026, aircraft operations totaled 17,833, up 0.98% from the same period in 2025.
| Aircraft Operations by Type at GRR | |
|---|---|
| 2025 Operations by Type | Operations |
| Air carrier | 41,306 |
| Commuter | 11,242 |
| General aviation | 27,884 |
| Military | 417 |
| Total aircraft operations | 80,849 |
Source · Note: General aviation combines itinerant and local general-aviation operations.
Which airlines carry the most passengers at Gerald R. Ford International Airport?
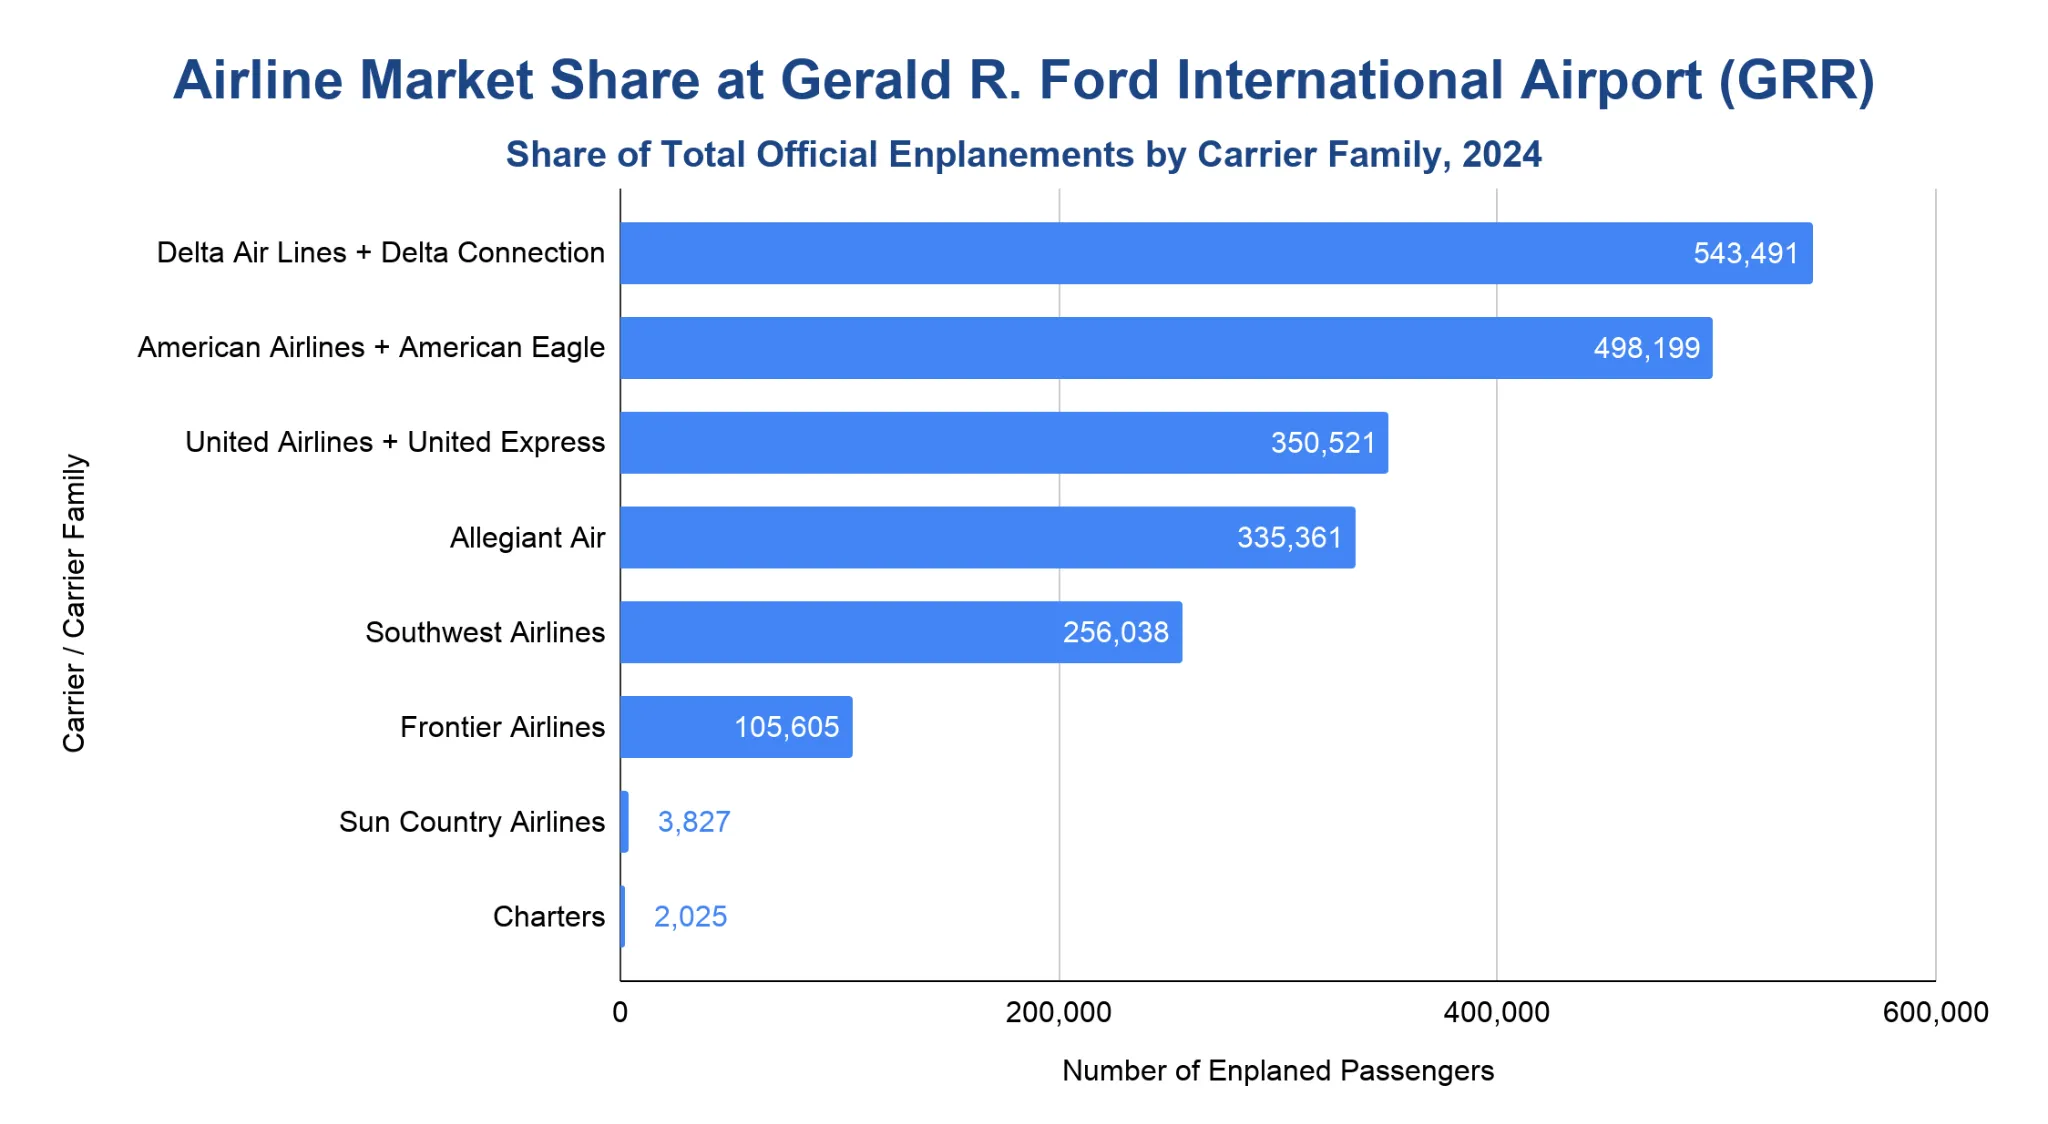
Delta-family carriers led GRR in 2024 with 543,491 official enplaned passengers, about 25.9% of airport boardings.
- Delta Air Lines and Delta Connection carriers accounted for 543,491 enplanements in 2024.
- American Airlines and American Eagle carriers followed with 498,199 enplanements.
- United Airlines and United Express carriers handled 350,521 enplanements.
- Allegiant Air carried 335,361 enplaned passengers, while Southwest Airlines carried 256,038.
- Frontier Airlines recorded 105,605 enplanements, with Sun Country Airlines and charters making up smaller shares.
Note: This section uses official enplaned passengers, meaning departing passenger boardings only.
What are the busiest destinations from Gerald R. Ford International Airport?
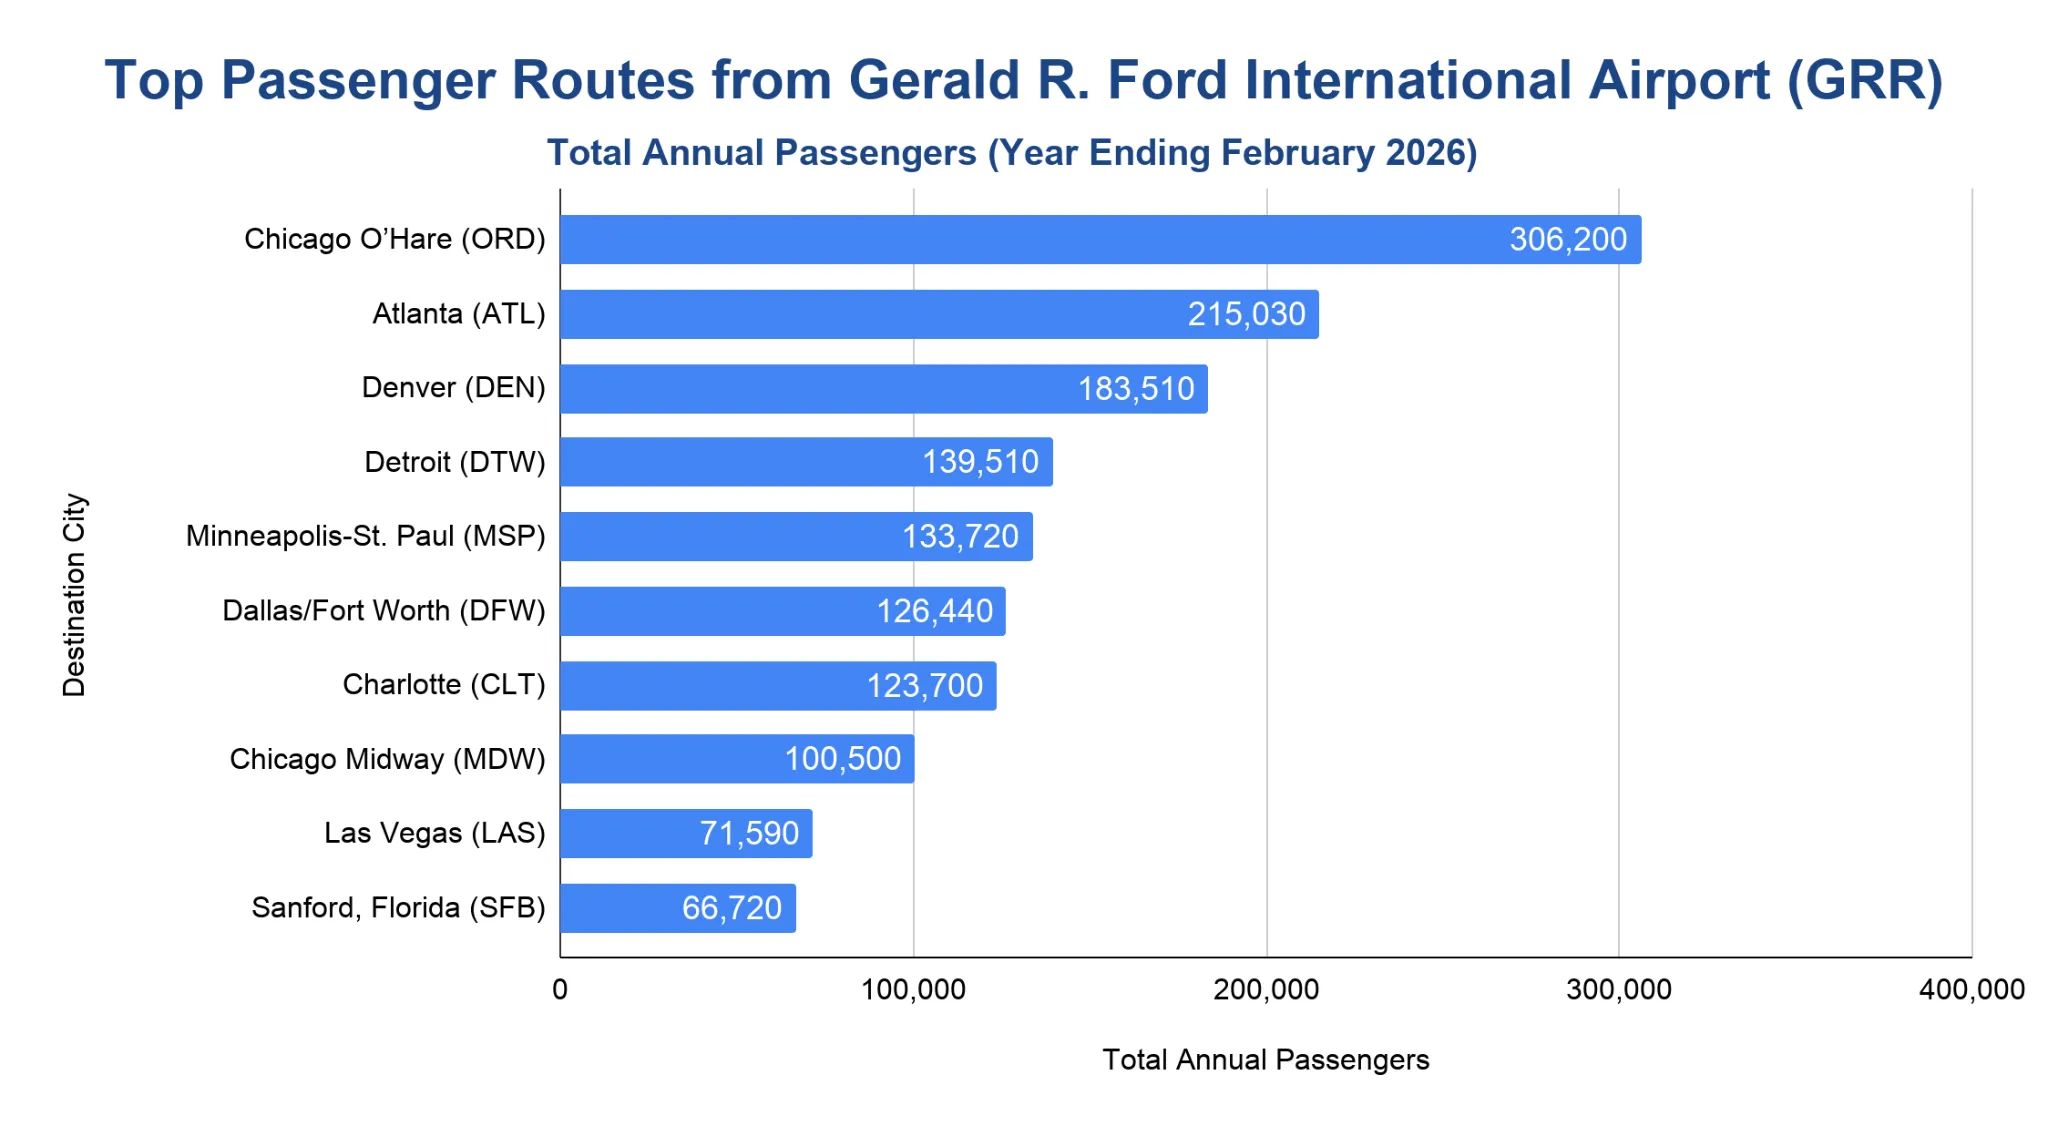
Chicago O’Hare was GRR’s busiest U.S. destination in the March 2025–February 2026 Bureau of Transportation Statistics (BTS) snapshot period, with 306,200 passengers.
- Chicago O’Hare (ORD) led the market with 306,200 U.S. domestic passengers.
- Atlanta (ATL) followed with 215,030 passengers, while Denver (DEN) ranked third with 183,510.
- Detroit (DTW) and Minneapolis-St. Paul (MSP) remained major Midwest links, carrying 139,510 and 133,720 passengers, respectively.
- Dallas/Fort Worth (DFW), Charlotte (CLT) and Chicago Midway (MDW) each exceeded 100,000 passengers.
- Las Vegas (LAS) and Sanford, Florida (SFB) rounded out the top 10, reflecting GRR’s mix of hub and leisure markets.
Note: BTS Airport Snapshot route figures are U.S. domestic market passengers from the T-100 Domestic Market data series. The 2026 snapshot period represents March 2025 through February 2026.
Peak Travel Months at Gerald R. Ford International Airport
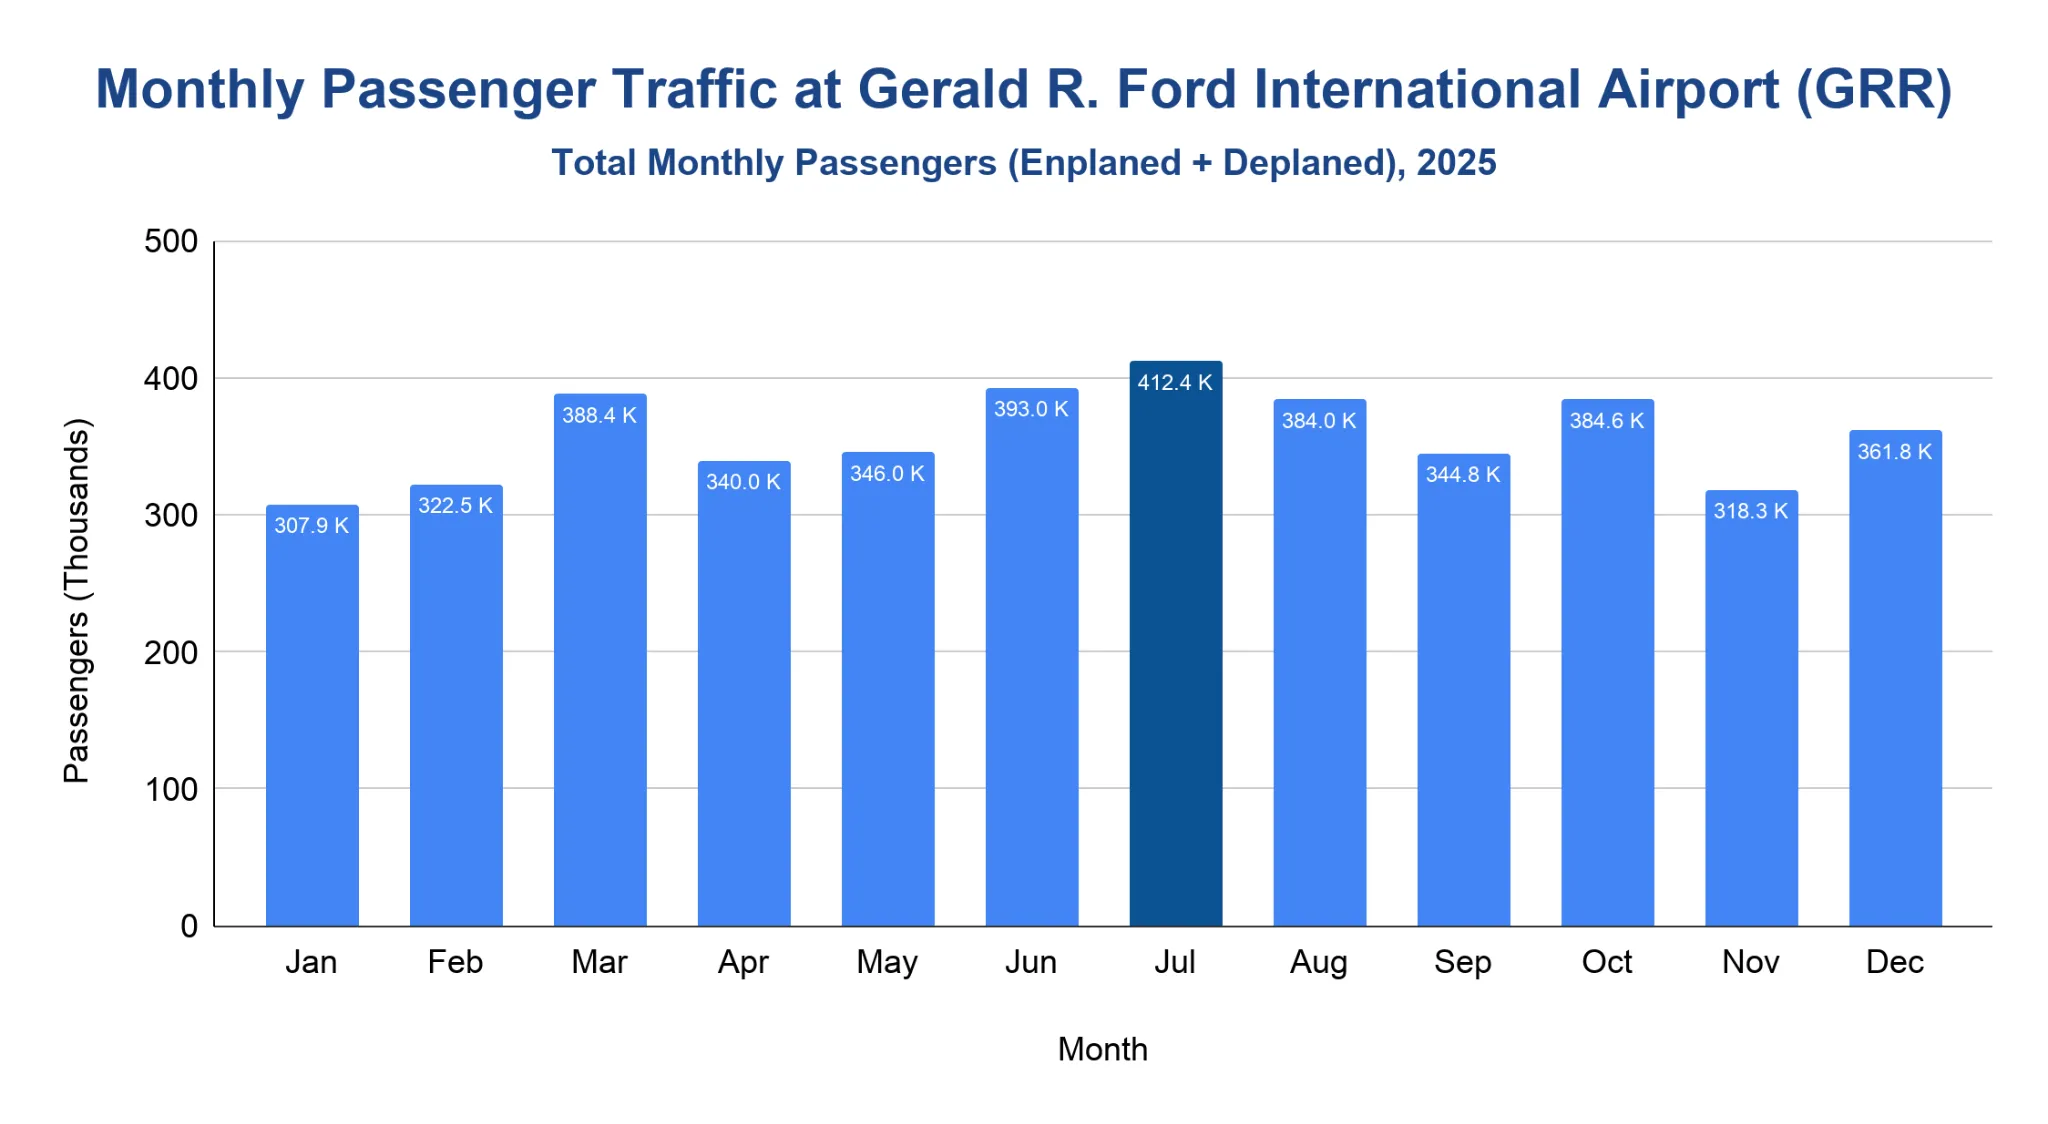
July was GRR’s busiest month in 2025, with 412,433 total passengers.
- Traffic started the year with 307,884 passengers in January and 322,478 in February.
- Spring travel lifted March to 388,411 passengers before April and May settled near the mid-300,000s.
- Summer was the strongest period, with June, July and August each exceeding 380,000 total passengers.
- July led the year with 412,433 total passengers, followed by June at 393,001.
- The July-through-September quarter accounted for 1.14 million passengers, about 26.5% of annual 2025 traffic.
- October stayed elevated at 384,571 passengers before November eased to 318,292 and December closed the year at 361,841.
Note: Monthly totals use total passenger activity, which equals enplaned plus deplaned passengers.
How much annual revenue does Gerald R. Ford International Airport generate?
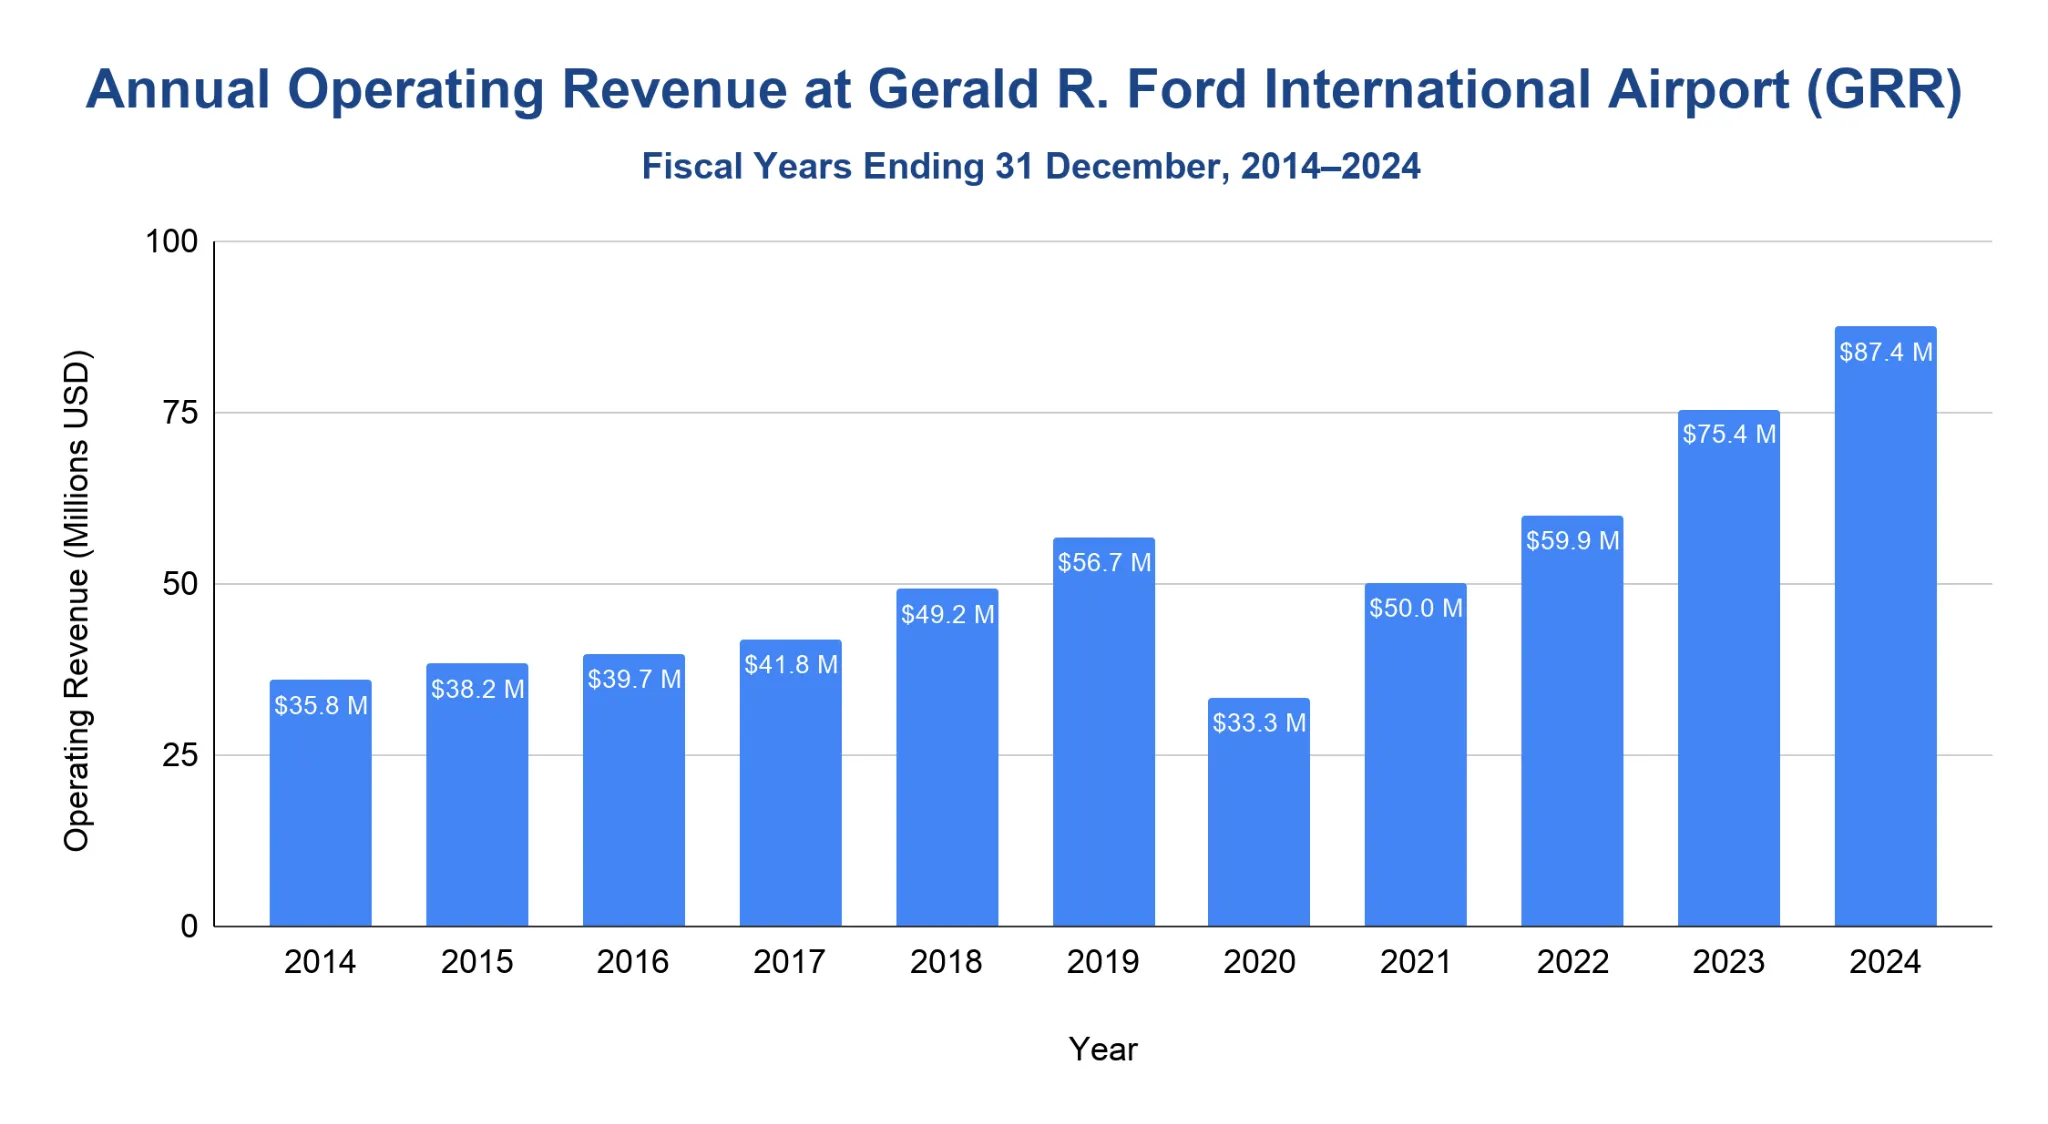
GRR posted $87.44 million in operating revenue in 2024, up from $75.43 million in 2023.
- Operating revenue moved from $35.84 million in 2014 to $49.18 million in 2018 as passenger traffic expanded.
- Pre-pandemic revenue reached $56.73 million in 2019, then dropped to $33.26 million in 2020.
- The recovery period lifted operating revenue to $50.03 million in 2021, $59.86 million in 2022 and $75.43 million in 2023.
- Ground transportation generated $40.27 million in 2024, the airport’s largest operating revenue line.
- Passenger airlines generated $28.72 million in 2024.
- Operating income reached $8.57 million in 2024, improving from $5.6 million in 2023.
Note: The graph uses the airport authority’s fiscal-year statistical sections. The official 2025 audited financial data is not yet available.
How much cargo moves through Gerald R. Ford International Airport each year?
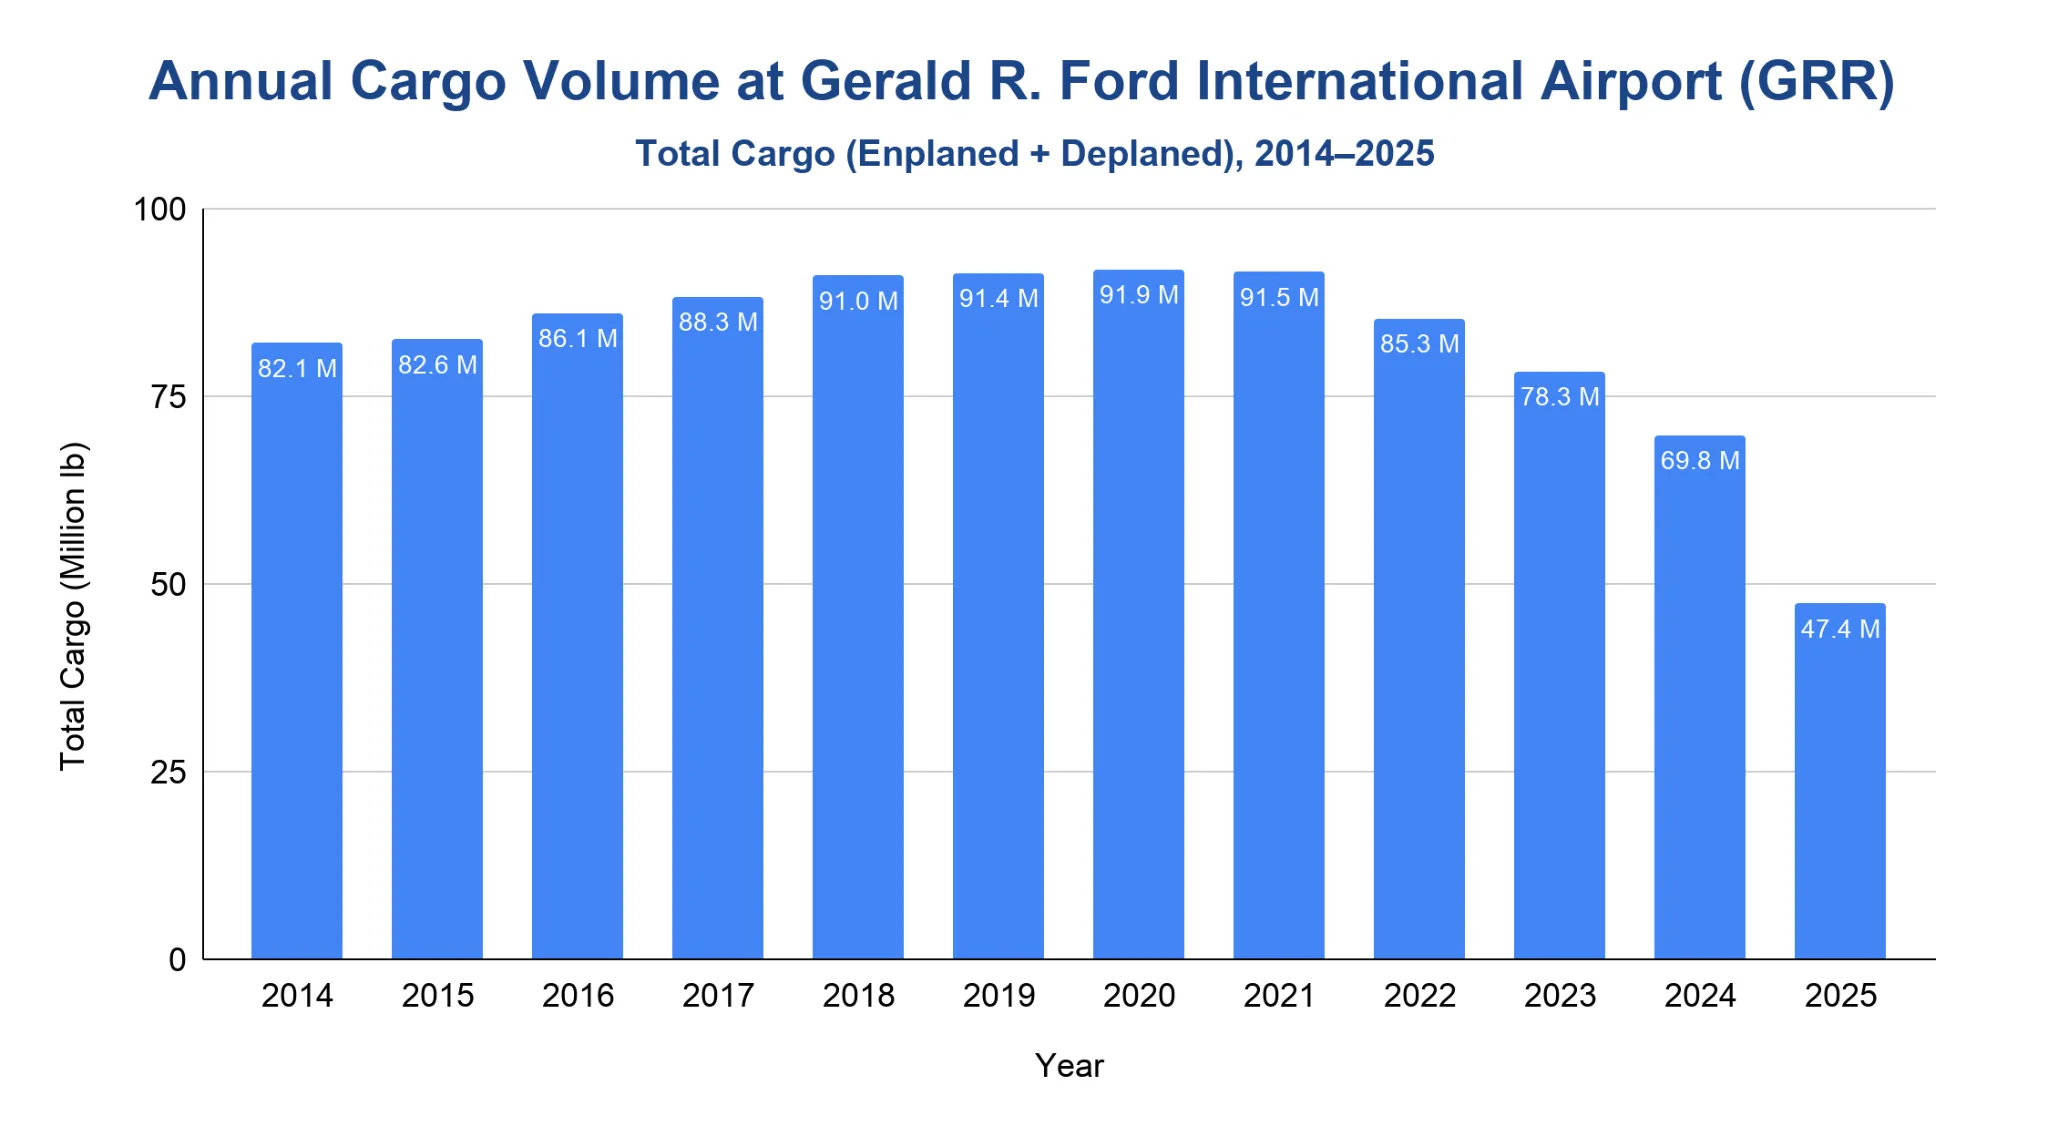
GRR handled 47.39 million lb of cargo in 2025, down 32.1% from 2024.
- Cargo activity was much higher in the pre-pandemic years, rising from 82.09 million lb in 2014 to 91.40 million lb in 2019.
- Pandemic-era cargo remained strong, reaching 91.88 million lb in 2020 and 91.51 million lb in 2021.
- Volumes eased to 85.28 million lb in 2022, 78.25 million lb in 2023 and 69.79 million lb in 2024.
- Cargo dropped again in 2025, falling to 47.39 million lb, the lowest full-year total in the displayed series.
- As of March 2026, cargo activity totaled 10.86 million lb, up 2.73% from the same period in 2025.
Note: Cargo totals include enplaned and deplaned freight and mail.
What is Gerald R. Ford International Airport's on-time performance?
GRR’s departure on-time rate was 80% for major-carrier domestic flights in the March 2025–February 2026 BTS snapshot period.
- Departure on-time performance was strongest at 84% in 2021 and 2023, then held near 80% in 2025 and the latest rolling period.
- Arrival on-time performance moved from 79% in 2021 to 73% in 2022, recovered to 78% in 2023 and stood at 74% in 2025 and the March 2025–February 2026 period.
- Average departure delay for delayed flights was 84.34 minutes in the latest BTS snapshot period.
- Average arrival delay for delayed flights was 71.95 minutes in the same period.
- The cancellation rate was 1.4%, down from the 3.65% spike recorded in 2022.
- BTS counted 16,000 reporting domestic flights in the latest snapshot period.
| Airport On-Time Performance at GRR | ||||||
|---|---|---|---|---|---|---|
| Metric | 2021 | 2022 | 2023 | 2024 | 2025 | 2026* |
| On-time departures | 84% | 78% | 84% | 81% | 80% | 80% |
| On-time arrivals | 79% | 73% | 78% | 77% | 74% | 74% |
| Average departure delay (min.) | 78.10 | 84.46 | 85.96 | 85.68 | 84.30 | 84.34 |
| Average arrival delay (min.) | 63.22 | 68.87 | 69.12 | 69.49 | 71.17 | 71.95 |
| Cancellation rate | 1.63% | 3.65% | 1.37% | 1.60% | 1.43% | 1.40% |
| Reporting flights (000) | 15.4 | 16.0 | 16.6 | 18.2 | 18.6 | 16.0 |
Source · Note: BTS defines a delayed flight as arriving or departing 15 or more minutes after schedule. Average delay minutes are calculated from delayed flights only. *2026 reflects March 2025–February 2026. BTS publishes average delays in decimal-minute format. As such, the values have been kept exactly as reported to avoid altering the underlying data.
Major Expansion Projects at Gerald R. Ford International Airport
GRR’s approved 2025 capital improvement plan totals $1.025 billion across terminal, parking, rental-car and inspection-facility projects.
- The Concourse A Expansion added 8 new gates in Phase 1 and was part of a $110 million project.
- The Consolidated Rental Car Facility carries a $144 million cost and is scheduled to complete in 2025 and open in 2026.
- Terminal Enhancements total $158.5 million and are scheduled for completion in 2026.
- The Federal Inspection Station had a $10 million Phase 1 completed in 2021; Phases 2 and 3 are listed at $35 million and scheduled for 2027.
- Other listed projects include the $28 million Grand Canopy Extension, $20 million Baggage Claim Expansion and $160 million North Parking Structure Phase 1.
- The airport is also discussing air traffic control tower relocation with the Federal Aviation Administration (FAA), with relocation costs planned to be funded by the FAA.
Note: Project costs and timing can change as design and construction progress; the above uses the latest airport authority financial report where available.
Related Travel Statistics
- Charlotte Douglas Airport Statistics
- Cleveland Hopkins Airport Statistics
- Fort Lauderdale Airport (FLL) Statistics
- George Bush Airport (IAH) Statistics
- Hilo International Airport Statistics
- Montrose Regional Airport (MTJ) Statistics
- O’Hare International Airport Statistics
- Eppley Airfield (OMA) Statistics
- Orlando Airport (MCO) Statistics
- Peoria Airport (PIA) Statistics
- Pittsburgh Airport (PIT) Statistics
- Wilmington International Airport Statistics
Gerald R. Ford International Airport Sustainability Initiatives
GRR achieved Level 2 Airport Carbon Accreditation in 2024 and targets a 20% reduction in Scope 1 and Scope 2 emissions per passenger by 2035.
- The airport’s carbon policy targets a 20% reduction in Scope 1 and Scope 2 emissions per passenger by 2035, measured against 2021 levels.
- GRR was one of 57 commercial airports in North America certified through the Airport Carbon Accreditation program.
- The Concourse A expansion targeted and met a 70% energy-reduction goal.
- The airport provides 8 universal electric-vehicle chargers in the Short Term Parking area.
- Recycling includes 20 terminal receptacles through Kent County’s recycling program.
Note: The carbon target is measured per passenger, so it accounts for growth in airport activity.
What is Gerald R. Ford International Airport's economic impact?
GRR’s latest official economic-impact study found $7.7 billion in annual economic activity and 40,324 jobs across West Michigan.
- The study reports 40,324 jobs supported across the 13-county West Michigan Economic Development Region.
- Annual economic activity totals $7.7 billion across the West Michigan region.
- Kent County’s annual economic activity is listed at $5.2 billion.
- The study reports $1.3 billion in catalytic household income.
- The airport’s community report also describes GRR as contributing more than $7.7 billion annually and supporting more than 40,000 jobs.
Note: The economic-impact study measures both direct airport activity and broader catalytic effects tied to airport service.

