

 Popular Countries
 24/7 Support

Updated
Minneapolis-Saint Paul International Airport (MSP) is Delta Air Lines’ Upper Midwest hub.1 It sits about 12 miles from downtown Minneapolis and 8 miles from downtown Saint Paul2.
How many passengers pass through Minneapolis-Saint Paul International Airport each year?
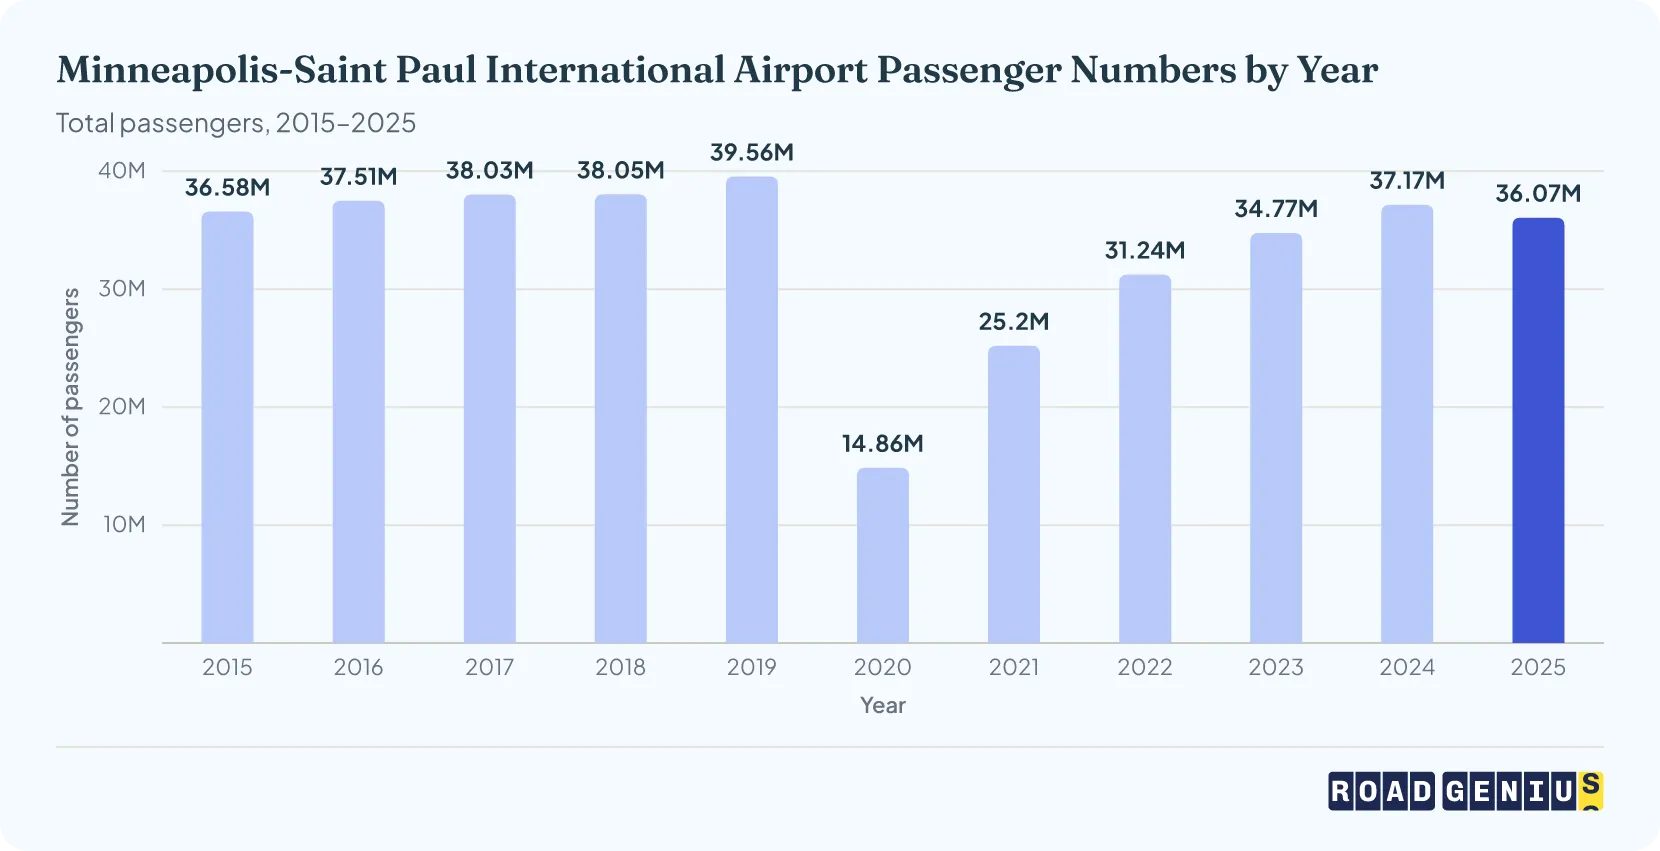
More than 36 million passengers passed through Minneapolis-Saint Paul International Airport (MSP) in 2025.3
- MSP handled 36.07 million passengers in 2025, down about 3% from 20243 and 91% of pre-pandemic 2019 levels.4
- In 2024, MSP handled 37.17 million passengers, up about 7% from 20235 and 94% of pre-pandemic 2019 levels.4
- Traffic reached 34.77 million in 20235, up from 31.24 million in 2022 and 25.20 million in 2021.6
- Before the pandemic, 39.56 million passengers traveled through MSP in 2019; in 2020 the total fell to 14.86 million.4
How many passengers has MSP handled in 2026?
Minneapolis-Saint Paul International Airport handled 27.09 million passengers from January through September 2026, 1.97% fewer than in the same months of 2025.7
How many passengers arrive and depart at Minneapolis-Saint Paul International Airport?
The 36.07 million passengers at Minneapolis-Saint Paul International Airport (MSP) in 2025 split almost evenly between departures and arrivals.16
- In 2025, 18.01 million enplaned passengers (50%) departed from MSP and 18.06 million deplaned passengers (50%) arrived.16
How big is MSP, and how many gates does it have?
MSP covers about 2,930 acres17 in Hennepin County, Minnesota.
How many flights does Minneapolis-Saint Paul International Airport handle each year?
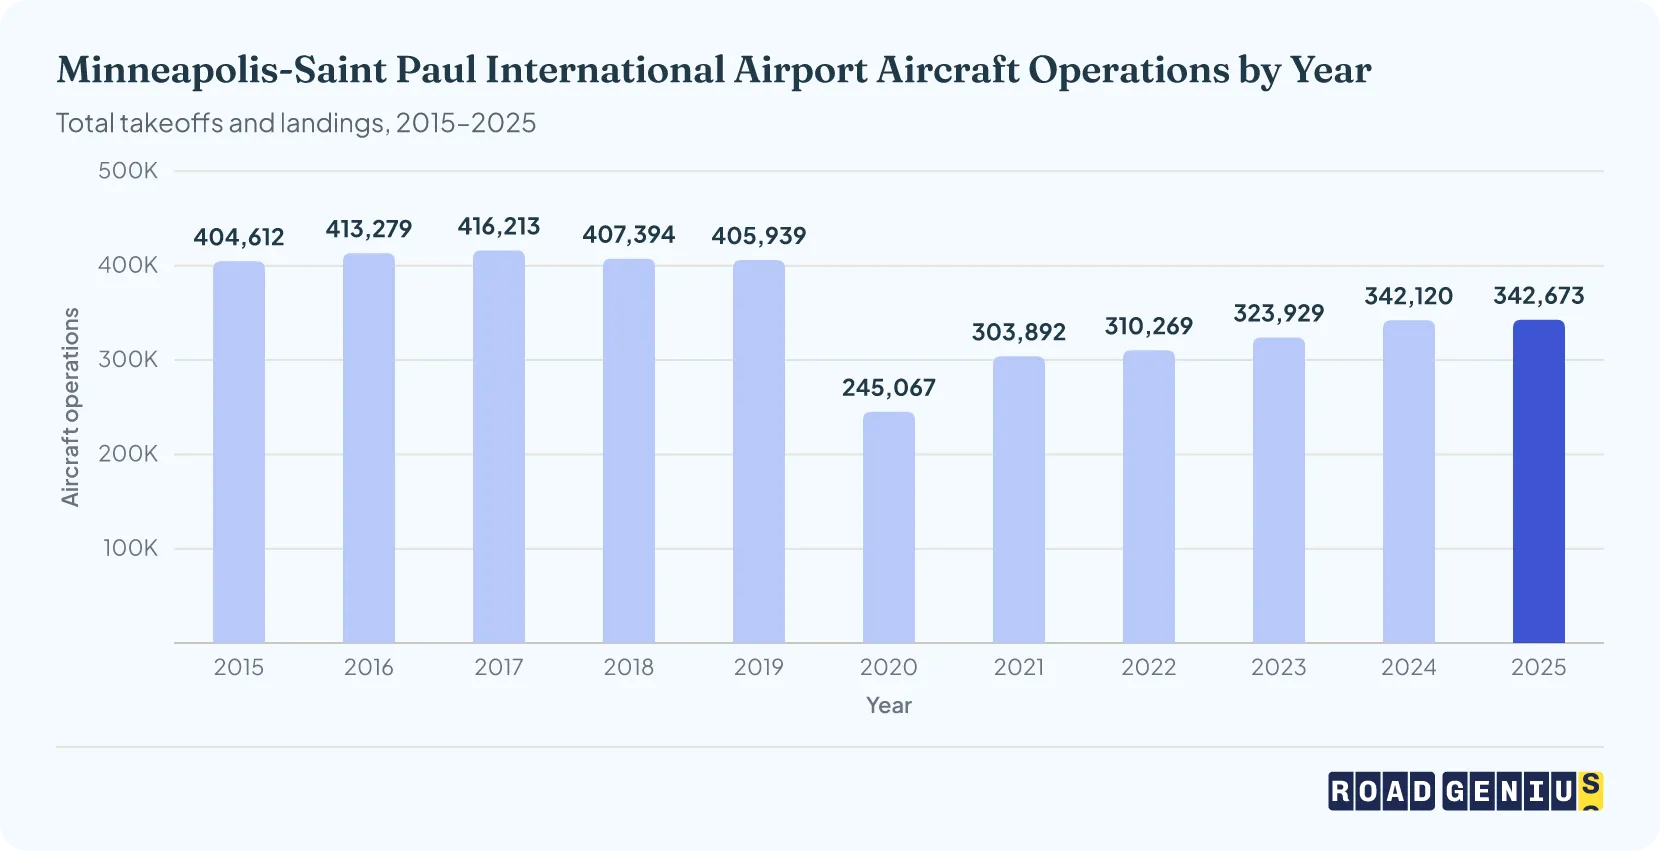
Minneapolis-Saint Paul International Airport (MSP) handled more than 342,000 aircraft operations (takeoffs and landings) in 2025.3 That works out to about 940 takeoffs and landings a day, or roughly 470 departures.16
- MSP handled 342,673 aircraft operations in 2025, up 0.2% from 20243 and 84% of 2019 pre-pandemic levels.4
- In 2024, MSP handled 342,120 aircraft operations, up 6% from 20235 and at 84% of 2019 pre-pandemic levels.4
- Operations climbed steadily in the years before: 323,929 in 20235, 310,269 in 2022 and 303,892 in 2021.6
- MSP recorded 405,939 operations in 2019; the pandemic cut that to 245,067 in 2020, a 40% drop.4
Aircraft Operations by Type
| Minneapolis-Saint Paul International Airport Aircraft Operations by Type | |||||||
|---|---|---|---|---|---|---|---|
| Operations Type | 2019 | 2020 | 2021 | 2022 | 2023 | 2024 | 2025 |
| Major | 230,0964 | 118,7954 | 150,9696 | 180,7396 | 216,8095 | 230,1035 | 216,89316 |
| Regional | 141,9764 | 99,3704 | 119,5946 | 95,2486 | 74,5525 | 79,8175 | 93,90116 |
| Charter | 664 | 264 | 386 | 606 | 595 | 265 | 1416 |
| Air Freight | 14,4554 | 15,0614 | 16,7206 | 15,7766 | 13,9885 | 13,3495 | 12,63016 |
| General Aviation | 18,4614 | 10,6414 | 15,3876 | 17,5436 | 17,7725 | 17,8555 | 18,26916 |
| Military | 8854 | 1,1744 | 1,1846 | 9036 | 7495 | 9705 | 96616 |
| Total Operations | 405,9394 | 245,0674 | 303,8926 | 310,2696 | 323,9295 | 342,1205 | 342,67316 |
How much revenue does Minneapolis-Saint Paul International Airport generate each year?
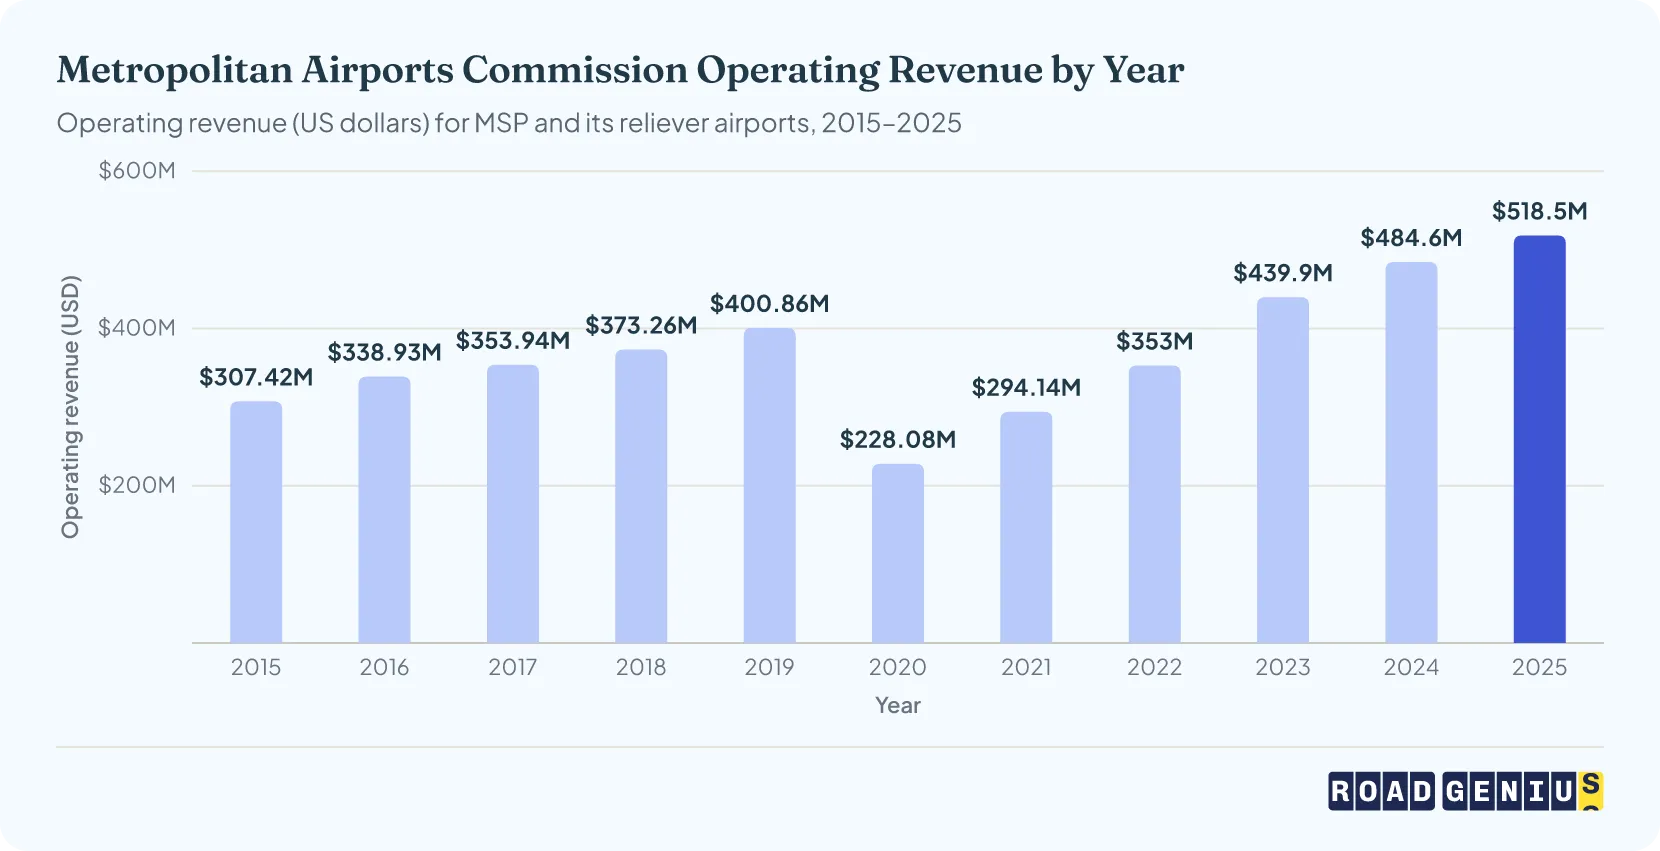
The Metropolitan Airports Commission (MAC), which runs Minneapolis-Saint Paul International Airport (MSP), reported more than $518 million in operating revenue in 2025.19
- MAC reported $518.50 million in operating revenue in 2025, up 7% from 2024 and 29% above 2019 pre-pandemic figures.19
- Operating revenue was $484.60 million in 2024, up 10% from 2023 and 21% above 2019 pre-pandemic figures.19
- Revenue rose from $353 million in 2022 to $439.90 million in 2023.19
- Revenue stood at $400.86 million in 2019 before dropping to $228.08 million in 2020 when the pandemic hit.19
These totals include MAC's smaller reliever airports, which brought in about 2.4% of the commission's revenue in 2025.19
Which is the busiest terminal at Minneapolis-Saint Paul International Airport?
Terminal 1 was the busier of Minneapolis-Saint Paul International Airport's two terminals in 2025, with 15.01 million enplaned passengers, or 83% of all departing passengers.20
MSP Terminals by Passenger Volume (2025)
Busiest Concourses at MSP (2025)
Concourse C was the busiest concourse at MSP by enplaned (departing) passengers in 2025.20
- Concourse C (Gates 1-25): 3.58 million enplaned passengers, up 8% from 202420
- Concourse F (Gates 1-16): 3.55 million enplaned passengers, down 5% from 202420
- Concourse G (Gates 1-22): 3.41 million enplaned passengers, down 14% from 202420
- Concourse E (Gates 1-16): 2.03 million enplaned passengers, down 6% from 202420
- Concourse D (Gates 1-6): 1.01 million enplaned passengers, down 10% from 202420
- Concourse A: 978,271 enplaned passengers, up 48% from 202420
- Concourse B: 453,557 enplaned passengers, up 95% from 202420
Which airlines serve the most passengers at Minneapolis-Saint Paul International Airport?
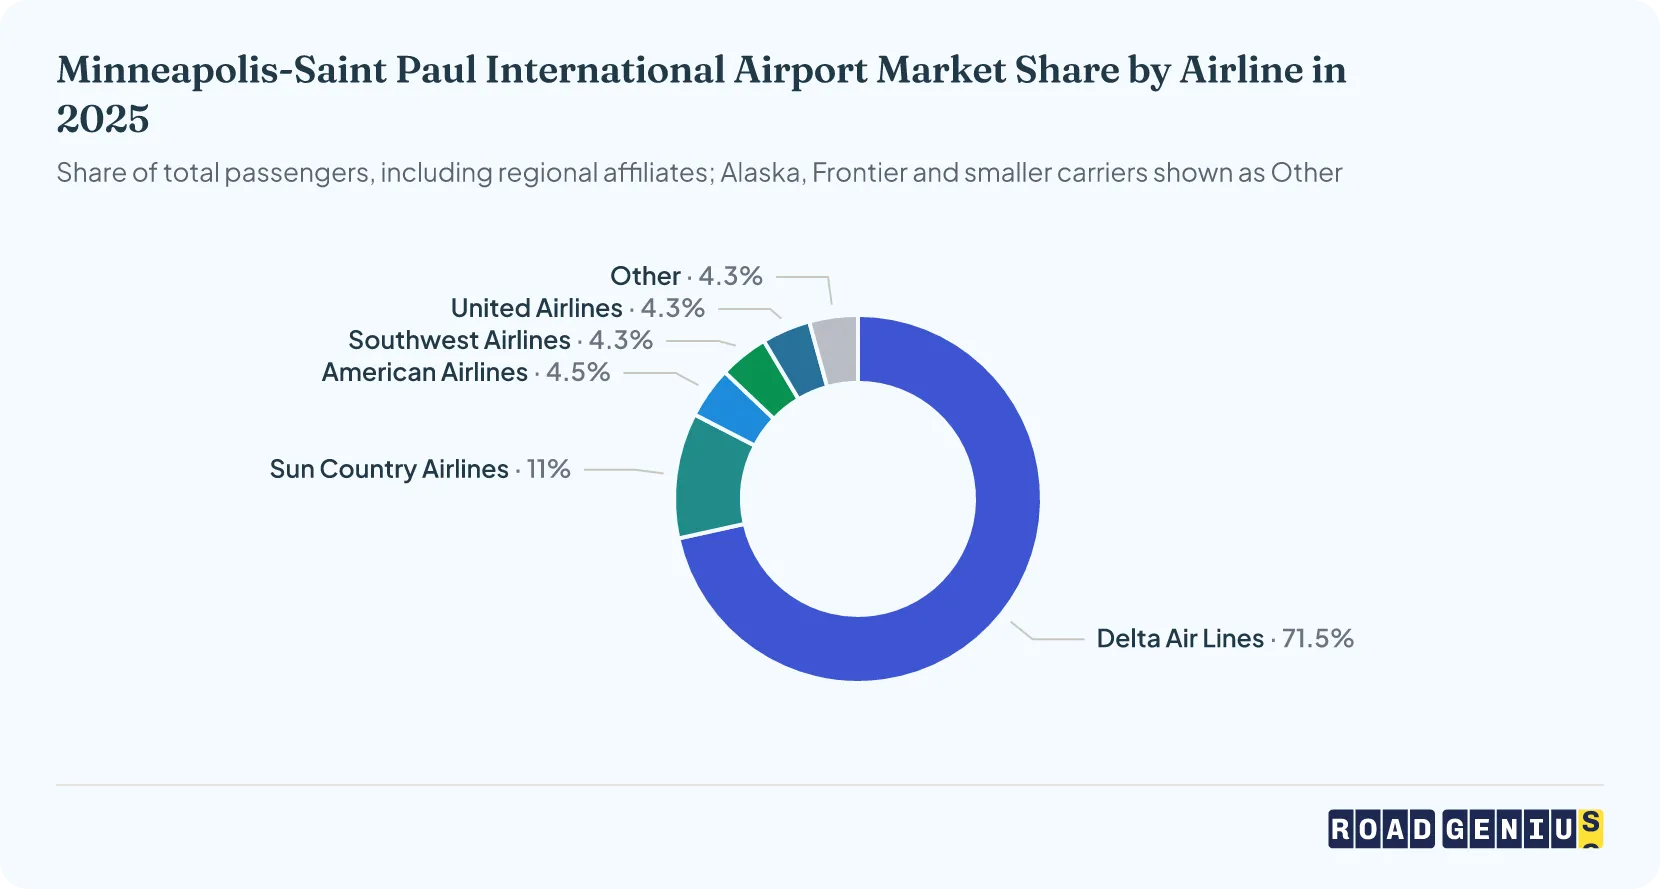
Delta Air Lines carried the most passengers at Minneapolis-Saint Paul International Airport (MSP) in 2025, with a 71.55% market share.3
Market Share by Airline at MSP Airport (2025)
- Delta Air Lines: 71.55% (25.81 million passengers)16
- Sun Country Airlines: 11.04% (3.98 million passengers)16
- American Airlines: 4.52% (1.63 million passengers)16
- Southwest Airlines: 4.34% (1.56 million passengers)16
- United Airlines: 4.28% (1.55 million passengers)16
- Alaska Airlines: 0.99% (0.36 million passengers)16
- Frontier Airlines: 0.92% (0.33 million passengers)16
- Other carriers: 2.36% (0.85 million passengers)16
Is MSP a Delta hub, and how many passengers connect there?
About 32% of passengers boarding at Minneapolis-Saint Paul International Airport (MSP) in 2025 were connecting between flights: 5.54 million, against 11.92 million who started their trip at MSP.16
What are the busiest routes at Minneapolis-Saint Paul International Airport?
Denver (DEN) was the busiest domestic route from Minneapolis-Saint Paul International Airport (MSP) in the 12 months to August 2026, with 856,130 passengers.21
Top Domestic Routes by Passengers (September 2025 to August 2026)
- MSP - Denver (DEN): 856,130 passengers21
- MSP - Chicago O'Hare (ORD): 621,730 passengers21
- MSP - Phoenix (PHX): 587,180 passengers21
- MSP - Atlanta (ATL): 575,920 passengers21
- MSP - Orlando (MCO): 504,220 passengers21
- MSP - Seattle (SEA): 492,520 passengers21
- MSP - Las Vegas (LAS): 461,330 passengers21
- MSP - Dallas/Fort Worth (DFW): 452,880 passengers21
- MSP - Los Angeles (LAX): 442,240 passengers21
- MSP - Boston (BOS): 340,930 passengers21
What is the busiest month at Minneapolis-Saint Paul International Airport?
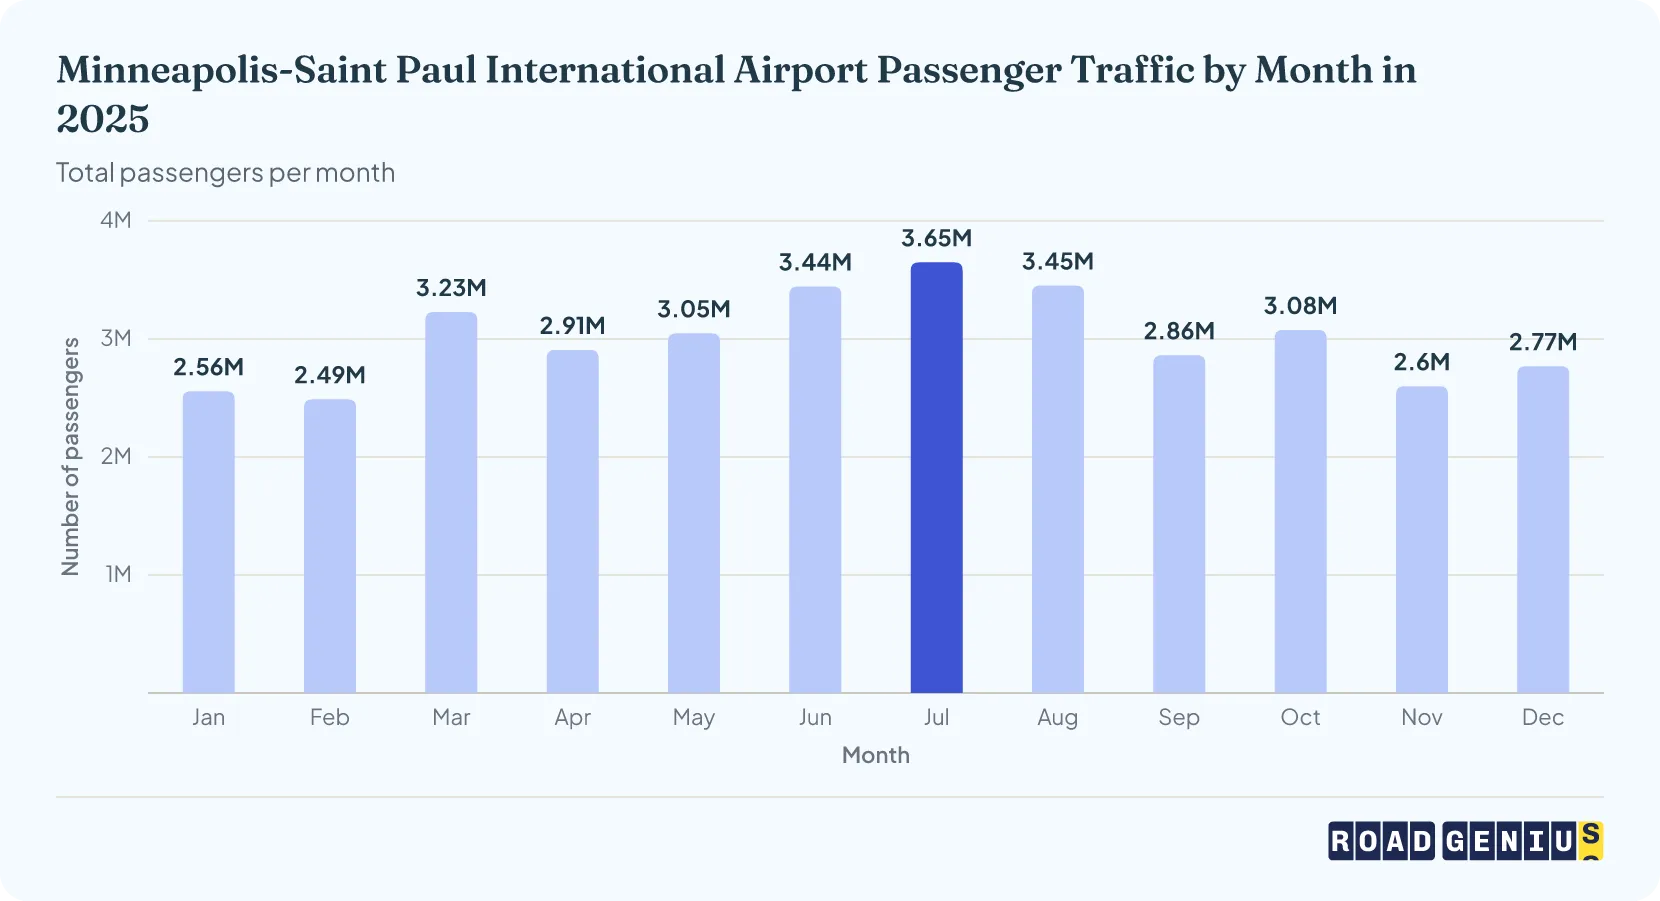
July was the busiest month at Minneapolis-Saint Paul International Airport (MSP) in 2025, with 3.65 million passengers.22
How much cargo moves through MSP Airport each year?
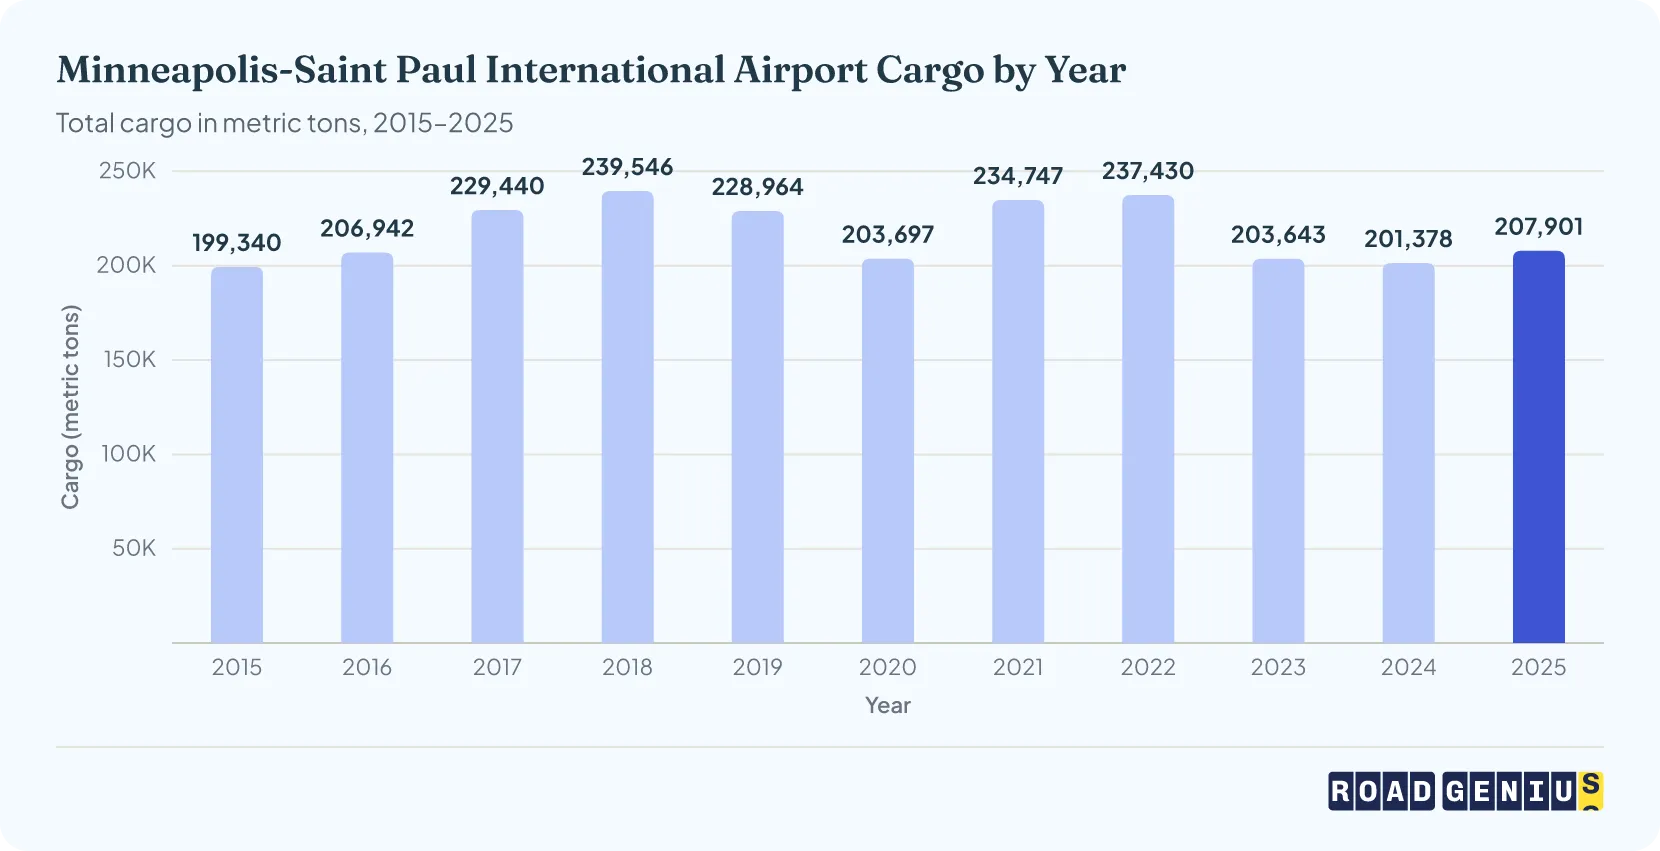
Minneapolis-Saint Paul International Airport (MSP) handled over 207,000 metric tons of cargo in 2025.16
- Cargo totaled 207,901 metric tons in 2025, up 3.2% from a revised 201,378 metric tons in 202416 but 9% below 2019 levels.4
- The first reported total for 2024 was 200,719 metric tons, down 1.4% year over year5 and 12% below 2019 levels.4
- Volumes fell to 203,643 metric tons in 20235, from 237,430 metric tons in 2022 and 234,747 metric tons in 2021.6
- The airport processed 228,964 metric tons in 2019, which decreased to 203,697 metric tons in 2020 when the pandemic began.4
How reliable is Minneapolis-Saint Paul International Airport?
In 2025, 80% of domestic flights at Minneapolis-Saint Paul International Airport (MSP) departed on time and 80% arrived on time.21
- Flight cancellations (2025): 0.82% of domestic flights21
Is Minneapolis-Saint Paul International Airport one of the busiest in the US?
Minneapolis-Saint Paul International Airport (MSP) was the 17th busiest airport in the United States by passenger boardings in 2025, with 17.49 million boardings.27
Minneapolis-Saint Paul International Airport's Economic Impact
Minneapolis-Saint Paul International Airport (MSP) supports $21.3 billion in annual economic output and 93,350 jobs29, including 49,250 jobs directly connected to the airport, 18,830 indirect jobs and 25,260 induced jobs, according to a 2026 study of 2024 activity. The study rounds its figures, so the three job types add up to slightly less than the total.
Rent a car in Minneapolis–Saint Paul and Minnesota
More Airport Statistics
- Bangor International Airport (BGR) Statistics
- Cincinnati Airport (CVG) Statistics
- Houston Hobby Airport Statistics
- Huntsville Airport (HSV) Statistics
- Jacksonville International Airport Statistics
- Norfolk International Airport (ORF) Statistics
- Peoria Airport (PIA) Statistics
- Phoenix Sky Harbor Airport Statistics
- Pittsburgh Airport (PIT) Statistics
- Punta Gorda Airport (PGD) Statistics
- Wichita Airport (ICT) Statistics
- Wilmington International Airport Statistics
References
- About MSP — Minneapolis-St. Paul International Airport · mspairport.com ↑ b c d e
- Taxi Service — Minneapolis-St. Paul International Airport · mspairport.com ↑
- MSP Airport tops 36 million passengers in 2025 (Jan 29, 2026) — Metropolitan Airports Commission · metroairports.org ↑ b c d e f
- MSP 2020 Year End Operations Report (passengers, operations, cargo) — Metropolitan Airports Commission · metroairports.org ↑ b c d e f g h i j k l m n o p q r s t u v w
- MSP 2024 Year End Operations Report (passengers, operations, cargo) — Metropolitan Airports Commission · metroairports.org ↑ b c d e f g h i j k l m n o p q r s t
- MSP 2022 Year End Operations Report (passengers, operations, cargo) — Metropolitan Airports Commission · metroairports.org ↑ b c d e f g h i j k l m n o p q
- MSP September 2026 Monthly Operations Report (passengers, operations, cargo) — Metropolitan Airports Commission · metroairports.org ↑ b
- MSP January 2026 Monthly Operations Report (passengers, operations, cargo) — Metropolitan Airports Commission · metroairports.org ↑
- MSP February 2026 Monthly Operations Report (passengers, operations, cargo) — Metropolitan Airports Commission · metroairports.org ↑
- MSP March 2026 Monthly Operations Report (passengers, operations, cargo) — Metropolitan Airports Commission · metroairports.org ↑
- MSP April 2026 Monthly Operations Report (passengers, operations, cargo) — Metropolitan Airports Commission · metroairports.org ↑
- MSP May 2026 Monthly Operations Report (passengers, operations, cargo) — Metropolitan Airports Commission · metroairports.org ↑
- MSP June 2026 Monthly Operations Report (passengers, operations, cargo) — Metropolitan Airports Commission · metroairports.org ↑
- MSP July 2026 Monthly Operations Report (passengers, operations, cargo) — Metropolitan Airports Commission · metroairports.org ↑
- MSP August 2026 Monthly Operations Report (passengers, operations, cargo) — Metropolitan Airports Commission · metroairports.org ↑
- MSP 2025 Year End Operations Report (passengers, operations, cargo) — Metropolitan Airports Commission · metroairports.org ↑ b c d e f g h i j k l m n o p q r s t u v w x
- Airport Master Record (FAA Form 5010) — Minneapolis-St Paul International/Wold-Chamberlain (MSP) · Federal Aviation Administration ↑
- KMSP — Minneapolis-St Paul International/Wold-Chamberlain Airport (FAA airport information) — AirNav · airnav.com ↑ b c d
- Annual Comprehensive Financial Report, Years Ended December 31, 2025 and 2024 — Metropolitan Airports Commission · metroairports.org ↑ b c d e f
- MSP 2025 Enplanements by Concourse — Metropolitan Airports Commission · metroairports.org ↑ b c d e f g h i j k
- Minneapolis-St Paul International (MSP) airport statistics — BTS TranStats · transtats.bts.gov ↑ b c d e f g h i j k l m
- MSP July 2025 Monthly Operations Report (passengers, operations, cargo) — Metropolitan Airports Commission · metroairports.org ↑ b
- MSP August 2025 Monthly Operations Report (passengers, operations, cargo) — Metropolitan Airports Commission · metroairports.org ↑
- MSP June 2025 Monthly Operations Report (passengers, operations, cargo) — Metropolitan Airports Commission · metroairports.org ↑
- MSP March 2025 Monthly Operations Report (passengers, operations, cargo) — Metropolitan Airports Commission · metroairports.org ↑
- MSP October 2025 Monthly Operations Report (passengers, operations, cargo) — Metropolitan Airports Commission · metroairports.org ↑
- FAA — Final CY2025 Enplanements at Commercial Service Airports · faa.gov ↑
- FAA — Qualifying Cargo Airports, Rank Order and Percent Change from 2024 (CY2025) · faa.gov ↑
- MSP Airport's economic impact grows to $21.3 billion annually (Feb 5, 2026) — Metropolitan Airports Commission · metroairports.org ↑
- MSP Official Statistics and Press Releases — Metropolitan Airports Commission · metroairports.org
- Bureau of Transportation Statistics — LAS Performance Data and Route Information · bts.gov
