

 Popular Countries
 24/7 Support

Updated
Logan International Airport (BOS), in East Boston, Massachusetts, is New England’s main gateway for air travel and a hub for JetBlue Airways and Delta Air Lines, with flights to six continents.
How many passengers pass through Logan International Airport each year?
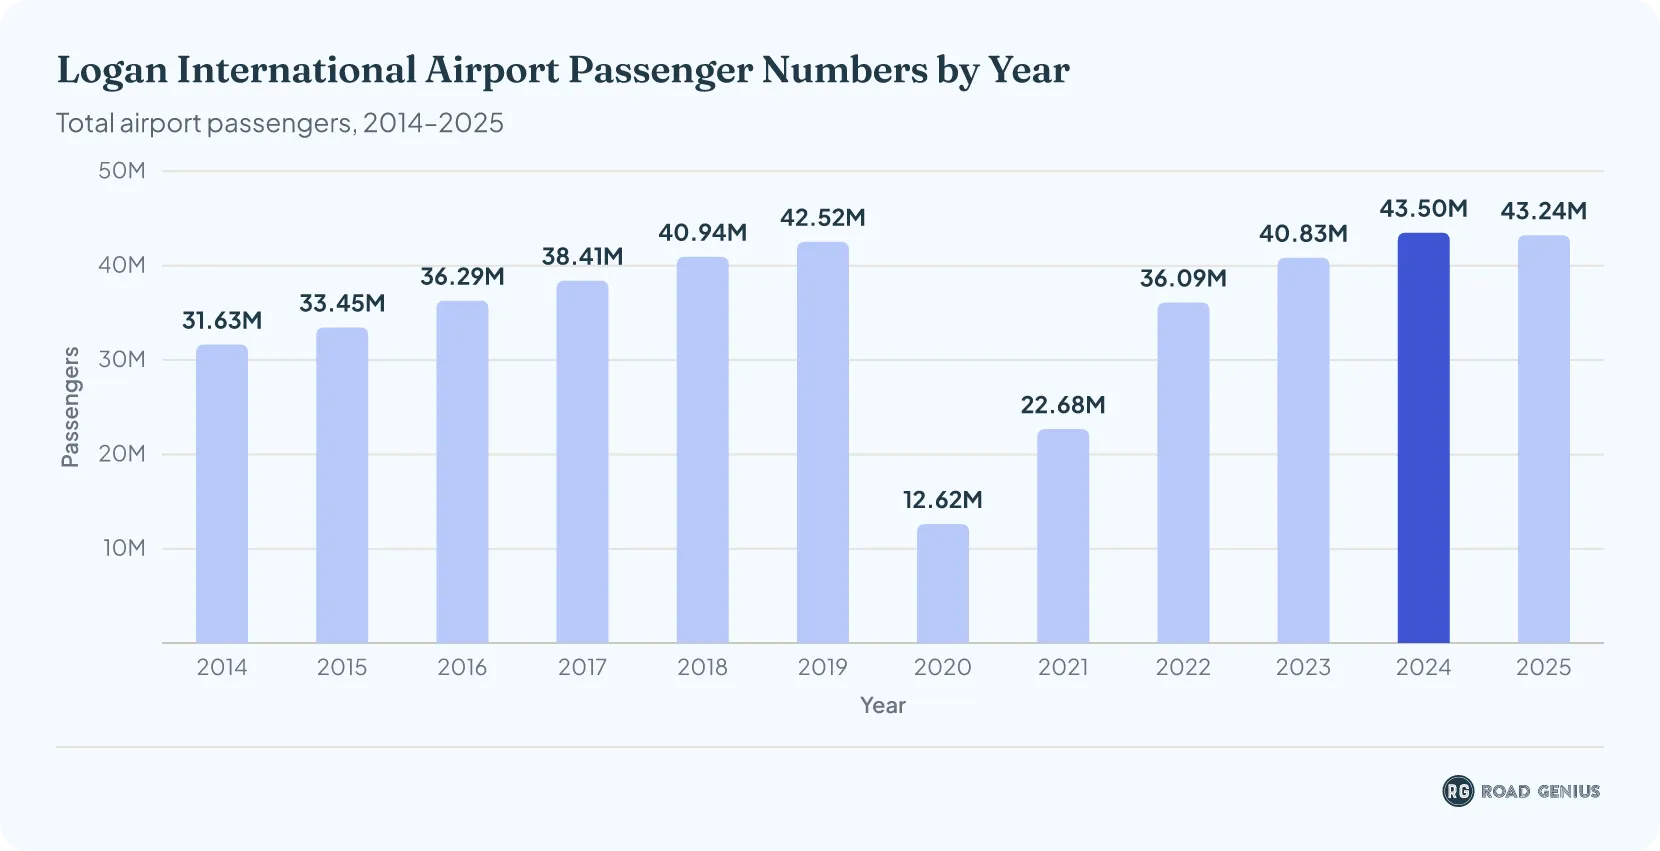
More than 43 million passengers a year now pass through Logan International Airport (BOS).1
- In 2025, Logan handled 43.24 million passengers, down 0.6% from 20242 and about 1.7% above pre-pandemic 2019 levels.
- In 2024, the airport handled 43.50 million passengers, up about 6.5% from 20231 and 2% above pre-pandemic 2019 levels.3
- Annual passenger traffic reached 40.83 million in 2023.1 That was up from 36.09 million in 2022 and 22.68 million in 2021.4
- Before the pandemic, 42.52 million passengers traveled through Logan in 2019.3 In 2020, traffic fell to just 12.62 million passengers.
Logan International Airport 2026 Statistics (January–July)
Logan International Airport handled 24.13 million passengers from January to July 2026, down 1.4% from 24.48 million in the same months of 2025.5
- 18.87 million were domestic passengers and 5.27 million international.5
- Flights (arrivals and departures) totaled 218,837, down 1.5% from January–July 2025.5
- July was the busiest month so far, with 4.05 million passengers.5
These figures come from U.S. Bureau of Transportation Statistics (BTS) airline data, which counts passengers slightly differently from the Massport totals used elsewhere on this page. July 2026 is the latest month available.
Monthly Passenger Traffic at Logan International Airport in 2026 (January–July)
| Month | Total Passengers | Domestic | International | Flights |
|---|---|---|---|---|
| Jan | 2,675,3665 | 2,068,256 | 607,110 | 25,616 |
| Feb | 2,618,5985 | 2,097,261 | 521,337 | 24,897 |
| Mar | 3,456,1675 | 2,783,565 | 672,602 | 31,210 |
| Apr | 3,671,3415 | 2,883,087 | 788,254 | 33,133 |
| May | 3,821,3735 | 2,960,803 | 860,570 | 34,193 |
| Jun | 3,842,7745 | 2,963,399 | 879,375 | 34,404 |
| Jul | 4,047,7485 | 3,110,340 | 937,408 | 35,384 |
| Jan–Jul total | 24,133,3675 | 18,866,711 | 5,266,656 | 218,837 |
Source · U.S. Bureau of Transportation Statistics (BTS) airline data, as compiled by AirportData. Flights include arrivals and departures. Latest available: July 2026.
How many passengers passed through Logan International Airport in 2025?
Logan handled 43.24 million passengers in 2025.2 Domestic travelers made up 33.14 million of them, international travelers 10.03 million and general aviation 69,986.
How many passengers passed through Logan International Airport in 2024?
Logan served 43.50 million passengers in 2024.1 Of these, 33.74 million were domestic, 9.66 million international and 105,034 general aviation passengers.
How many passengers passed through Logan International Airport in 2023?
The airport handled 40.83 million passengers in 2023.1 The split was 32.32 million domestic, 8.41 million international and 107,184 general aviation passengers.
How large is Logan International Airport?
Logan International Airport covers about 2,384 acres in East Boston.6
- Runways: 6 supporting all-weather operations
- Terminals: 4 (A, B, C and E) with 94 gates
- Parking: 26,088 spaces
How many passengers arrived at and departed from Logan International Airport in 2025?
Logan handled about 21.66 million arriving and 21.57 million departing passengers in 2025.2
How many aircraft operations does Logan International Airport handle each year?
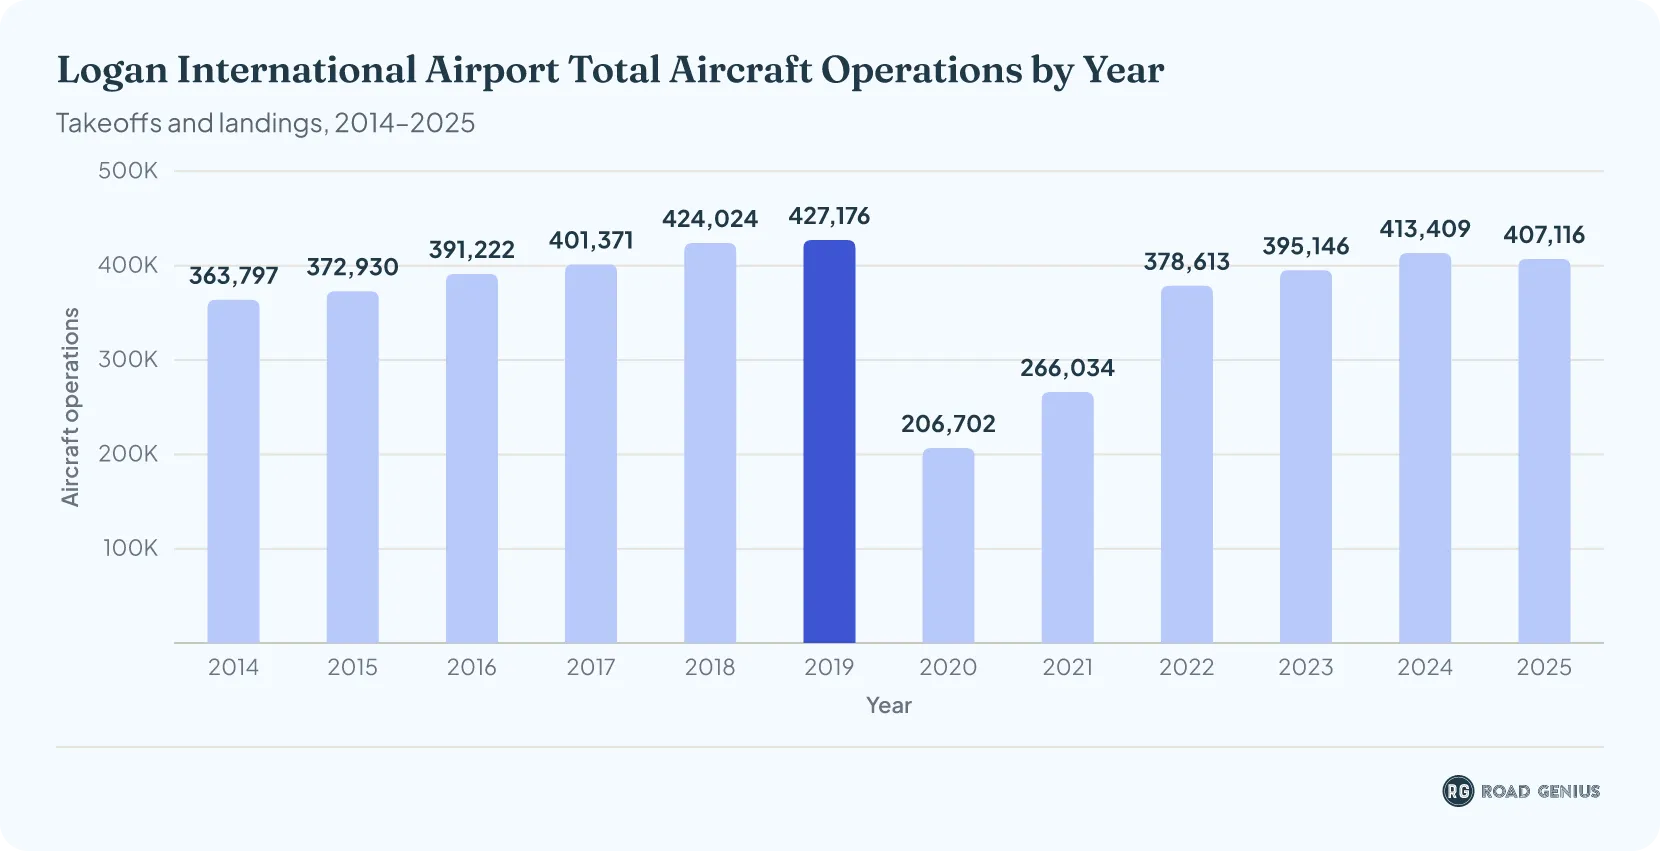
Logan International Airport (BOS) handles more than 400,000 aircraft operations (takeoffs and landings) a year.1
- In 2025, Logan handled 407,116 operations, down 1.5% from 20242 and about 95% of the pre-pandemic 2019 level.
- In 2024, the airport recorded 413,409 operations, up about 4.6% from 20231 and 97% of the pre-pandemic 2019 level.3
- Operations reached 395,146 in 20231, up from 378,613 in 2022 and 266,034 in 2021.4
- Logan handled 427,176 operations in 2019, before the pandemic cut the total to 206,702 in 2020.3
Aircraft Operations by Type
| Aircraft Operations at Logan International Airport by Type | |||||||
|---|---|---|---|---|---|---|---|
| Operation Type | 2019 | 2020 | 2021 | 2022 | 2023 | 2024 | 2025 |
| Domestic flights | 343,778 | 173,999 | 219,328 | 304,924 | 315,405 | 326,542 | 326,3342 |
| International flights | 54,476 | 18,845 | 22,664 | 43,185 | 50,855 | 58,731 | 61,4642 |
| General aviation | 28,922 | 13,858 | 24,042 | 30,504 | 28,886 | 28,136 | 19,3182 |
| Total Operations | 427,1763 | 206,7023 | 266,0344 | 378,6134 | 395,1461 | 413,4091 | 407,1162 |
Source · Massport, Boston-Logan Monthly Airport Traffic Summary (December reports, year-to-date totals). Operations count arrivals and departures.
How much revenue does Massport, which runs Logan International Airport, earn each year?
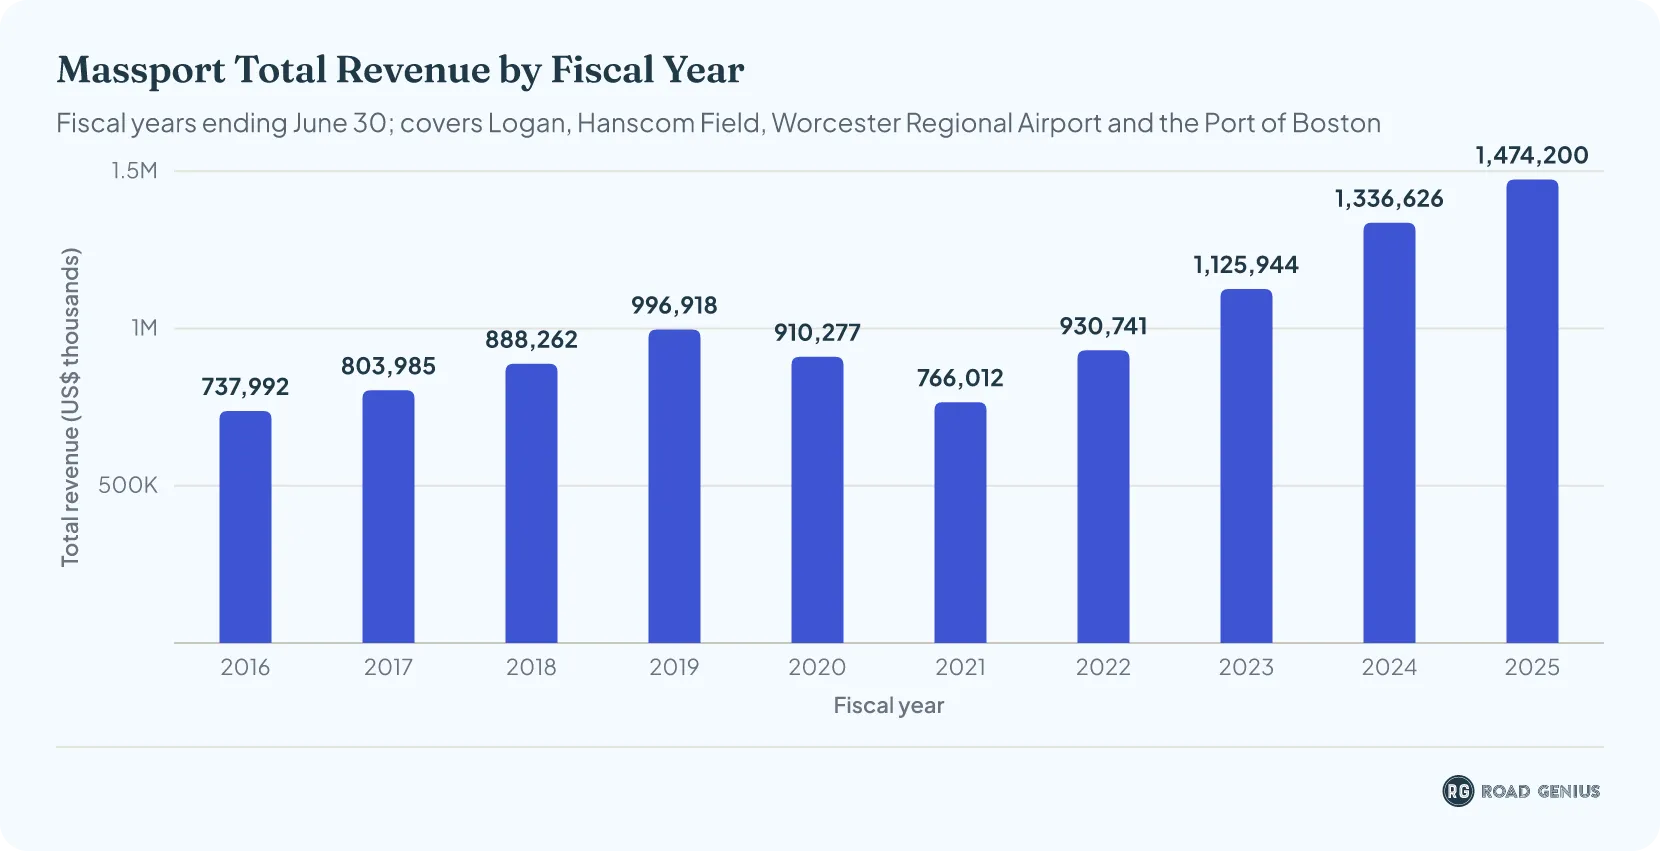
Massport, the authority that runs Logan International Airport (BOS), generated $1.47 billion in revenue in fiscal year 2025 (the year to June 30, 2025), the first time it passed $1.4 billion. The total covers Logan, Hanscom Field, Worcester Regional Airport and the Port of Boston.7
- That was up about 10.3% from $1.34 billion in fiscal year 2024 and 48% above pre-pandemic levels.7
- Revenue reached $1.13 billion in fiscal year 2023, up from $931 million in fiscal year 2022 and well above the pandemic low of $766 million in fiscal year 2021.7
- Revenue was $997 million in fiscal year 2019 and fell to $910 million in fiscal year 2020 as the pandemic began.7
Massport Revenue in Fiscal Year 2025
Massport earned about $1.47 billion in fiscal year 2025.7 Operating revenue made up $1.23 billion (84%) and non-operating revenue $240 million (16%).
Massport Revenue in Fiscal Year 2024
Massport earned about $1.34 billion in fiscal year 2024.7 Operating revenue accounted for $1.15 billion (86%) of that and non-operating revenue $189 million (14%).
Which is the busiest terminal at Logan International Airport?
Terminal B was the busiest at Logan International Airport (BOS) in 2025, handling 14.12 million passengers, or 33% of the airport's terminal traffic.8
Logan International Airport Terminals by Passenger Volume (2025)
- Terminal B: 14,117,846 passengers (33%), down 5.2% from 20248
- Terminal C: 11,240,117 passengers (26%), up 2.0%8
- Terminal A: 9,685,513 passengers (22%), up 2.2%8
- Terminal E (international): 8,116,897 passengers (19%), up 1.5%8
The four terminal totals add up to 43.16 million, slightly below Massport's airport-wide total of 43.24 million for 2025.
Car Rental in Boston
- Car Rental Boston
- Car Rental Boston Logan Airport (BOS)
- Car Rental Martha's Vineyard
- Car Rental Massachusetts
- Car Rental Nantucket
- Car Rental Portland, Maine
- Car Rental Providence
- Car Rental Salem, MA
- Car Rental Boston to Montreal (One-Way)
- Car Rental Boston to New York (One-Way)
- Car Rental Boston to Toronto (One-Way)
Top International Routes by Passengers
London Heathrow was Logan's busiest international route in 2025, with 1,083,728 passengers, up 3% from 1,050,439 in 2024.9
- BOS – London Heathrow (LHR): 1,083,728 passengers (2025)9
- BOS – Paris Charles de Gaulle (CDG): 530,823 passengers (2024)10
- BOS – Dublin (DUB): 489,166 passengers (2024)11
- BOS – Amsterdam (AMS): 420,380 passengers (2024)12
- BOS – Reykjavik (KEF): 354,144 passengers (2024)13
The Paris, Dublin, Amsterdam and Reykjavik figures are for 2024, the latest year Eurostat has published.
Which airlines carry the most passengers at Logan International Airport?
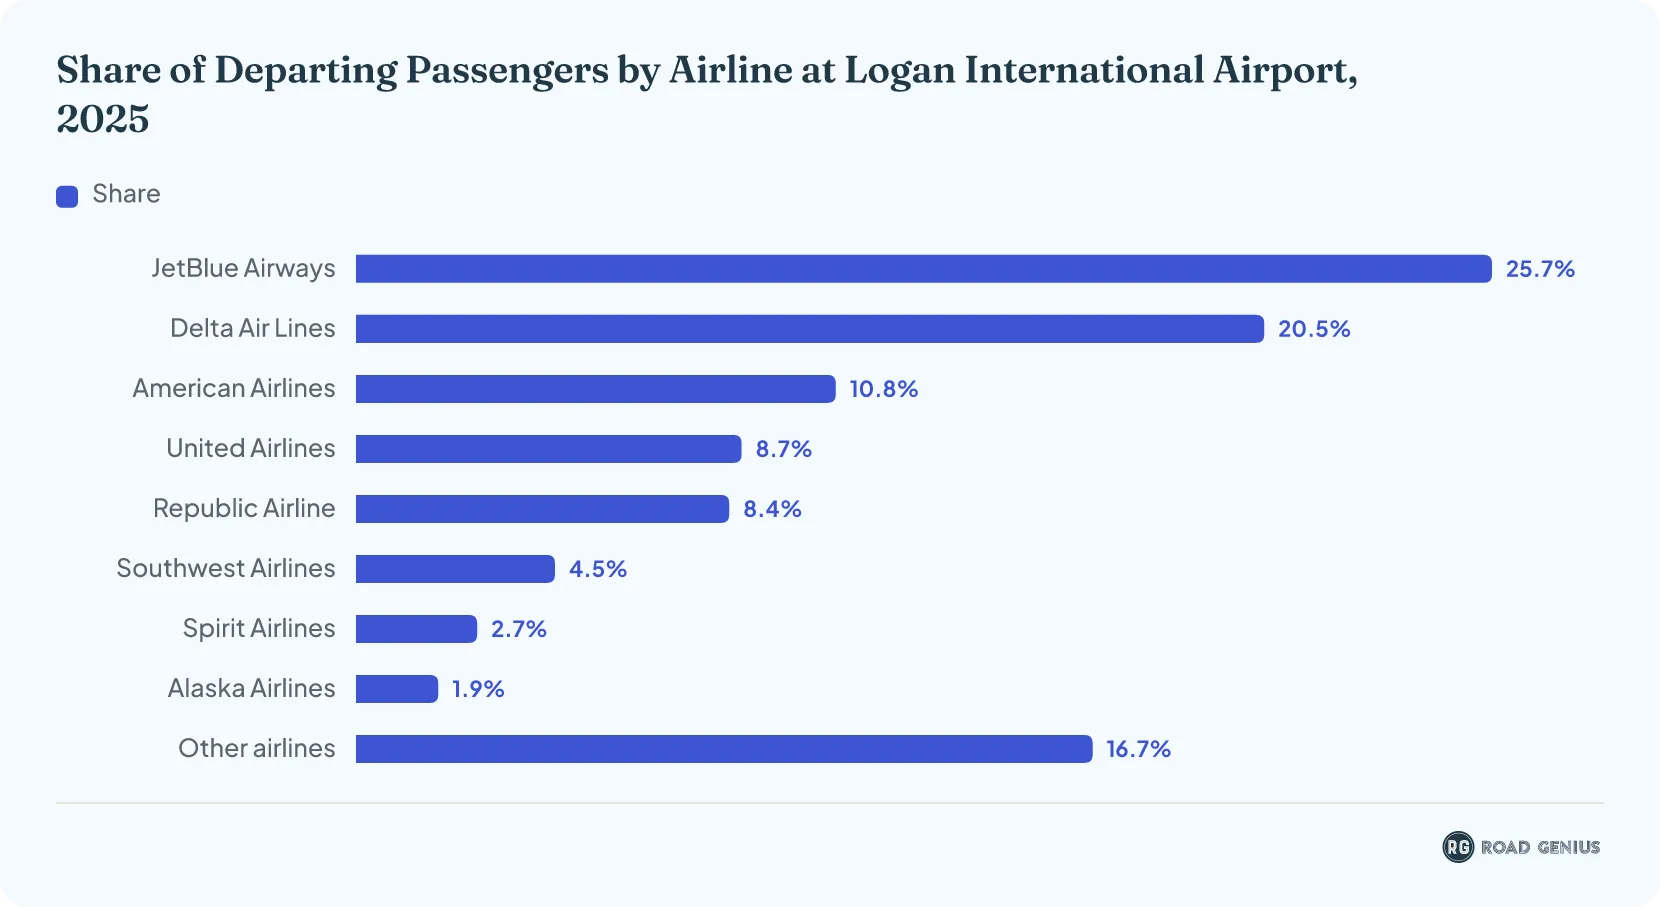
JetBlue Airways was the largest airline at Logan International Airport (BOS) in 2025, carrying 25.69% of departing passengers.14
Market Share by Airline at BOS (2025)
- JetBlue Airways: 25.69% (5.41 million departing passengers)
- Delta Air Lines: 20.54% (4.32 million)
- American Airlines: 10.85% (2.28 million)
- United Airlines: 8.72% (1.83 million)
- Republic Airline: 8.44% (1.78 million)
- Southwest Airlines: 4.50% (0.95 million)
- Spirit Airlines: 2.74% (0.58 million)
- Alaska Airlines: 1.86% (0.39 million)
- Other airlines: 16.66% (3.51 million)14
Shares are of the 21.04 million passengers who departed Boston in 202514, based on BTS T-100 data by operating airline. That is why regional carriers such as Republic, which flies for American, Delta and United, are listed separately.
What are the busiest routes at Logan International Airport?
Chicago O’Hare was the busiest domestic route from Boston in 2025, followed by Atlanta and Orlando.
Top Domestic Routes by Passengers (2025)
- BOS – Chicago O’Hare (ORD): 891,980 passengers
- BOS – Atlanta (ATL): 771,300 passengers
- BOS – Orlando (MCO): 688,610 passengers
- BOS – Washington National (DCA): 683,150 passengers
- BOS – San Francisco (SFO): 676,180 passengers
- BOS – Denver (DEN): 624,330 passengers
- BOS – Los Angeles (LAX): 607,680 passengers
- BOS – Dallas/Fort Worth (DFW): 547,680 passengers
- BOS – Miami (MIA): 535,330 passengers
- BOS – Fort Lauderdale (FLL): 488,620 passengers
Figures are BTS counts of passengers flying from Boston on each route, January–December 2025.15
Which months are busiest at Logan International Airport?
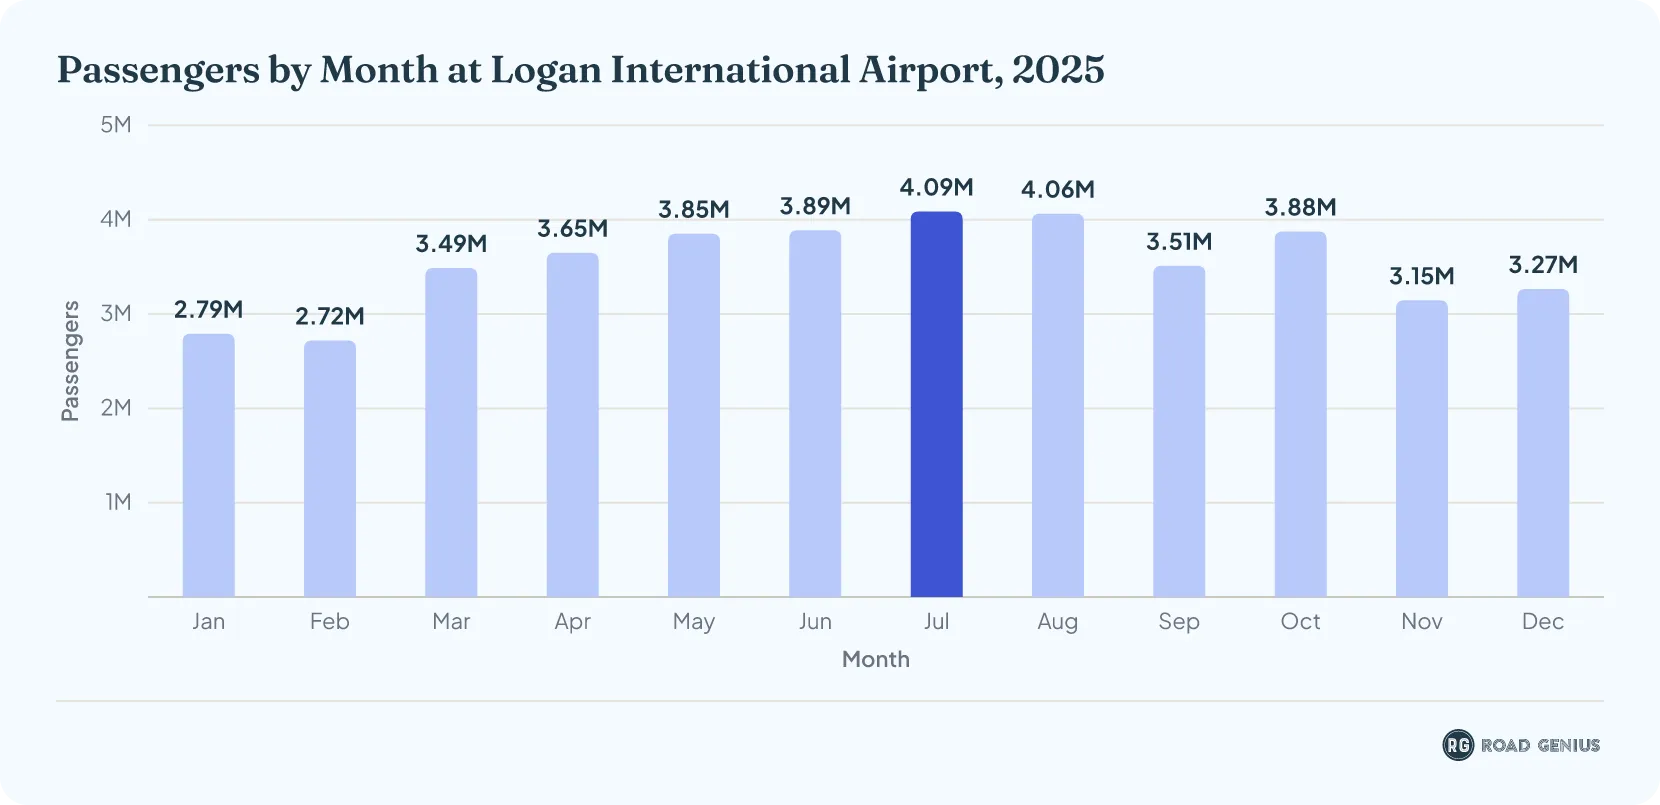
July was the peak month at Logan International Airport (BOS) in 2025, with about 4.09 million passengers.5
- August came next with 4.06 million, followed by June (3.89 million), October (3.88 million) and May (3.85 million).5
- February was the quietest month of 2025, with 2.72 million passengers.5
As with the 2026 figures above, these monthly numbers are BTS airline data, which count slightly differently from Massport’s annual totals.
How much cargo moves through Logan International Airport each year?
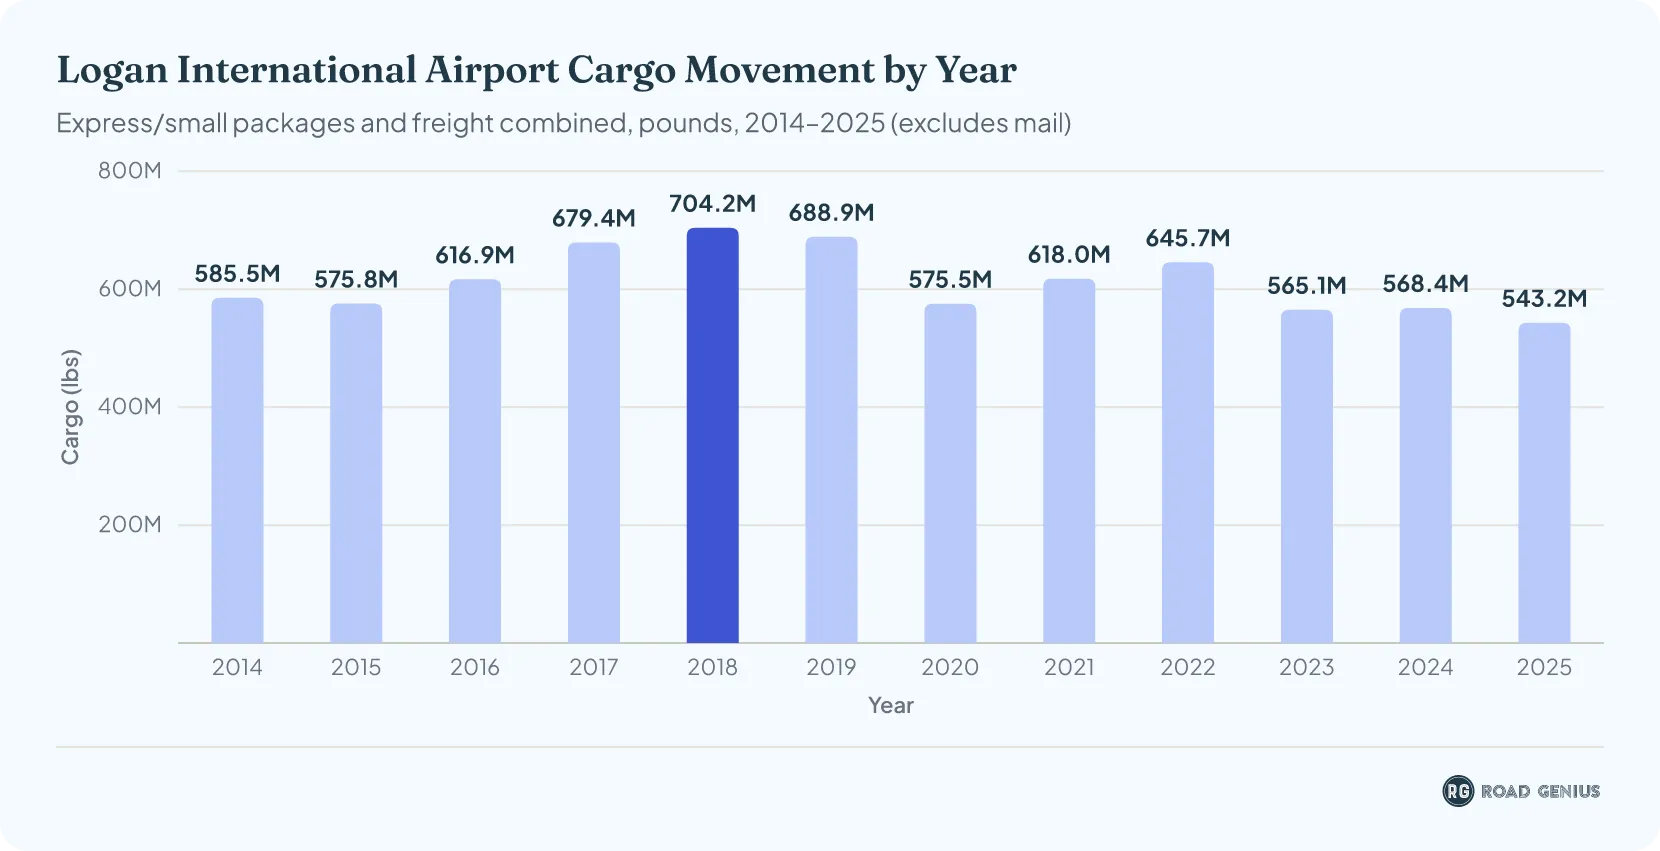
Logan International Airport (BOS) has handled more than 540 million pounds of cargo a year since 2023, counting express packages and freight together (mail excluded).1
- In 2025, Logan processed 543.17 million pounds of cargo, down 4.4% from 2024: 276.57 million pounds of freight (up 0.6%) and 266.60 million pounds of express and small packages (down 9.2%).2
- In 2024, the airport processed 568.39 million pounds of cargo, up 0.6% from 20231 but 12.0% lower than 2022 levels.4
- Cargo volumes reached 565.12 million pounds in 20231, down from 645.69 million pounds in 2022.4
- BOS handled 688.94 million pounds in 20193, which dropped to 575.47 million pounds in 2020 during the pandemic.
How reliable is Logan International Airport?
In 2025, 73% of domestic flights at Logan International Airport (BOS) arrived on time and 76% departed on time, down from 76% and 78% in 2024.16
- Cancellations: 1.68% of flights in 2025 (1.45% in 2024)16
- Average delay: 75.87 minutes for delayed departures and 75.49 minutes for delayed arrivals in 202516
These are BTS figures for domestic flights by reporting airlines. A flight counts as delayed when it is 15 minutes or more late.
How does Logan International Airport rank in the U.S. and worldwide?
Logan was the 16th busiest airport in the United States by passenger boardings in 2025 and the 53rd busiest in the world by passenger traffic in 2024.
- U.S. ranking: 16th busiest in 2025 (21.02 million boardings)17, behind ATL, DFW, ORD, DEN, LAX, JFK, MCO, LAS, MIA, SFO, CLT, SEA, PHX, EWR and IAH
- Cargo: 33rd among U.S. all-cargo airports by landed weight in 202518
- Transatlantic: a major gateway between the U.S. and Europe
The global ranking is for 2024, the latest available: Airports Council International (ACI) has so far published only its 2025 top 20, which does not include Boston.
Logan International Airport's Economic Impact
In 2024, the latest year with published figures, Logan International Airport (BOS) generated nearly $20 billion in economic benefits and provided almost 20,000 jobs for area residents.19
Related Statistics
- Boston Tourism Statistics
- Burlington International Airport (BTV) Statistics
- Massachusetts Tourism Statistics
- Tweed–New Haven Airport (HVN) Statistics
- Portland International Jetport (PWM) Statistics
- T.F. Green International Airport (PVD) Statistics
- Worcester Regional Airport (ORH) Statistics
- John F. Kennedy International Airport (JFK) Statistics
- LaGuardia Airport (LGA) Statistics
- Newark Liberty International Airport (EWR) Statistics
- Chicago O'Hare International Airport (ORD) Statistics
- Hartsfield-Jackson Atlanta International Airport (ATL) Statistics
References
- Boston-Logan International Airport Monthly Airport Traffic Summary — December 2024 · massport.com ↑ b c d e f g h i j k l m
- Boston-Logan International Airport Monthly Airport Traffic Summary — December 2025 · massport.com ↑ b c d e f g h i j k
- Multiple Airport Statistics: Different Airports from multiple countries — BOS#how-many-passengers-use-logan-international-f30ff0 · massport.com ↑ b c d e f g
- Boston-Logan International Airport Monthly Airport Traffic Summary — December 2022 · massport.com ↑ b c d e f
- Boston Logan International Airport (BOS) — monthly traffic statistics (US BTS data) · airportdata.net ↑ b c d e f g h i j k l m n o
- FAA Airport Master Record (Form 5010) — General Edward Lawrence Logan Intl (BOS) · Federal Aviation Administration ↑
- Massport — Annual Comprehensive Financial Report, Fiscal Year Ended June 30, 2025 · massport.com ↑ b c d e f
- Massport — Attachment A-3, Historical Passenger Information: Boston Logan passengers by terminal, CY2020–CY2025 · bqohpheioaljycjpwbjd.supabase.co ↑ b c d e
- U.S. International Air Passenger and Freight Statistics Report, Fourth Quarter 2025 (year ended December 2025) · transportation.gov ↑ b
- Eurostat — Air passenger transport between the main airports of France and their main partner airports (avia_par_fr) · ec.europa.eu ↑
- Eurostat — Air passenger transport between the main airports of Ireland and their main partner airports (avia_par_ie) · ec.europa.eu ↑
- Eurostat — Air passenger transport between the main airports of Netherlands and their main partner airports (avia_par_nl) · ec.europa.eu ↑
- Eurostat — Air passenger transport between the main airports of Iceland and their main partner airports (avia_par_is) · ec.europa.eu ↑
- DWU Consulting — BTS T-100 Segment airport dashboard: Boston Logan (BOS), CY 2025 · dwuconsulting.com ↑ b c
- Logan International Airport — Wikipedia (June 2026 copy): Busiest domestic routes from BOS, January–December 2025 (BTS data) · wikipedia.bennettdavid.com ↑
- BTS TranStats — Airport profile: Boston, MA: Logan International (BOS), domestic on-time performance 2021–2026 · transtats.bts.gov ↑ b c
- FAA — Final CY2025 Enplanements at Commercial Service Airports · faa.gov ↑
- FAA — Qualifying Cargo Airports, Rank Order and Percent Change from 2024 (CY2025) · faa.gov ↑
- Massport — Boston Logan Breaks Passenger Record, Celebrates Year Full of Growth · massport.com ↑
- BOS Official Statistics and Press Releases · massport.com
- BTS TranStats — Airport profiles (route information by airport) · transtats.bts.gov
