

 Popular Countries
 24/7 Support
Published Sep 9, 2026
T.F. Green International Airport (PVD) is Rhode Island’s primary airport and the main air gateway for the Providence metropolitan area, connecting the state to destinations across the United States and select international locations through several partner airlines.
How many passengers pass through T.F. Green International Airport each year?
T.F. Green International Airport handles more than 4 million passengers annually.
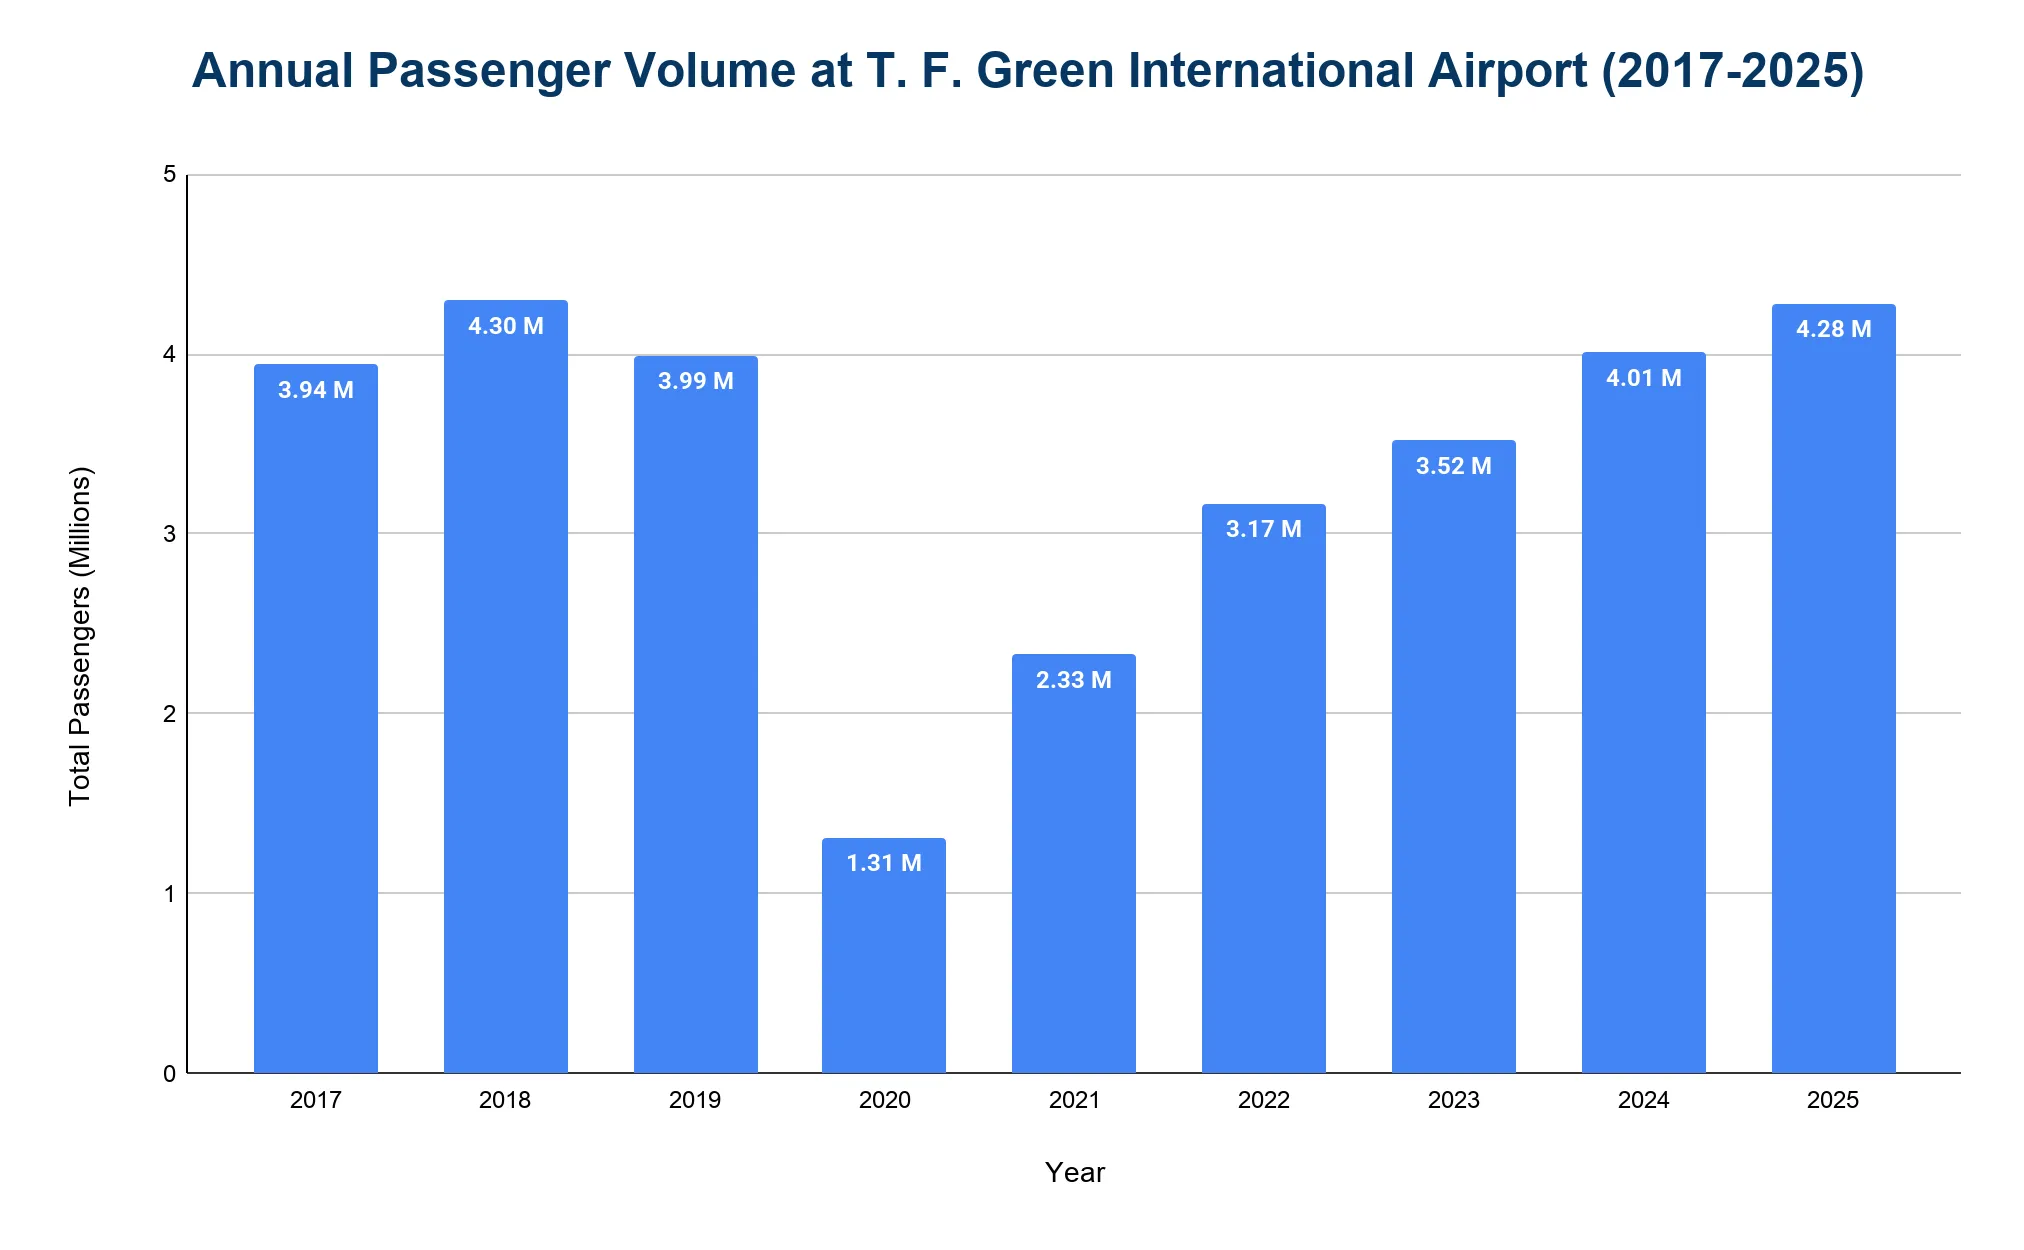
- The airport served 4.28 million passengers in 2025, a 6.7% increase from 4.01 million in 2024.
- In 2019, it handled 3.99 million passengers before the pandemic.
- Passenger traffic dropped sharply to 1.31 million in 2020 (a 67% decline) and recovered to 2.33 million in 2021.
- Recovery continued in 2022 with 3.17 million passengers, followed by 3.52 million in 2023.
What is the total number of aircraft operations at T.F. Green International Airport each year?
T.F. Green International Airport sees over 70,000 total aircraft takeoffs and landings annually, including commercial, general aviation, and military operations.
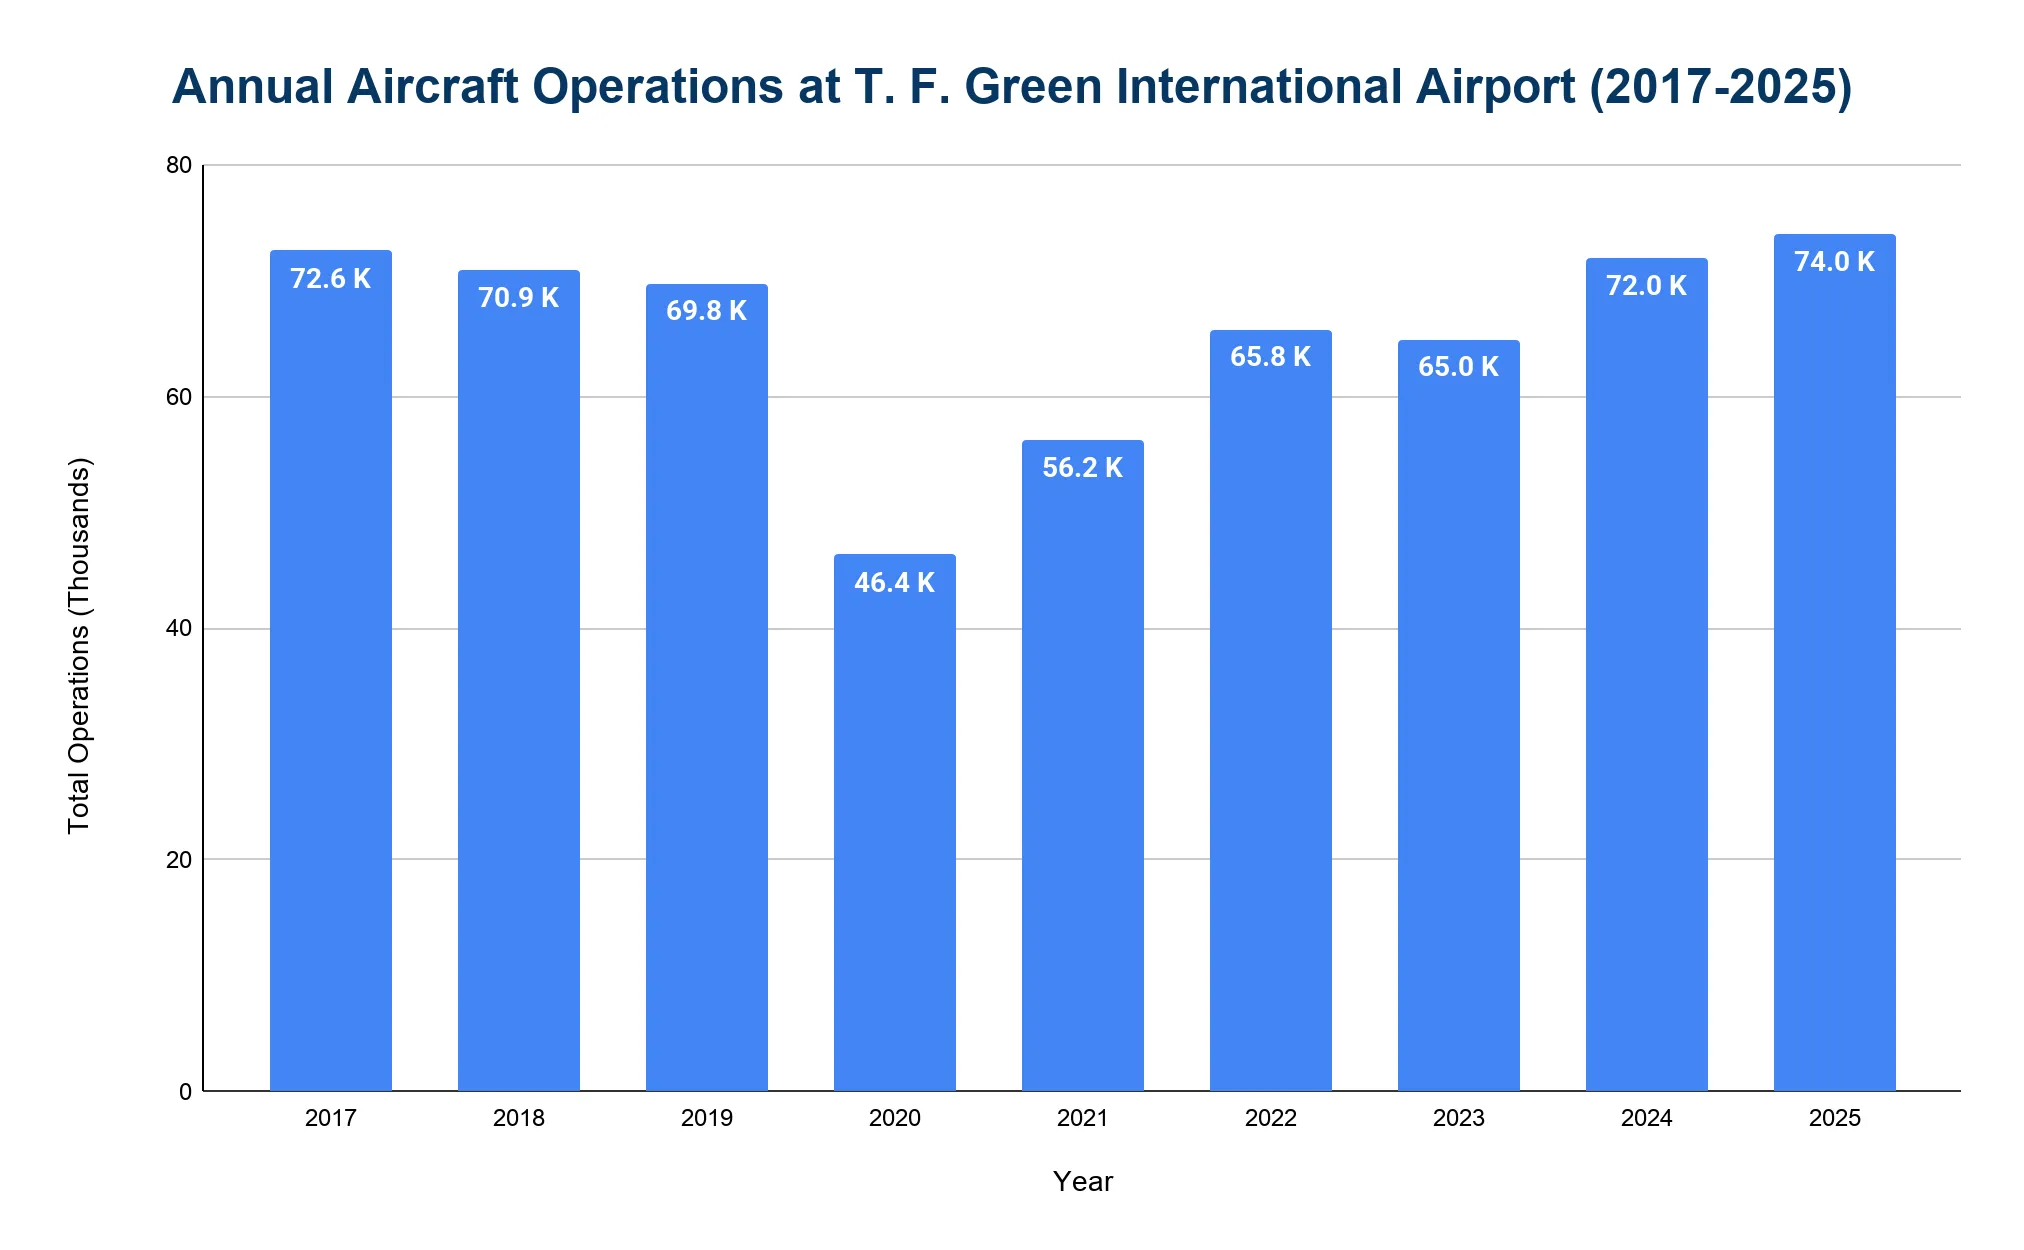
- In 2025, there were 74,045 total aircraft movements, the highest level in recent years and representing a full post-pandemic recovery.
- Before the pandemic, 2019 saw approximately 69,789 movements.
- Operations dropped to around 46,353 in 2020, the lowest during the pandemic.
- Recovery progressed steadily with 56,236 in 2021 and 65,828 in 2022.
- Total movements slightly decreased to 64,972 in 2023 before climbing to 71,992 in 2024.
Which airlines carry most passengers at T.F. Green International Airport?
Low-cost and major carriers operate at PVD, with Southwest Airlines holding the largest market share.
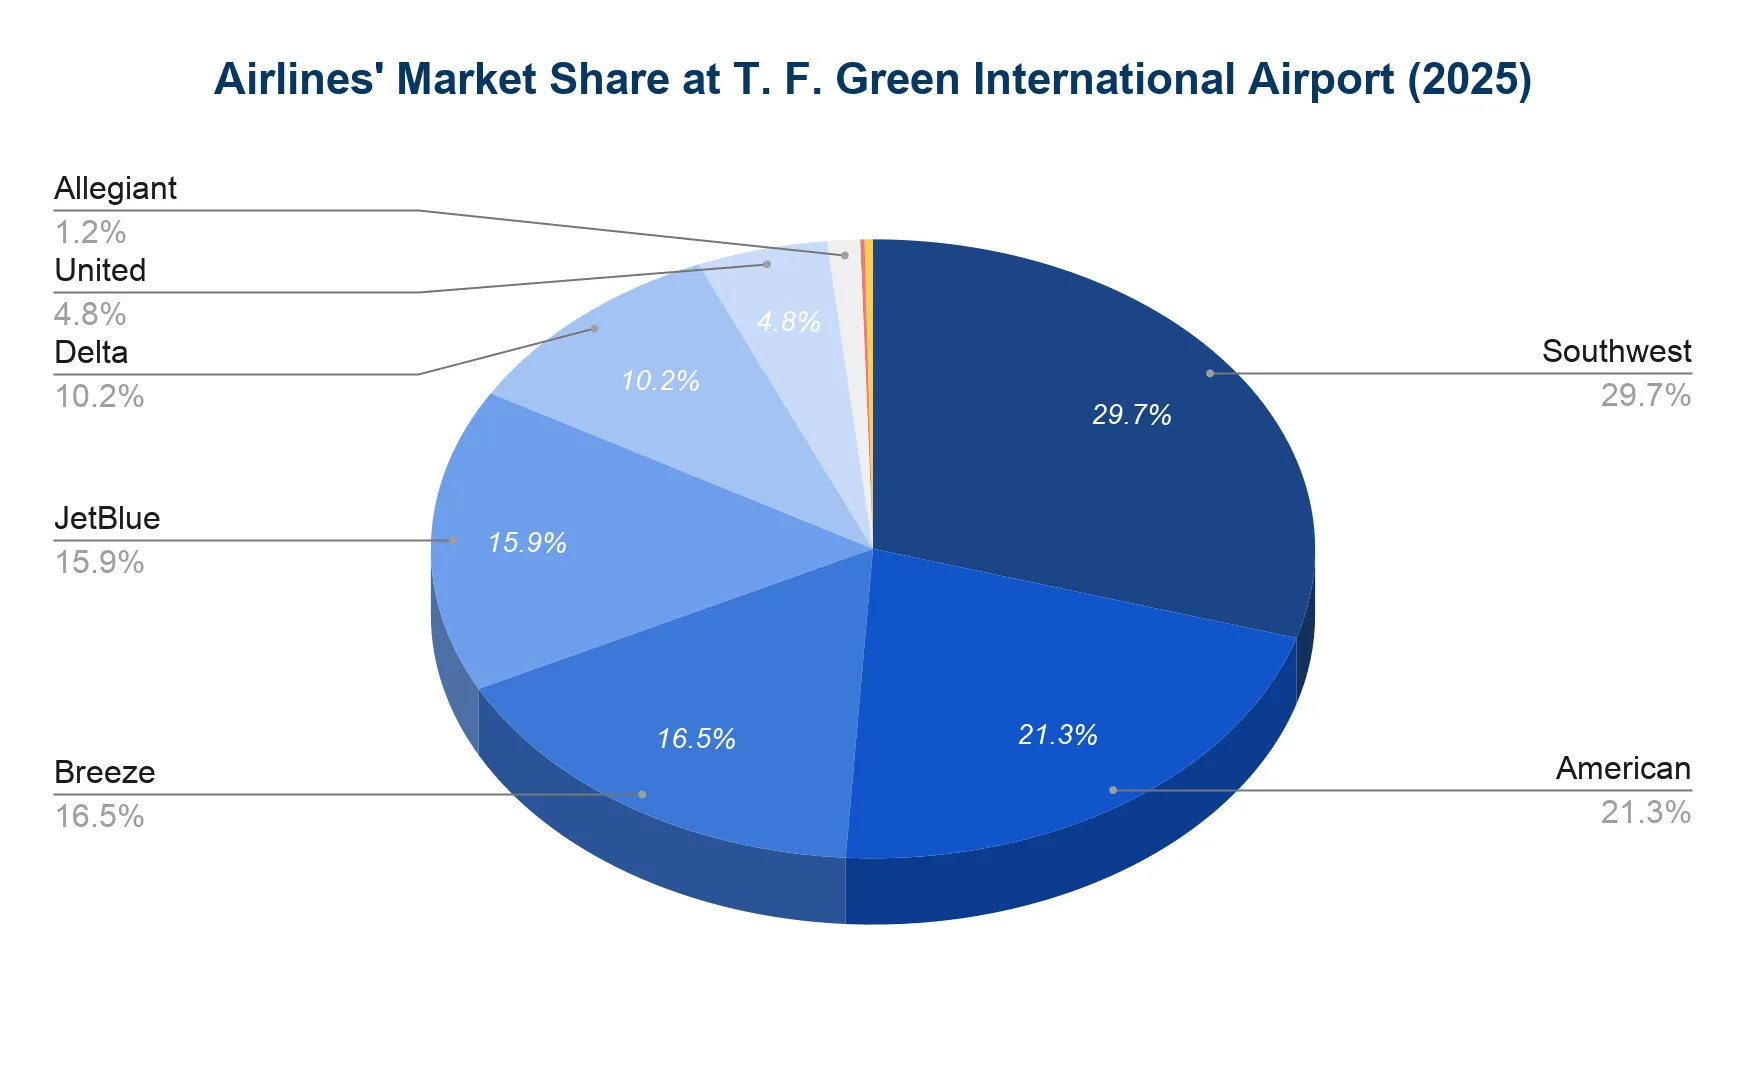
- In 2025, Southwest led with 29.7% of annual passenger volume (approximately 1.27 million passengers), making it the dominant carrier.
- American Airlines followed with 21.3% (approximately 913,351 passengers).
- Breeze Airways held 16.5% (approximately 708,171 passengers), maintaining a significant low-cost presence.
- JetBlue accounted for 15.9% (about 678,602 passengers) and Delta Air Lines made up 10.2% (approximately 435,456 passengers).
- United Airlines carried 4.8% (roughly 204,961 passengers).
- Together, these six airlines accounted for over 98% of total passenger traffic, reflecting a concentrated carrier market at PVD.
What are the monthly trends in passenger traffic at T.F. Green International Airport?
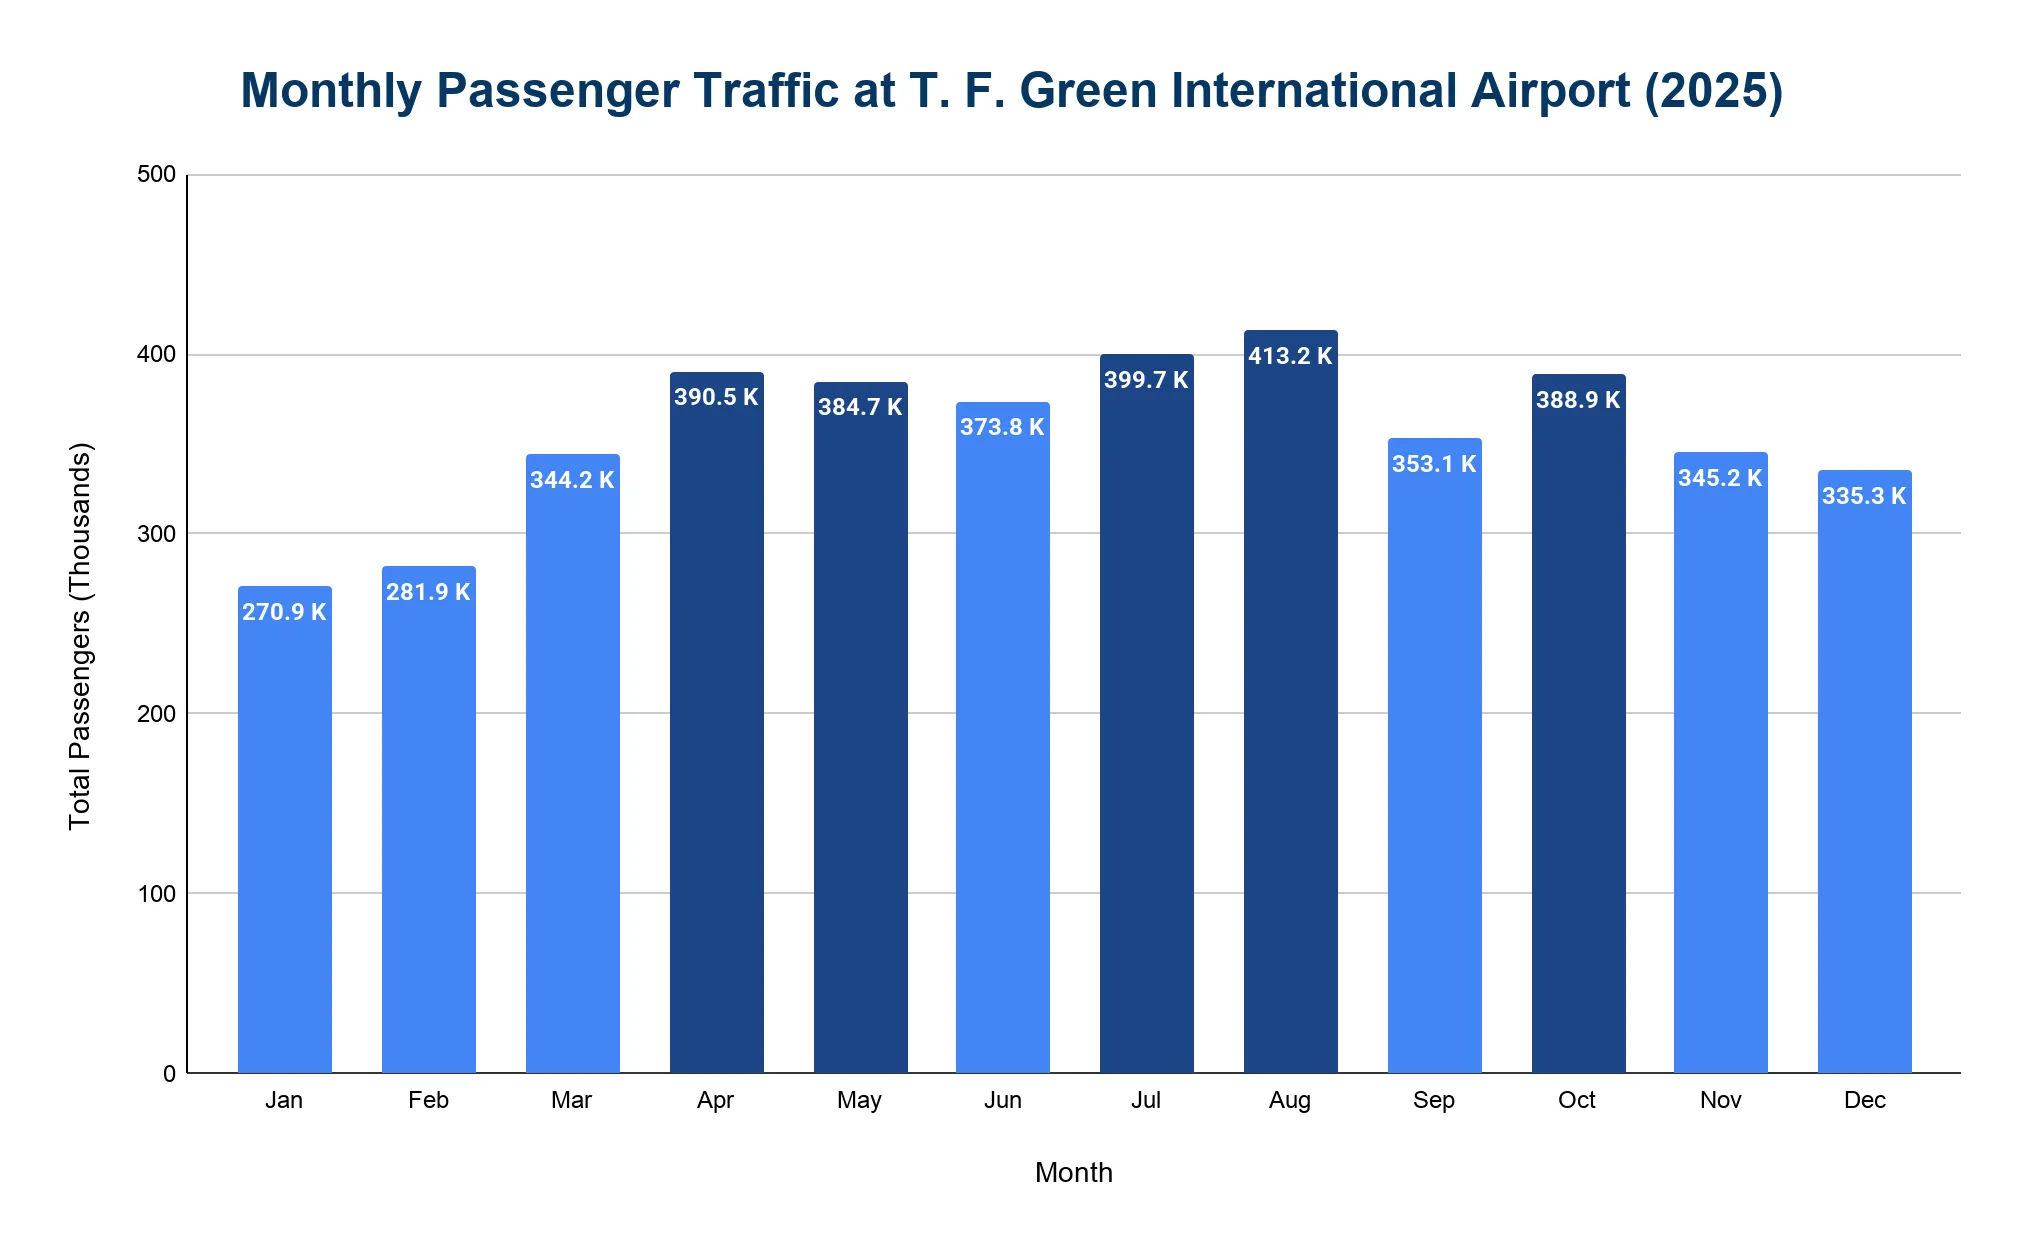
T.F. Green International Airport shows clear seasonal trends, with peak volumes during summer and major holidays.
- August was the busiest month in 2025 with 413,226 passengers.
- July followed with 399,720 and April had 390,467 passengers.
- October recorded 388,873 and May reached 384,687.
- January was the slowest month with 270,931 passengers, followed by February with 281,927, typical of winter lulls.
How many routes are there at T.F. Green International Airport?
As of 2025, Rhode Island T.F. Green International Airport (PVD) offered 38 nonstop destinations, with over 100 daily flights1.
- PVD’s route network is primarily domestic, with service to major U.S. markets including Atlanta, Baltimore, Charlotte, Chicago, Dallas, Denver, Fort Lauderdale, Fort Myers, Los Angeles, Minneapolis-St. Paul, Nashville, Orlando, Philadelphia, Tampa, Washington, D.C., and West Palm Beach.
- The airport also has a small international network. Current airport listings include Cancun, Mexico, and Cabo Verde destinations Praia and Sal.
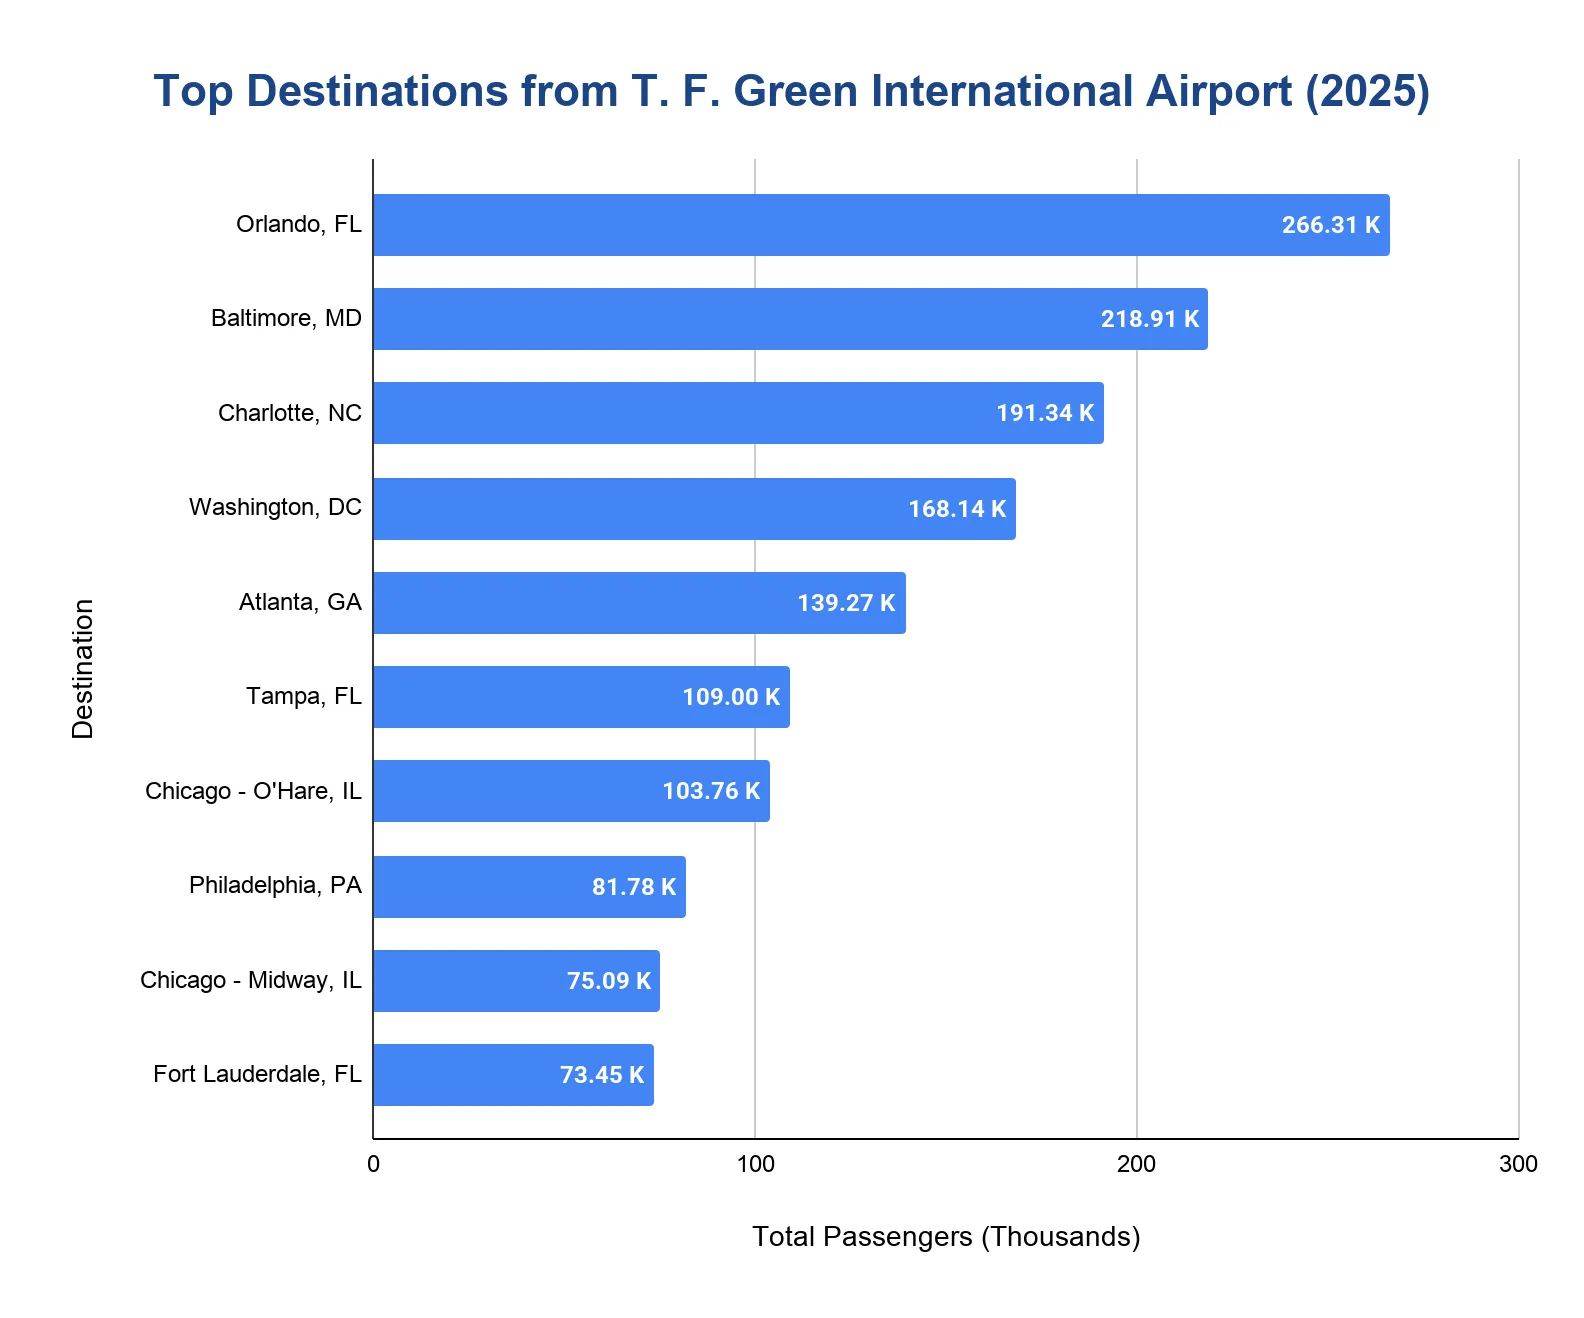
Which destinations are the most popular from T.F. Green International Airport?
- Orlando, FL (MCO) led with 266,310 passengers in 2025, making it the most traveled route.
- Baltimore, MD (BWI) followed with 218,910 passengers.
- Charlotte, NC (CLT) served 191,340 passengers, offering vital Southeast connections.
- Washington, DC (DCA/IAD) saw 168,140 passengers, supporting government and business travel.
- Atlanta, GA (ATL) handled 139,270 passengers as a key Delta hub route.
How much cargo does T.F. Green International Airport handle annually?
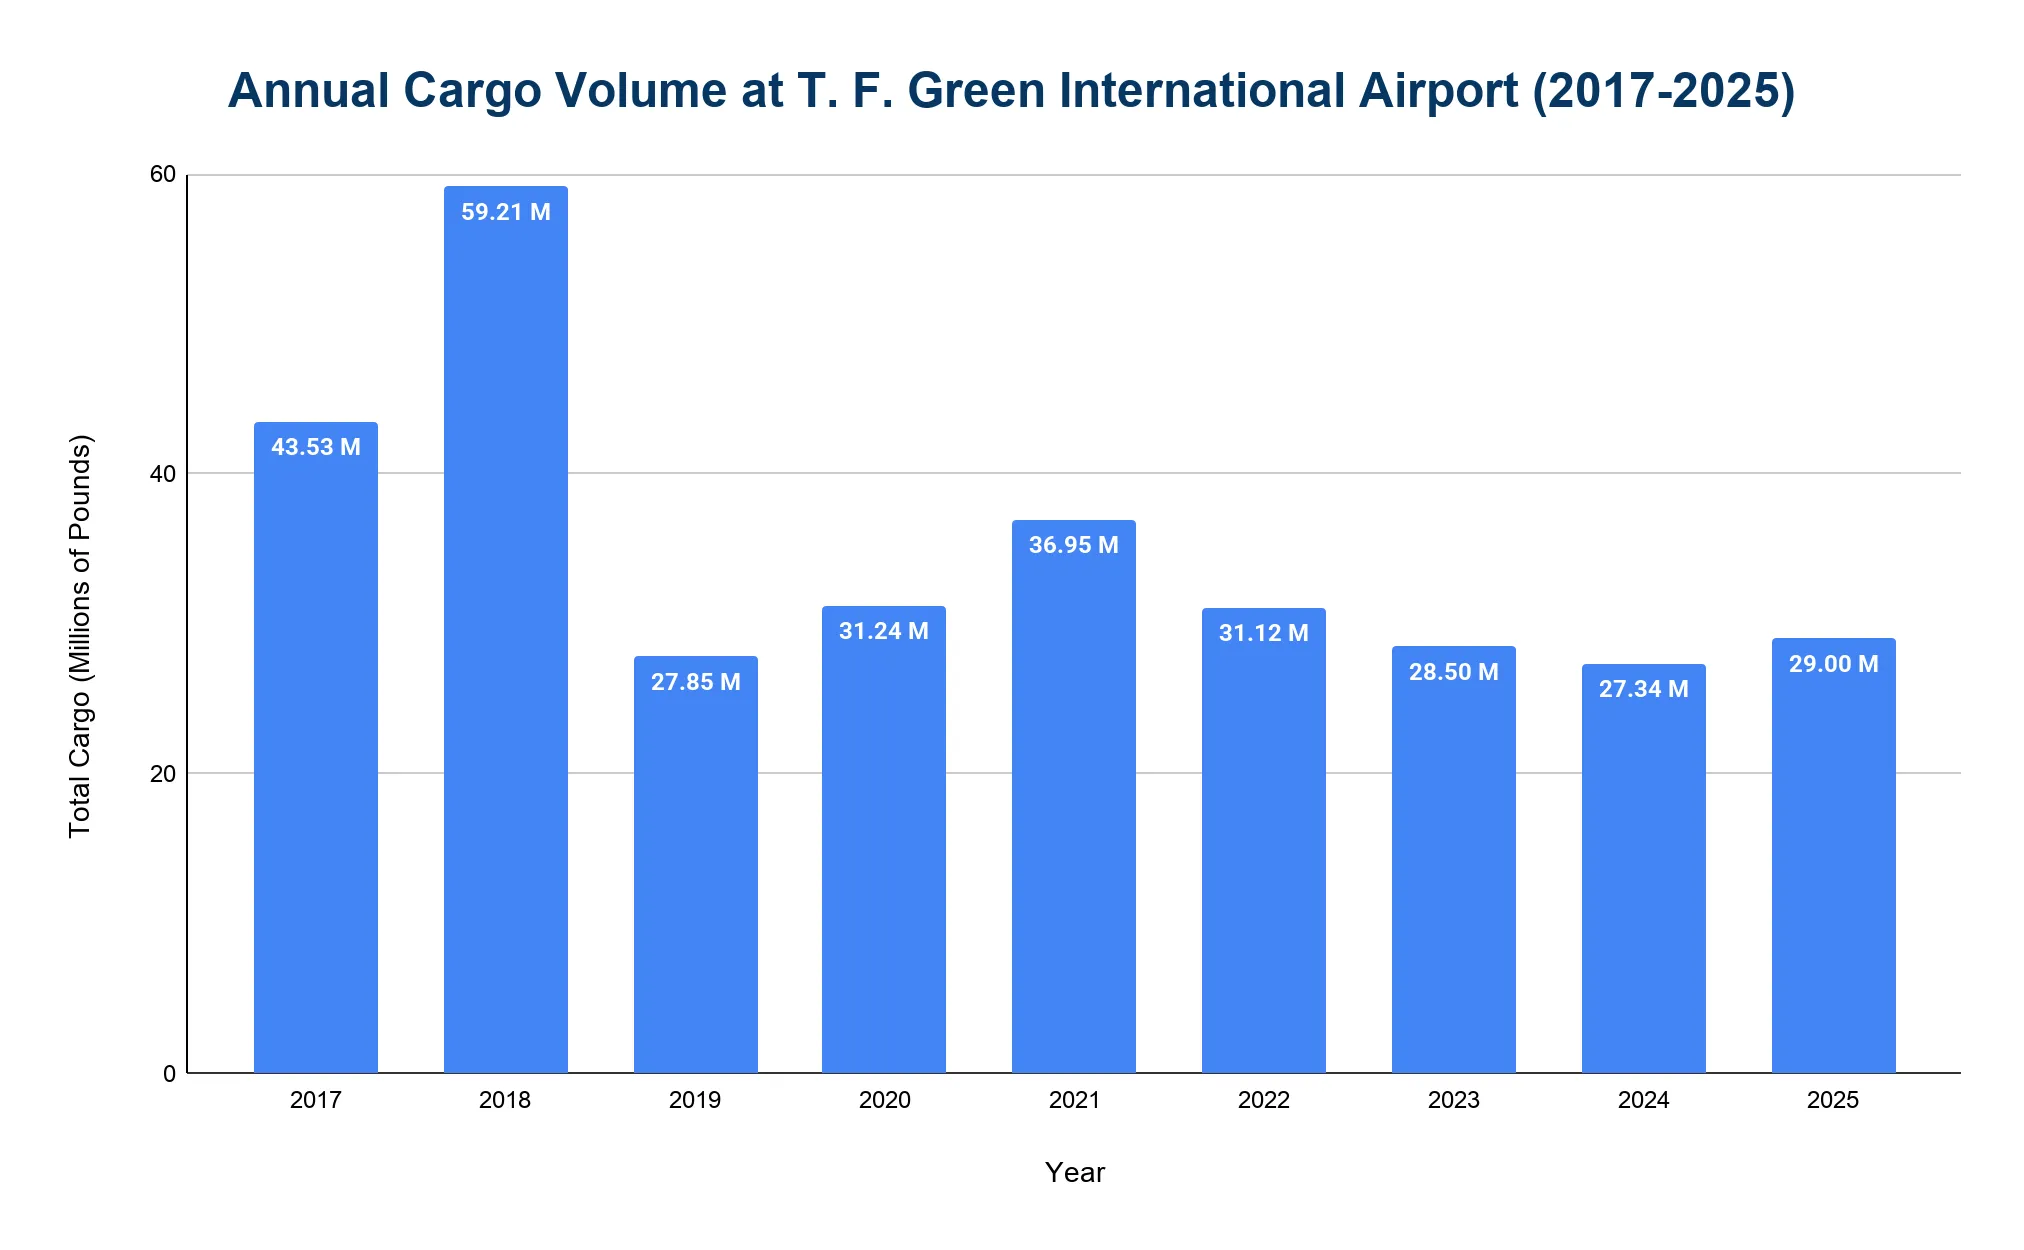
T.F. Green International Airport handles moderate cargo volumes, ranging from approximately 27 to 60 million pounds annually.
- The airport processed 29 million pounds of freight in 2025, a 6.1% increase from 27.34 million pounds in 2024.
- In 2019, it handled 27.85 million pounds before the pandemic.
- Cargo volumes rose to 31.24 million pounds in 2020 and peaked at 36.95 million pounds in 2021 due to increased e-commerce demand.
- They later declined to 31.12 million pounds in 2022 and 28.50 million pounds in 2023 as conditions normalized.
How many cancellations occur at T.F. Green International Airport annually?
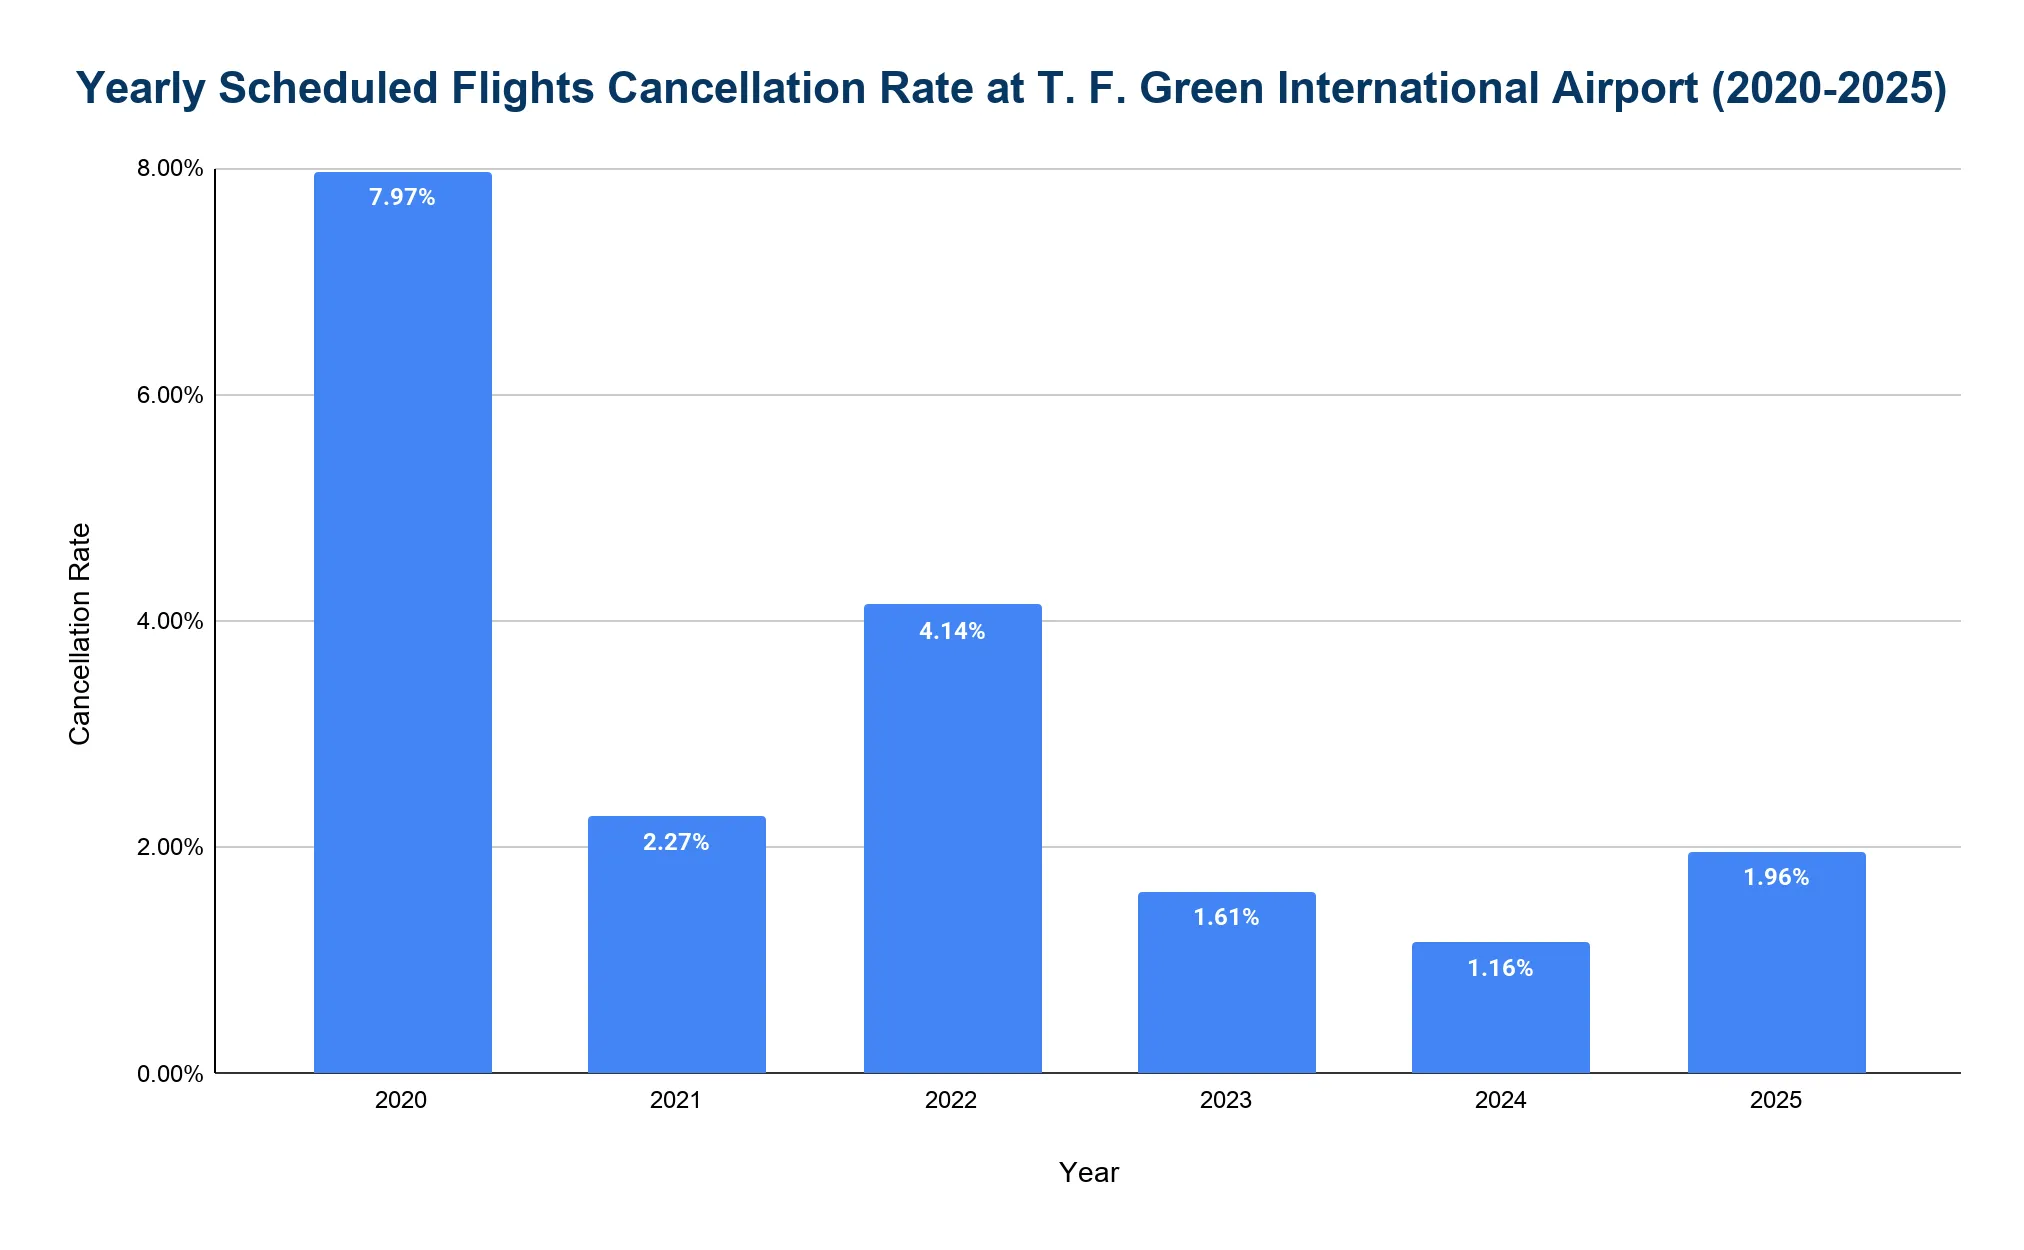
Following the pandemic recovery, flight cancellations at PVD have decreased, with rates averaging below 2% over the last three years..
- In 2025, 1.96% of flights were canceled, higher than 1.16% in 2024.
- The cancellation rate peaked in 2020 at 7.97% due to pandemic disruptions.
- It fell to 2.27% in 2021 and rose slightly to 4.14% in 2022 during industry-wide staffing shortages.
- The rate dropped again to 1.61% in 2023.
What are the main causes of flight disruptions at T.F. Green International Airport?
- Winter weather, including snow and ice, especially between December and March.
- Summer thunderstorms, affecting flights at PVD and nearby hubs.
- Air traffic control delays, mainly at Boston and New York area airports.
- Airline issues, including crew scheduling and aircraft availability.
- Mechanical problems, though less frequent than weather disruptions.
Related Travel Statistics
- Bozeman Airport (BZN) Statistics
- Buffalo Airport (BUF) Statistics
- Hollywood Burbank Airport (BUR) Statistics
- St. Pete-Clearwater Airport Statistics
- Flagstaff Pulliam Airport Statistics
- Harry Reid Airport (LAS) Statistics
- LaGuardia Airport (LGA) Statistics
- Miami International Airport Statistics
- Peoria Airport (PIA) Statistics
- Portland International Jetport Statistics
- Chicago Rockford Airport Statistics
- Spokane International Airport (GEG) Statistics
How much revenue has T.F. Green International Airport generated each year?
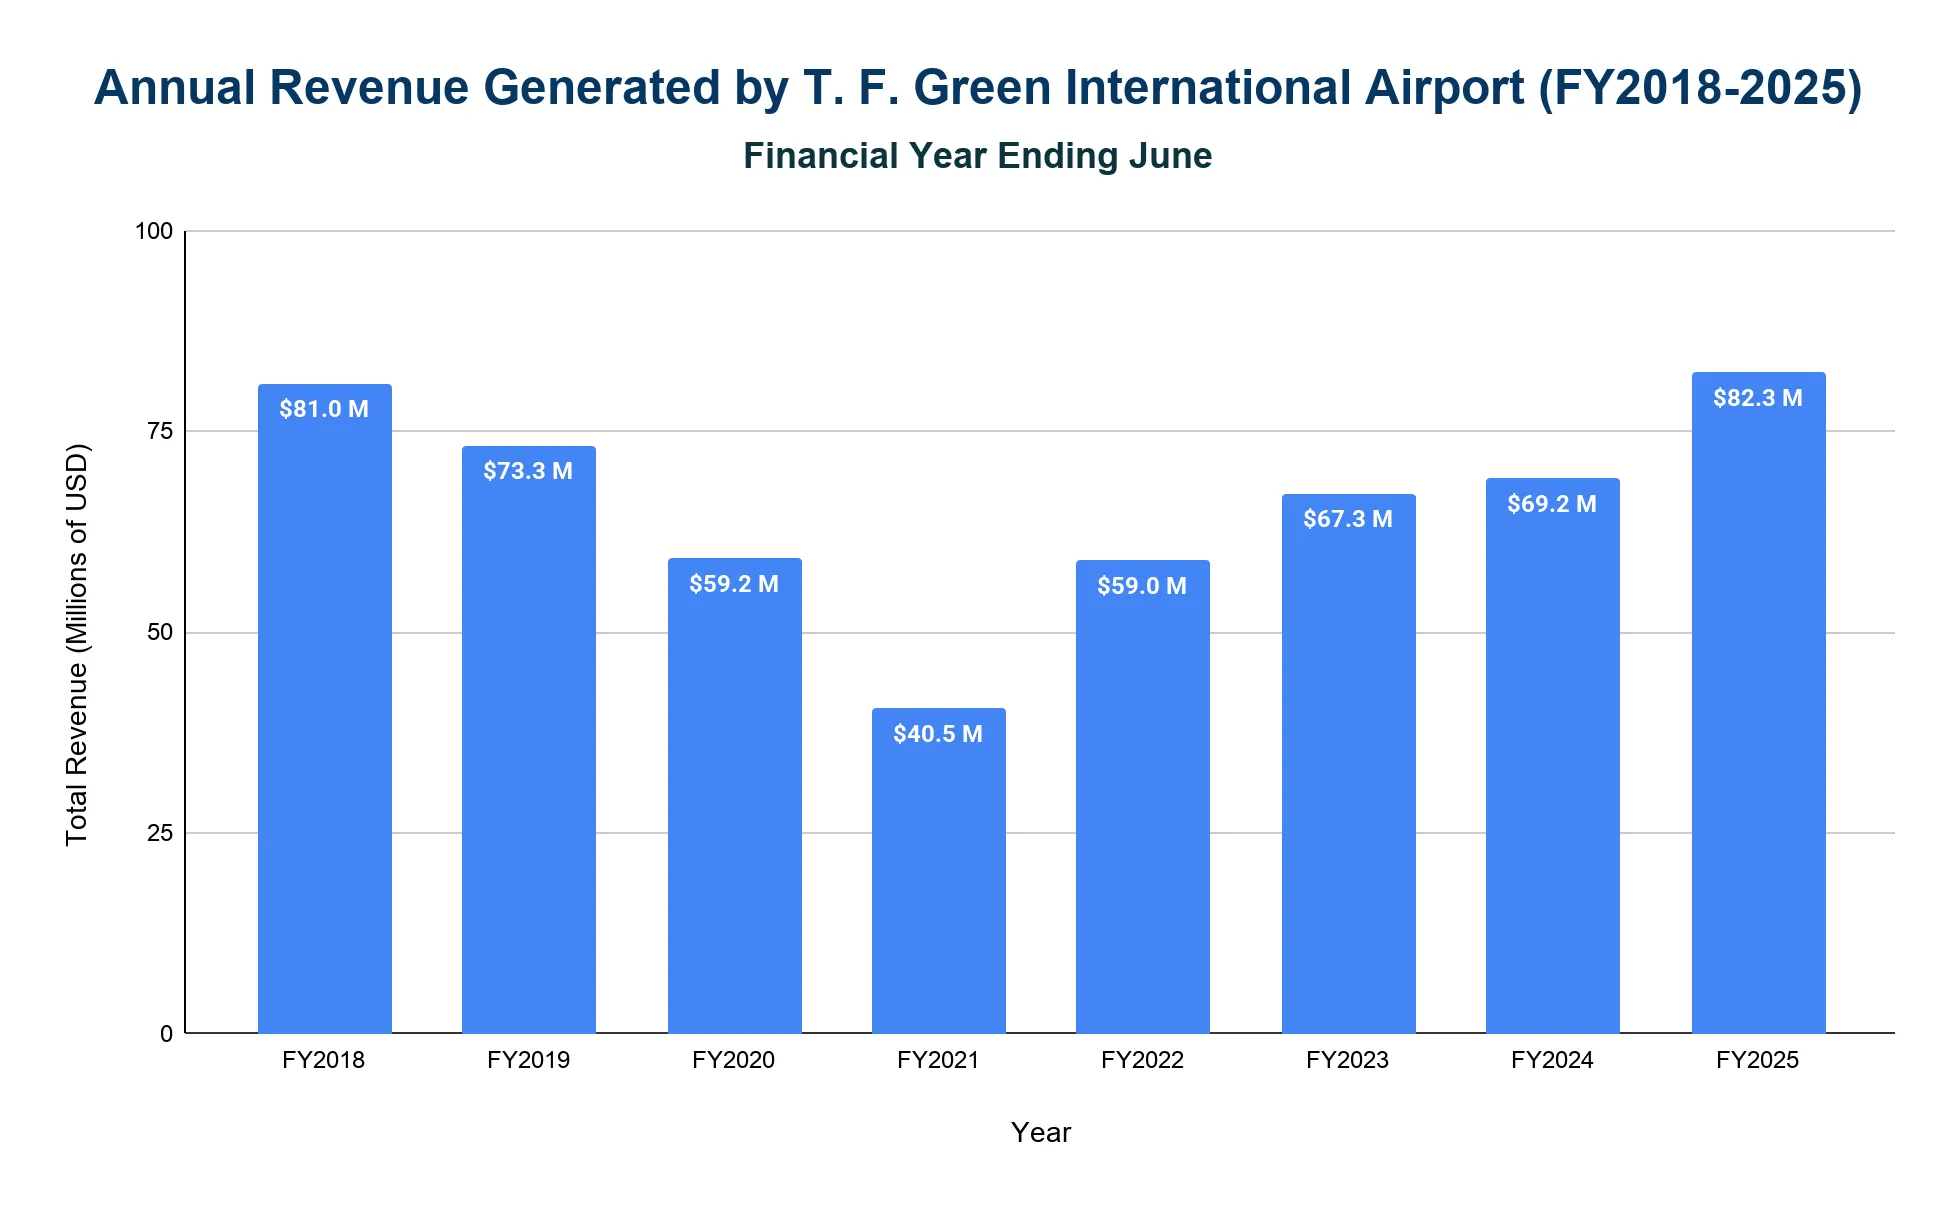
T.F. Green International Airport generates between $70 million and $85 million in annual operating revenue.
- The airport generated $82.3 million in FY2025 (ending June 2025).
- In FY2019, revenue totaled $73.3 million, dropping to $59.2 million in FY2020 and $40.5 million in FY2021 due to pandemic-related travel declines.
- Revenue recovered to $59.0 million in FY2022, $67.3 million in FY2023 and $69.2 million in FY2024.
References
- How Rhode Island's T.F. Green Became America's Fastest-Growing Airport in 2025 · internationalairportreview.com ↑
- T.F. Green International Airport Passenger Data (FLYRI / RIAC) · flyri.com
- FAA OPSNET — George Bush Intercontinental Airport Operations Data · aspm.faa.gov
- BTS TranStats — Airport profiles (route information by airport) · transtats.bts.gov
- T.F. Green International Airport Financial Information (FLYRI / RIAC) · flyri.com
- Aviation Safety Network · aviation-safety.net

