

 Popular Countries
 24/7 Support
Published Sep 9, 2026
Buffalo Niagara International Airport (BUF) is Western New York’s primary passenger and cargo airport, serving the Buffalo Niagara region as well as a cross-border market where approximately 30% of the airport’s passenger traffic originates from Canada. The airport lists up to 100 nonstop flights per day to 31 destinations, and reports about $1.7 billion in annual regional economic activity.
How many passengers use Buffalo Niagara International Airport each year?
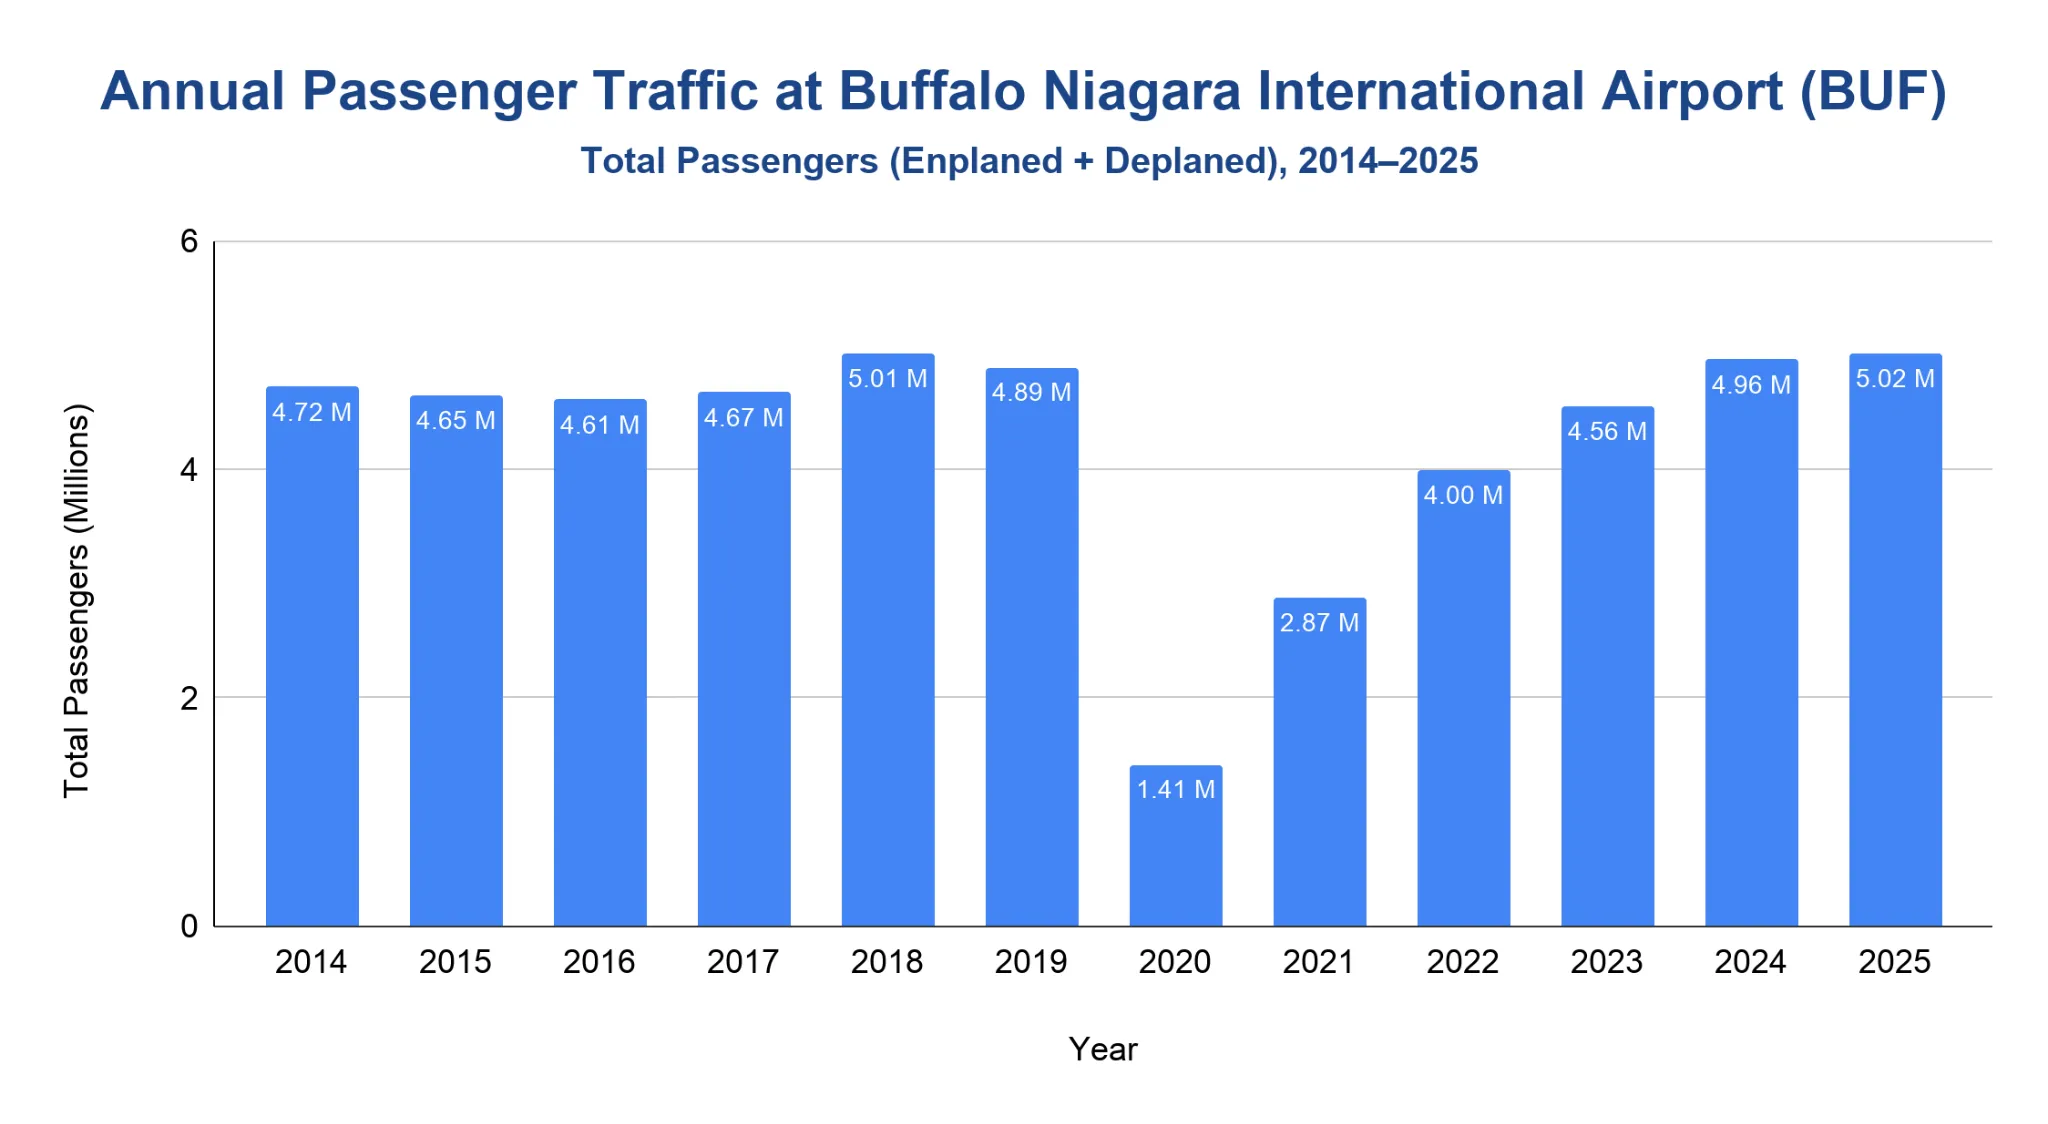
Buffalo Niagara International Airport handled 5.02 million total passengers in 2025.
- From 2014 through 2018, total passenger traffic rose from 4.72 million to 5.01 million, reaching the airport’s pre-pandemic high in 2018.
- In pre-pandemic 2019, traffic eased slightly to 4.89 million total passengers.
- The pandemic cut traffic to 1.41 million passengers in 2020, the lowest number as a result of pandemic restrictions.
- Passenger volume then recovered to 2.87 million in 2021 and 4.00 million in 2022.
- By 2024, BUF had returned to 4.96 million total passengers, about 98.95% of its 2018 level.
- The latest full year, 2025, reached 5.02 million passengers, slightly above the 2018 pre-pandemic high.
- As of January 2026, BUF handled 289,490 total passengers.
Note: Total passengers includes both enplaned passengers and deplaned passengers. Enplaned passengers are those boarding a flight at BUF; deplaned passengers are those arriving and exiting an aircraft.
How many aircraft operations occur at Buffalo Niagara International Airport each year?
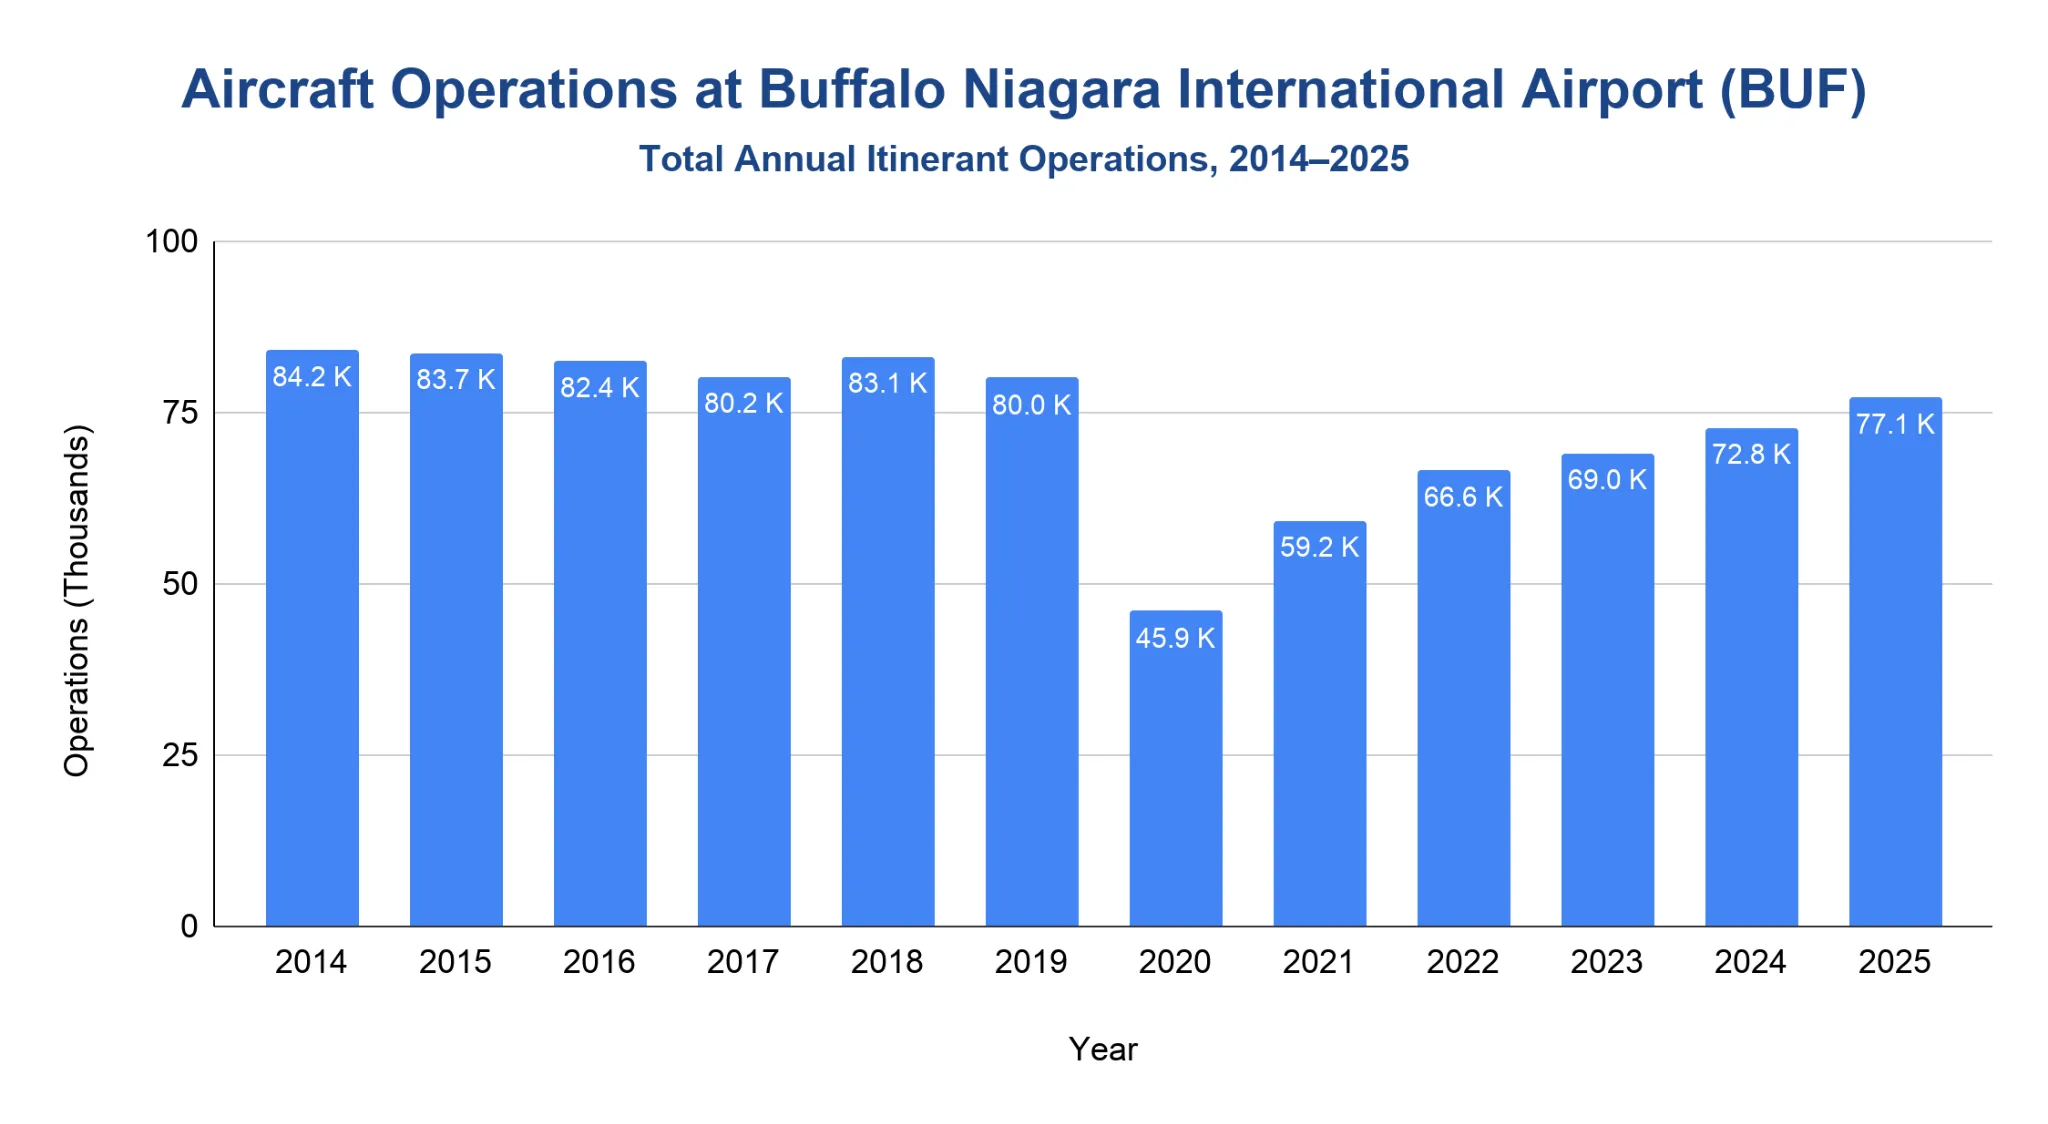
BUF recorded 77,123 aircraft operations in 2025.
- From 2014 through 2018, annual operations stayed relatively stable, moving from 84,150 to 83,102.
- Pre-pandemic 2019 activity dipped to 79,968 operations.
- The pandemic pushed activity down to 45,946 operations in 2020, about 57.46% of the 2019 level.
- Recovery followed from 2021 through 2024, with operations rising from 59,165 to 72,777.
- The latest full year, 2025, reached 77,123 operations, about 96.44% of the 2019 level.
- Air Carrier activity accounted for 51,071 operations in 2025, or about 66.22% of the total.
- As of March 2026, BUF recorded 15,676 operations.
| Itinerant Aircraft Operations by Type at BUF | ||||
|---|---|---|---|---|
| Year | Air Carrier | Air Taxi | General Aviation | Military |
| 2014 | 49,274 | 22,063 | 12,202 | 611 |
| 2015 | 49,629 | 20,764 | 12,656 | 629 |
| 2016 | 47,091 | 23,422 | 11,300 | 635 |
| 2017 | 49,301 | 19,162 | 11,355 | 354 |
| 2018 | 54,184 | 17,095 | 11,351 | 472 |
| 2019 | 50,394 | 17,889 | 11,312 | 373 |
| 2020 | 26,161 | 10,193 | 9,081 | 511 |
| 2021 | 33,037 | 13,301 | 12,362 | 465 |
| 2022 | 42,361 | 11,649 | 11,953 | 621 |
| 2023 | 46,068 | 11,697 | 11,004 | 276 |
| 2024 | 48,854 | 11,846 | 11,740 | 337 |
| 2025 | 51,071 | 13,102 | 12,512 | 438 |
Source · This table shows FAA OPSNET itinerant operations only.
Which airlines carry the most passengers at Buffalo Niagara International Airport?
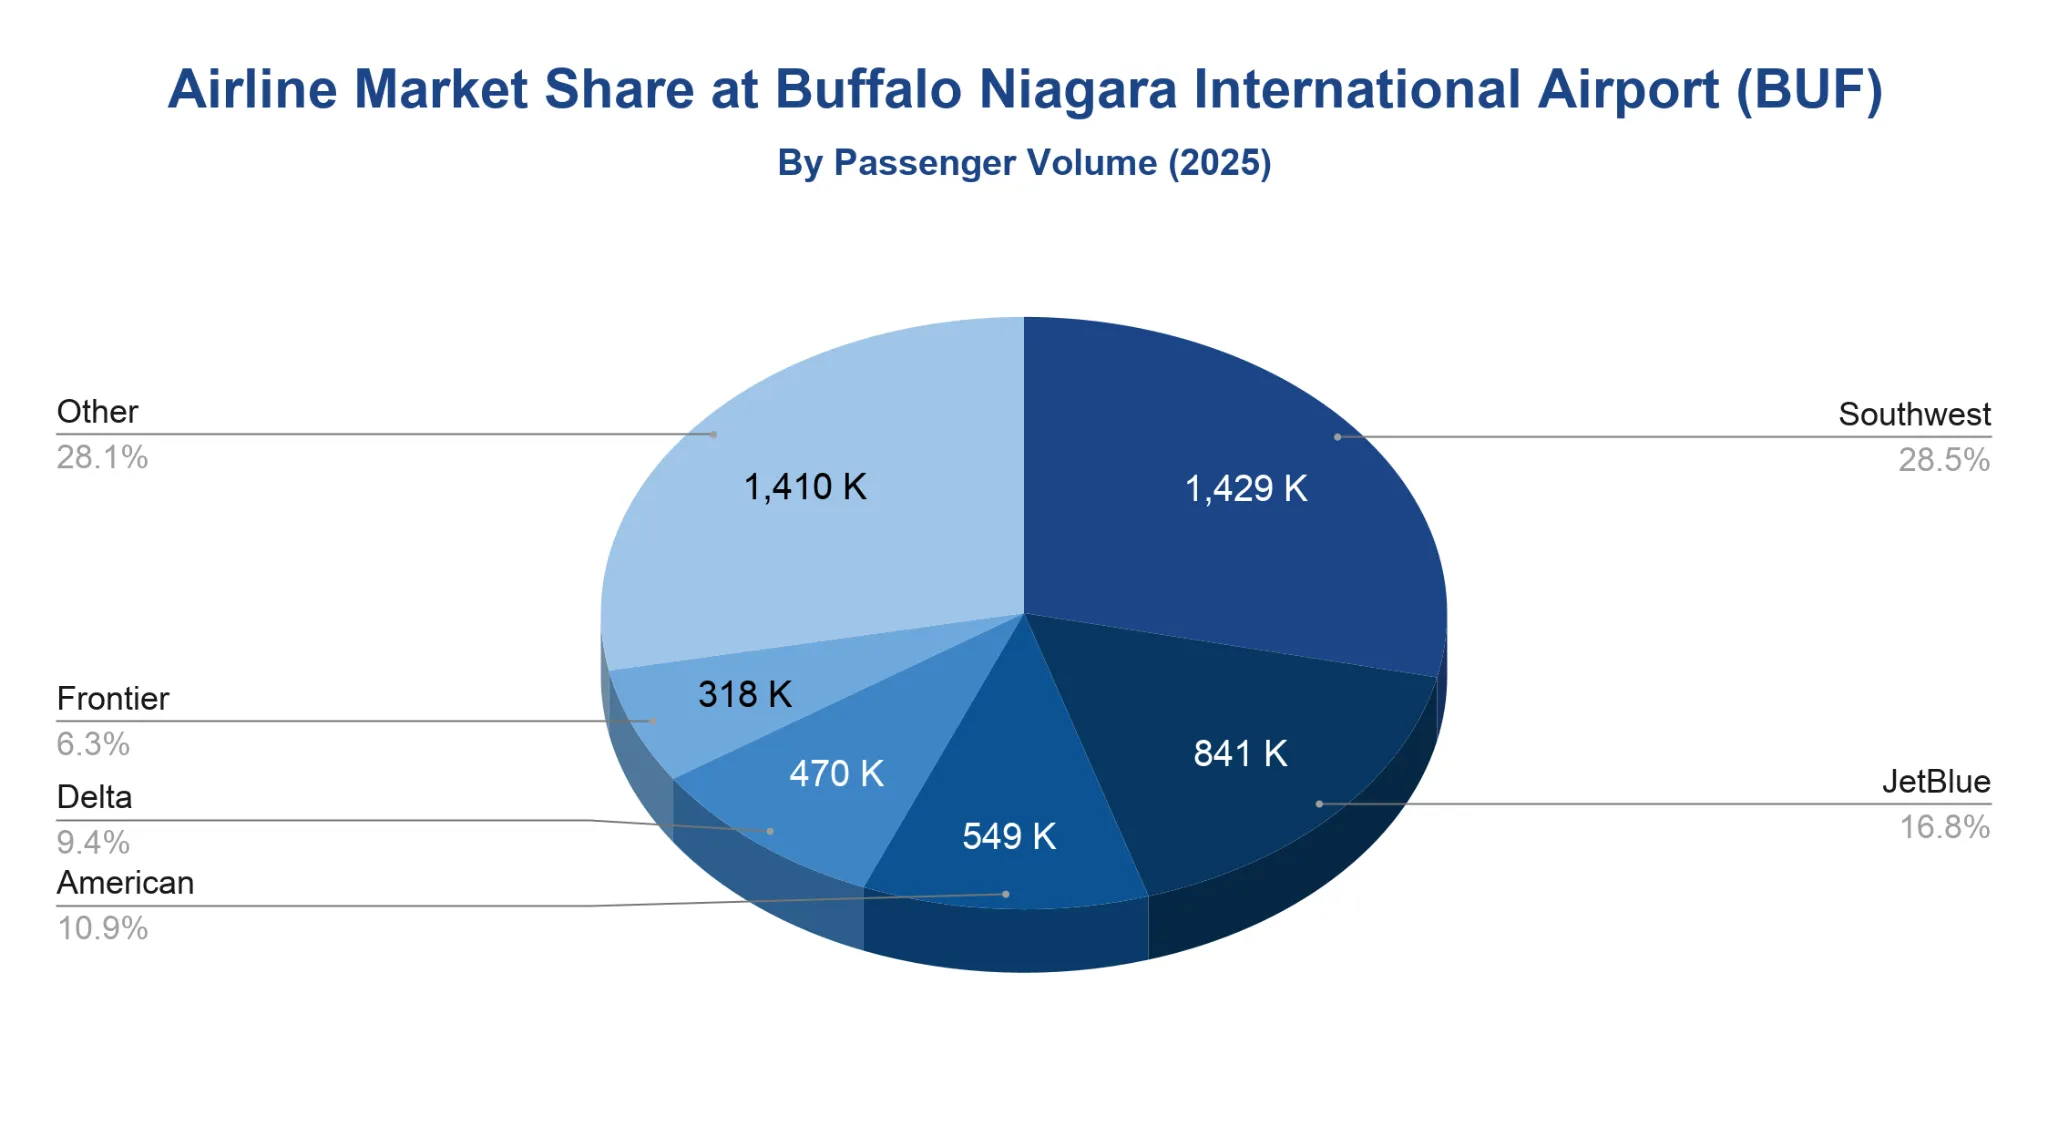
Southwest carried the largest share of BUF passenger traffic in 2025, with 1.43 million passengers.
- Southwest led the airport with 28.48% of total carrier passenger traffic.
- JetBlue ranked second with 841,000 passengers and 16.77% share.
- American, Delta and Frontier followed with 549,000, 470,000 and 318,000 passengers, respectively.
- Southwest, JetBlue and Frontier together carried about 2.59 million passengers, or 51.58% of total carrier traffic.
- Other carriers together accounted for 1.41 million passengers, or 28.10% of the total.
Note: Carrier totals are shown in thousands and represent passenger traffic by airline, not the number of flights operated.
What are the most popular destinations from Buffalo Niagara International Airport?
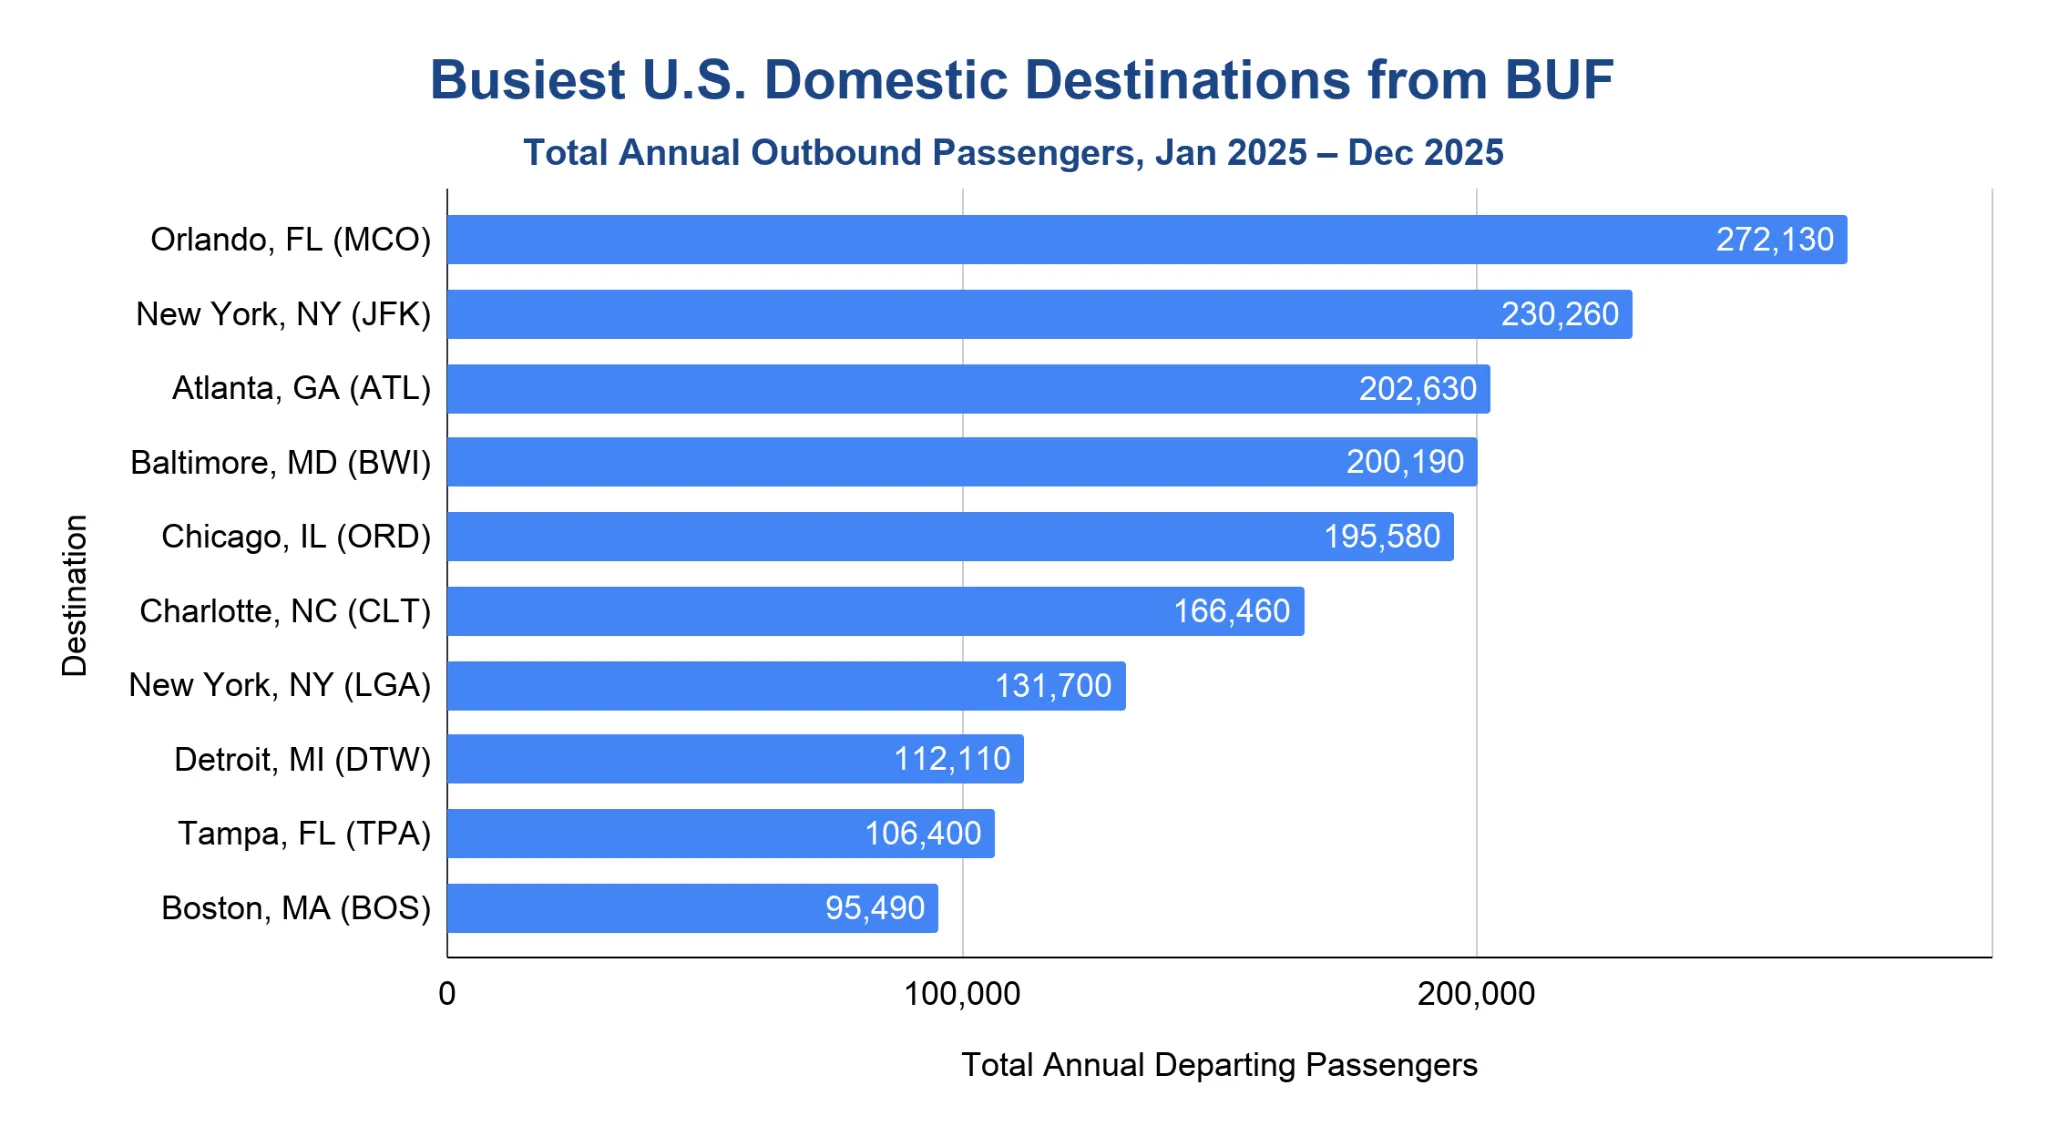
Orlando was BUF’s busiest U.S. domestic outbound destination in 2025, with 272,130 passengers.
- New York JFK ranked second with 230,260 passengers, reflecting BUF’s strong New York City demand.
- Atlanta ranked third at 202,630, followed closely by Baltimore at 200,190.
- Chicago O’Hare rounded out the top 5 with 195,580 passengers.
- The top 10 U.S. domestic destination airports together accounted for about 1.71 million outbound passengers from BUF.
- Florida remained a major leisure market, with Orlando and Tampa both ranking in the top 10.
Note: These figures cover domestic destination airports only from T-100 Domestic Market (US Carriers). “Outbound passengers” refers to passengers traveling from BUF to each listed U.S. domestic destination.
Peak Travel Months at Buffalo Niagara International Airport
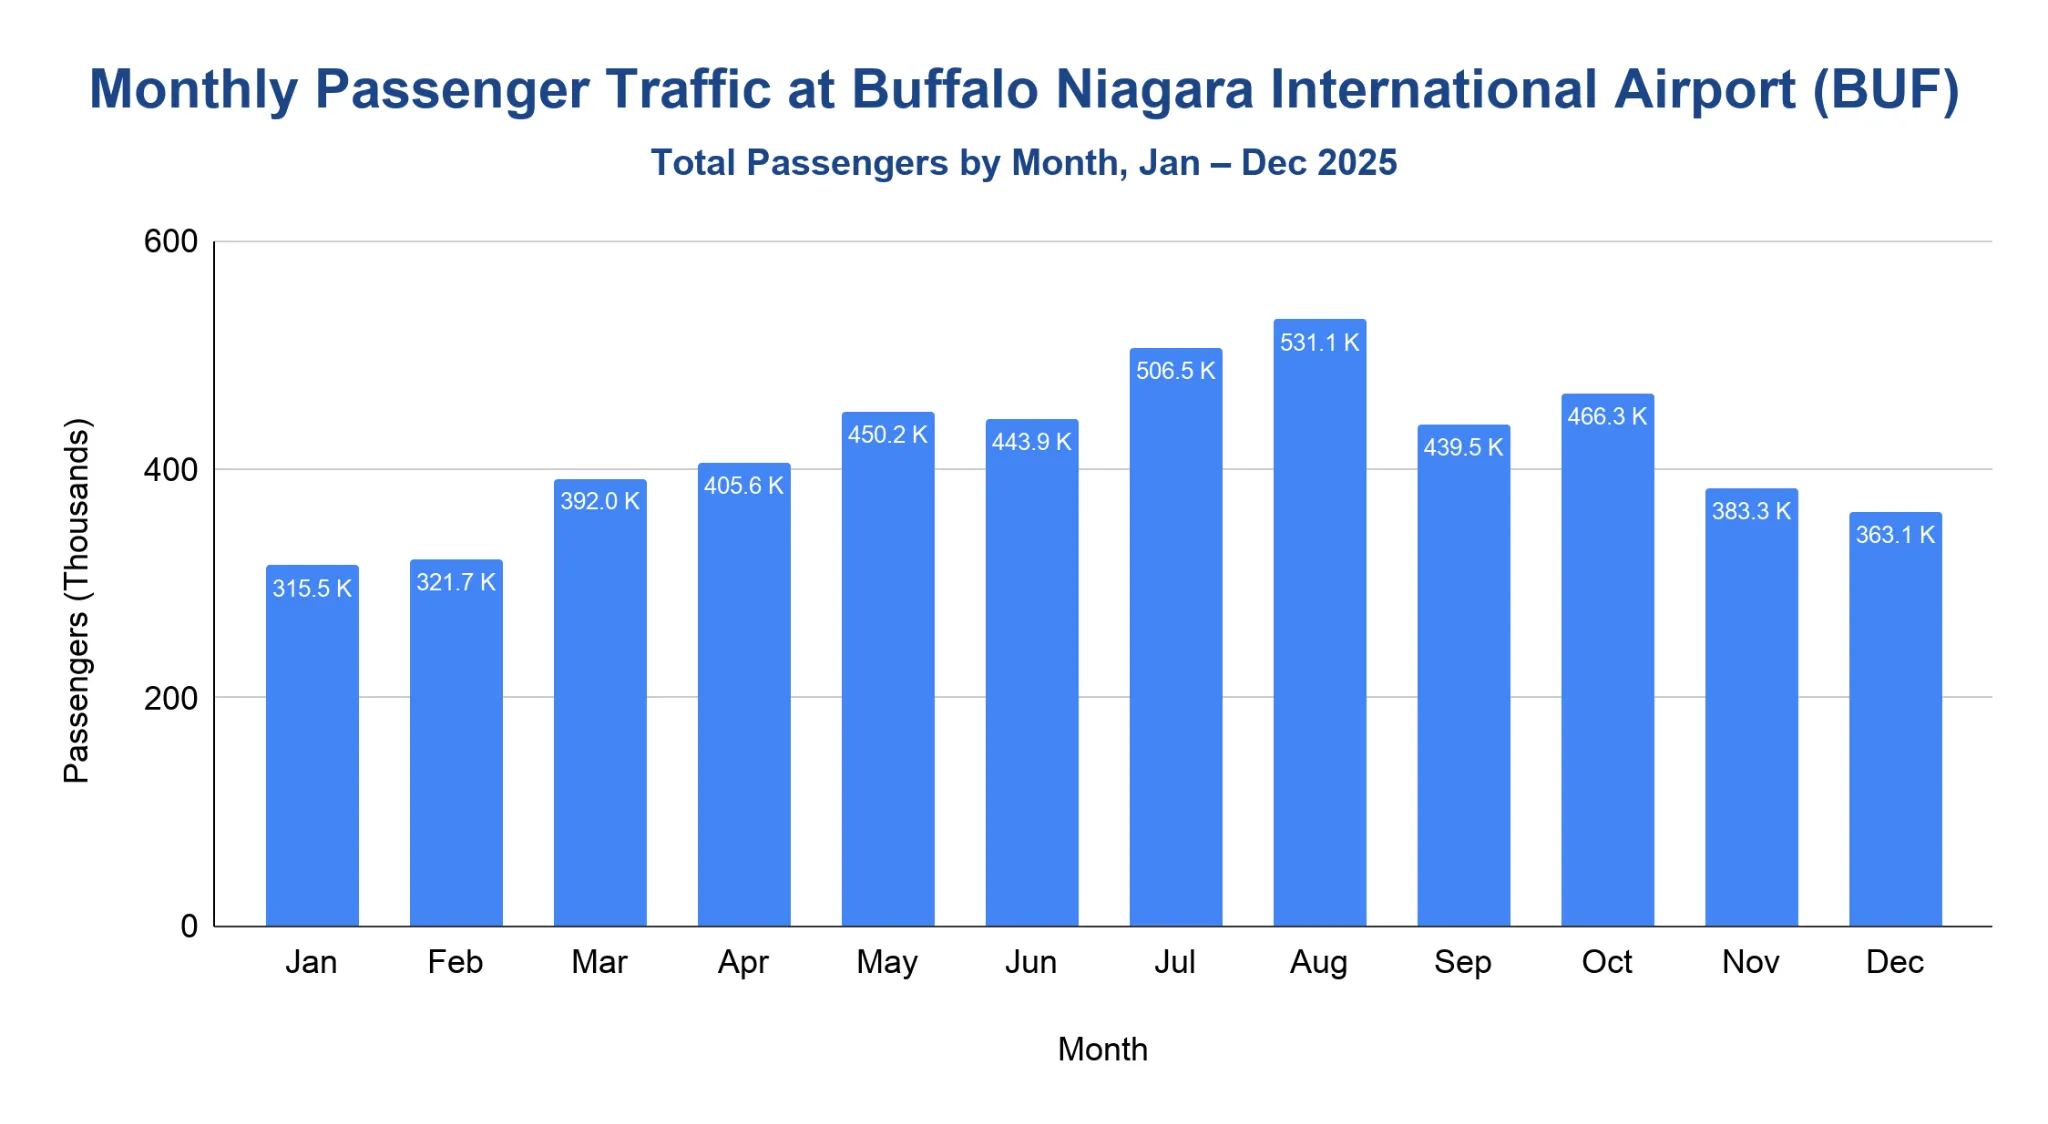
August was BUF’s busiest month in 2025, with 531,101 total passengers.
- Summer produced the strongest travel volumes, with July and August both above 500,000 total passengers.
- May and October also topped 450,000 passengers, reaching 450,216 and 466,335, respectively.
- February was the lowest full month in 2025, with 321,687 passengers.
- The spring travel period rose from 391,993 passengers in March to 405,569 in April.
- December handled 363,140 passengers, below the summer peak but above the January and February totals.
Note: Monthly figures are calendar-month passenger totals from Bureau of Transportation Statistics (BTS) data.
How much cargo moves through Buffalo Niagara International Airport each year?
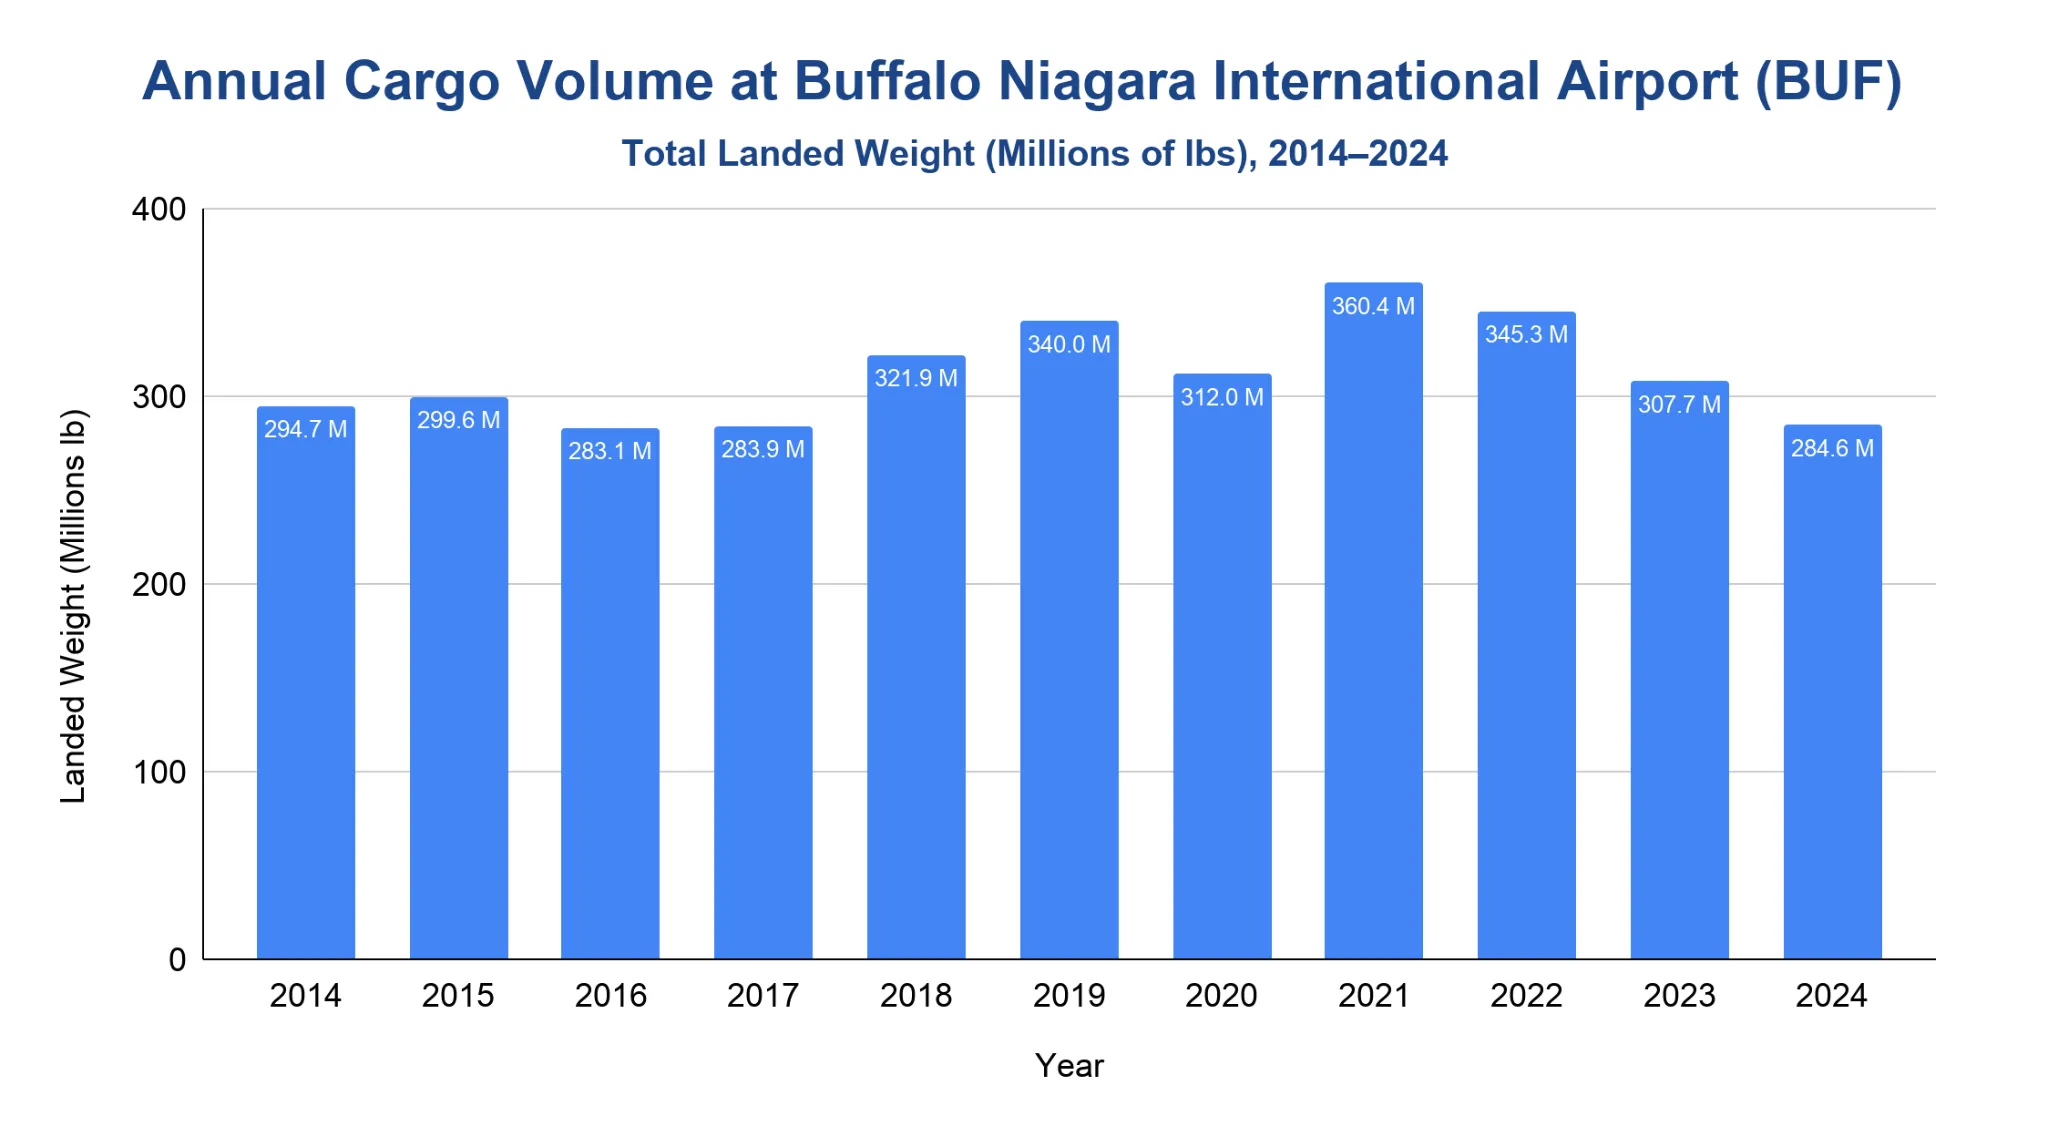
The FAA recorded 284.56 million lb of all-cargo landed weight at BUF in 2024.
- From 2014 through 2018, all-cargo landed weight increased from 294.68 million lb to 321.86 million lb.
- The pre-pandemic year 2019 rose further to 339.95 million lb.
- During 2020, landed weight fell to 311.98 million lb.
- The post-pandemic peak came in 2021, when BUF reached 360.39 million lb.
- Landed weight then declined each year from 2022 through 2024, reaching 284.56 million lb in the latest FAA file.
- BUF ranked 82nd among all-cargo airports by landed weight in 2024.
Note: FAA all-cargo landed weight measures the landed weight of all-cargo aircraft using the airport. It is not the same as the actual weight of freight or mail handled.
How much revenue does Buffalo Niagara International Airport generate each year?
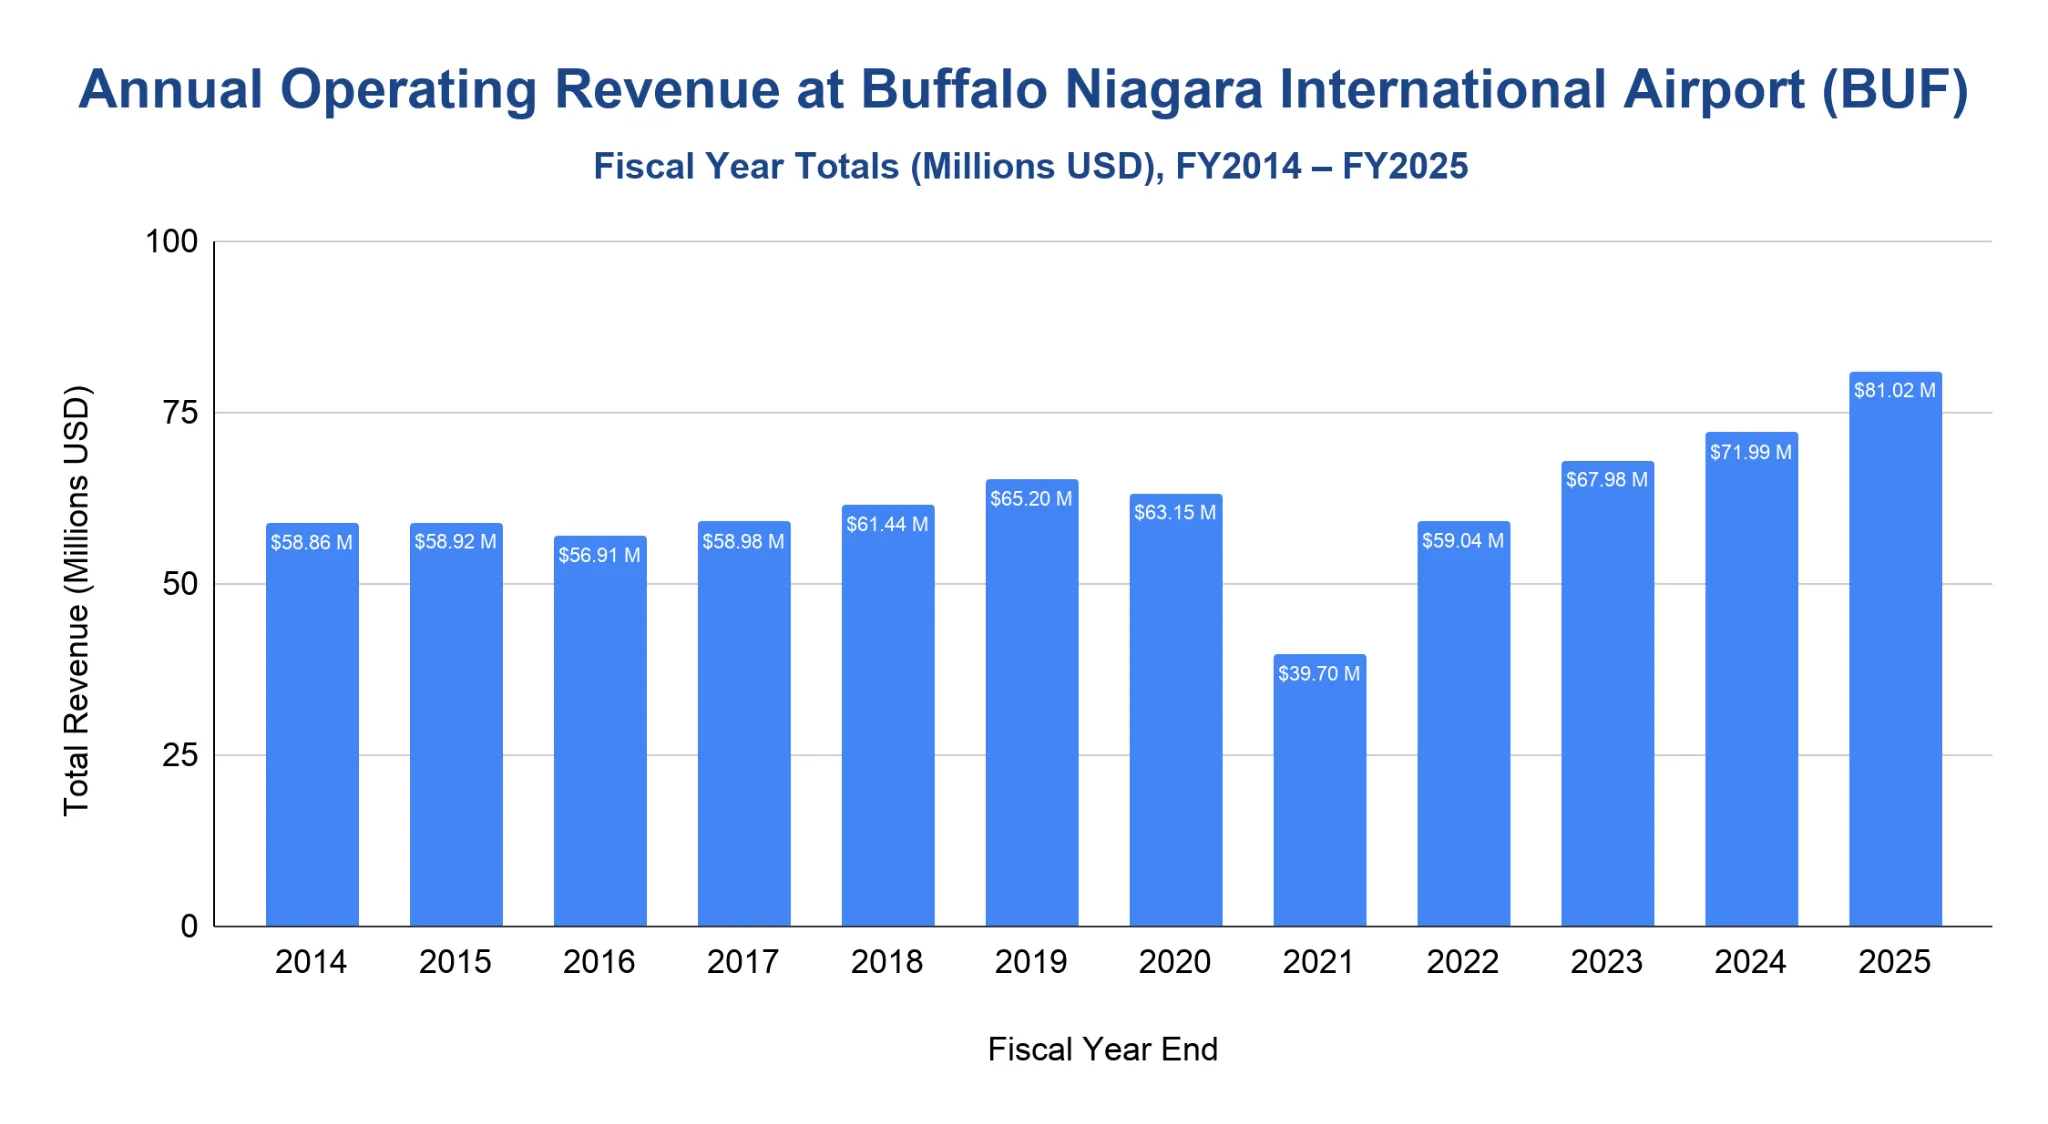
BUF generated $81.02 million in total operating revenue in FY2025.
- From FY2014 through FY2019, total operating revenue grew from $58.86 million to $65.20 million.
- FY2020 slipped to $63.15 million as the pandemic period began.
- FY2021 marked the low point in this series, with revenue falling to $39.70 million.
- Revenue rebounded to $59.04 million in FY2022 and $67.98 million in FY2023.
- FY2024 reached $71.99 million, followed by $81.02 million in FY2025.
- The latest year was up 12.55% from FY2024.
Note: BUF fiscal years ended March 31 through FY2022, then June 30 from FY2023 onward, so the series includes a reporting-calendar change.
What is Buffalo Niagara International Airport's on-time performance?
BUF posted a 77% on-time departure rate for major-carrier domestic flights in 2025.
- Departure on-time performance was strongest in 2021, at 84%.
- The rate fell to 75% in 2022.
- BUF improved to 79% in 2023 and 80% in 2024 before slipping to 77% in 2025.
- Arrival on-time performance followed a similar pattern, declining from 78% in 2021 to 72% in 2025.
- The cancellation rate peaked at 5.7% in 2022, then stayed close to 2% from 2023 through 2025.
- For February 2025 through January 2026, BUF’s rolling-period departure on-time rate was 77%.
| Metric | 2021 | 2022 | 2023 | 2024 | 2025 | 2026 |
|---|---|---|---|---|---|---|
| Departure on-time rate | 84% | 75% | 79% | 80% | 77% | 77% |
| Arrival on-time rate | 78% | 70% | 75% | 75% | 72% | 72% |
| Average departure delay (min.) | 72.78 | 78.13 | 80.13 | 77.36 | 79.46 | 79.80 |
| Average arrival delay (min.) | 62.83 | 64.89 | 65.63 | 65.61 | 67.80 | 68.64 |
| Cancellation rate | 1.60% | 5.70% | 2.13% | 2.22% | 2.10% | 2.05% |
| Total flights (000) | 14.4 | 20.1 | 20.8 | 22.2 | 20.7 | 19.3 |
| Reporting carriers | 12 | 12 | 11 | 11 | 10 | 10 |
Source · BTS defines delayed flights as flights arriving or departing 15 or more minutes after schedule. Average delay minutes (denoted as min.) in this table are calculated from delayed flights only, not all scheduled flights. BTS publishes average delays in decimal-minute format. As such, the values have been kept exactly as reported to avoid altering the underlying data. 2026 reflects February 2025–January 2026.
Major Expansion Projects at Buffalo Niagara International Airport
NFTA’s FY2024 financial statements list a completed $72.2 million terminal and baggage-claim expansion at BNIA.
- The passenger terminal and baggage-claim expansion began in 2019 and was completed in 2022.
- NFTA also reported a main-runway rehabilitation program with an estimated cost of about $92.2 million.
- Construction related to the main-runway project began in 2023 and was being carried out in 2 phases.
- BUF also received $4.4 million in federal funds to replace up to 4 passenger boarding bridges.
- The airport’s Master Plan update is underway and expected to be completed by the end of 2025.
Note: Project amounts come from official financial, planning or grant sources and should not be treated as final closeout costs.
Buffalo Niagara International Airport Sustainability Initiatives
Niagara Frontier Transportation Authority (NFTA) 2025 sustainability report includes a 2024 baseline inventory covering airport operations.
- NFTA’s sustainability report includes direct and indirect greenhouse-gas emissions from transit vehicles, airport operations and NFTA facilities.
- The 2024 inventory is intended to serve as a baseline for tracking future emissions reductions.
- BUF’s engineered-wetlands system treats runoff from aircraft deicing activities.
- NFTA describes BUF as the first airport in the country to use natural methods to treat chemicals left behind by airplane deicing.
- NFTA reported that EV charging stations were installed at Buffalo Niagara International Airport and Niagara Falls International Airport, in partnership with the New York Power Authority and the New York State Energy Research and Development Authority (NYSERDA).
Note: This section includes only initiatives directly supported by NFTA or official government sources.
Related Travel Statistics
- Daytona Beach International Airport Statistics
- Greenville–Spartanburg Airport Statistics
- Atlanta Airport (ATL) Statistics
- LaGuardia Airport (LGA) Statistics
- Myrtle Beach Airport (MYR) Statistics
- Tweed–New Haven Airport (HVN) Statistics
- Newark Airport (EWR) Statistics
- Eppley Airfield (OMA) Statistics
- Chicago Rockford Airport Statistics
- Salt Lake City International Airport Statistics
- Santa Barbara Municipal Airport Statistics
- Spokane International Airport (GEG) Statistics
What is Buffalo Niagara International Airport's safety record?
The officially documented Colgan Air Flight 3407 accident near BUF killed 50 people in 2009.
- On February 12, 2009, Colgan Air Flight 3407, a Bombardier DHC-8-400 operating as Continental Connection Flight 3407, crashed during an instrument approach to Buffalo Niagara International Airport.
- The aircraft struck a residence in Clarence Center, about 5 nautical miles northeast of the airport.
- National Transportation Safety Board (NTSB) reported that the crash killed the 2 pilots, 2 flight attendants, 45 passengers and 1 person on the ground.
- NTSB found the probable cause was the captain’s inappropriate response to the stick-shaker activation, which led to an aerodynamic stall from which the aircraft did not recover.
- FAA’s lessons-learned material says the accident became a catalyst for changes related to pilot experience, training, simulators and pilot employment records.
Note: This section keeps only the safety event supported by official NTSB, FAA or Department of Transportation (DOT) sources.
How does Buffalo Niagara International Airport rank among U.S. airports?
BUF ranked 62nd among U.S. commercial service airports by passenger boardings in 2024.
- FAA classified BUF as a Primary Commercial Service, Medium Hub airport in the 2024 enplanement ranking.
- Within New York State, BUF ranked third by passenger boardings, behind JFK and LaGuardia.
- BUF recorded 2.50 million passenger boardings in 2024.
- The airport reports approximately $1.7 billion in annual economic activity, nearly 12,000 jobs and $127 million in annual state and local tax contributions.
- Its cross-border role remains important, with NFTA reporting that approximately 30% of BNIA passenger traffic originates from Canada.
Note: FAA rankings use passenger boardings, also called enplanements, not total passenger traffic.
References
- Buffalo Niagara International Airport — Airport Overview, Destinations and Economic Impact · buffaloairport.com
- Niagara Frontier Transportation Authority — Financial Statements, Construction Projects and Sustainability Initiatives · nfta.com
- Bureau of Transportation Statistics — LAS Performance Data and Route Information · bts.gov
- FAA OPSNET Airport Operations Standard Report (2014–2025) · aspm.faa.gov
- FAA Passenger Boarding and All-Cargo Data Master · faa.gov
- FAA CATS — total operating revenue data (2014–2025) · cats.airports.faa.gov
- NTSB Aviation Accident Reports (2016–2021) · ntsb.gov

