

 Popular Countries
 24/7 Support
Published Sep 9, 2026
Myrtle Beach International Airport (MYR) is operated by the Horry County Department of Airports and serves the Grand Strand region from Myrtle Beach, South Carolina. The airport provides commercial air service to a wide range of destinations across the United States and plays an important role in supporting tourism, business travel, and regional connectivity throughout the area.
How many passengers fly through Myrtle Beach International Airport each year?
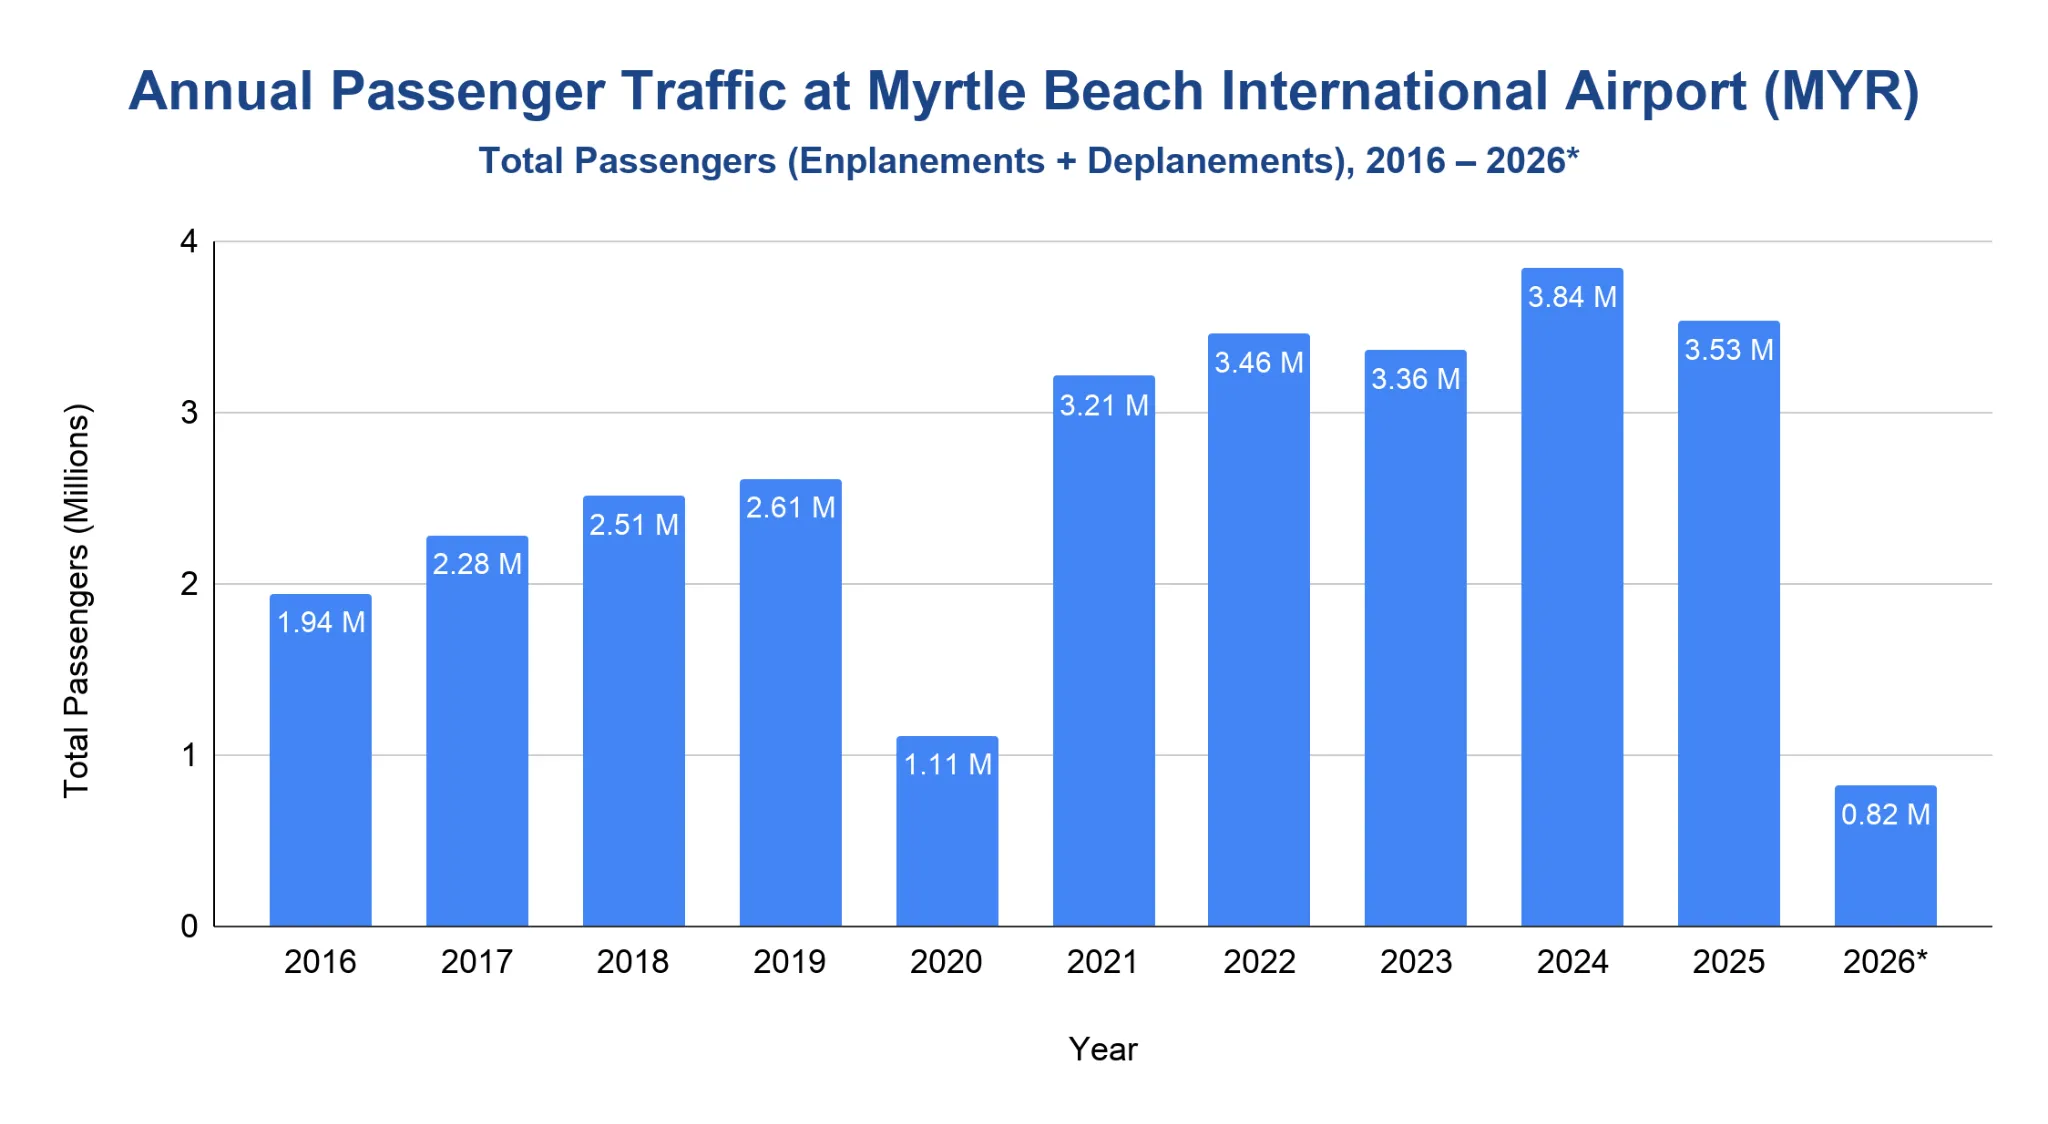
MYR handled 3.53 million total passengers in 2025, below its 2024 record but still 35.2% above 2019.
- Passenger volume climbed from 1.94 million in 2016 to 2.61 million in 2019, a 34.4% increase before the pandemic.
- Traffic fell to 1.11 million passengers in 2020, down 57.4% from 2019.
- The rebound was fast, with MYR reaching 3.21 million passengers in 2021 and 3.46 million in 2022, before a slight decrease to 3.36 million in 2023.
- A new peak came in 2024, when MYR handled 3.84 million total passengers.
- The 2025 total eased to 3.53 million, about 8% below the 2024 record but still well above the 2019 pre-pandemic level.
Note: Totals are calculated as enplanements plus deplanements. Percent changes are calculated from full raw values, not from the rounded values shown in prose or the standardized table. Table values are shown in millions for readability. MYR's current public passenger tables show full-year data from 2016 onward; 2026\ is partial-year data through April.*
Does Myrtle Beach International Airport offer domestic or international flights?
MYR's current official route map lists 50+ nonstop domestic destinations, all shown within the United States.
- The airport's current route map includes major United States markets such as Atlanta, Baltimore, Boston, Charlotte, Chicago, Dallas, Denver, Detroit, New York, Orlando, Philadelphia and Washington, D.C.
- Seasonal Canadian service appeared in earlier MYR passenger tables through Porter and WestJet.
- Porter and WestJet together accounted for 13,523 passenger movements in 2017, less than 1% of MYR's total traffic that year.
- International-carrier activity fell after the late 2010s, though a small Porter total reappeared in 2022.
- Current MYR route materials do not list a Canadian nonstop destination.
How many aircraft operations does Myrtle Beach International Airport handle each year?
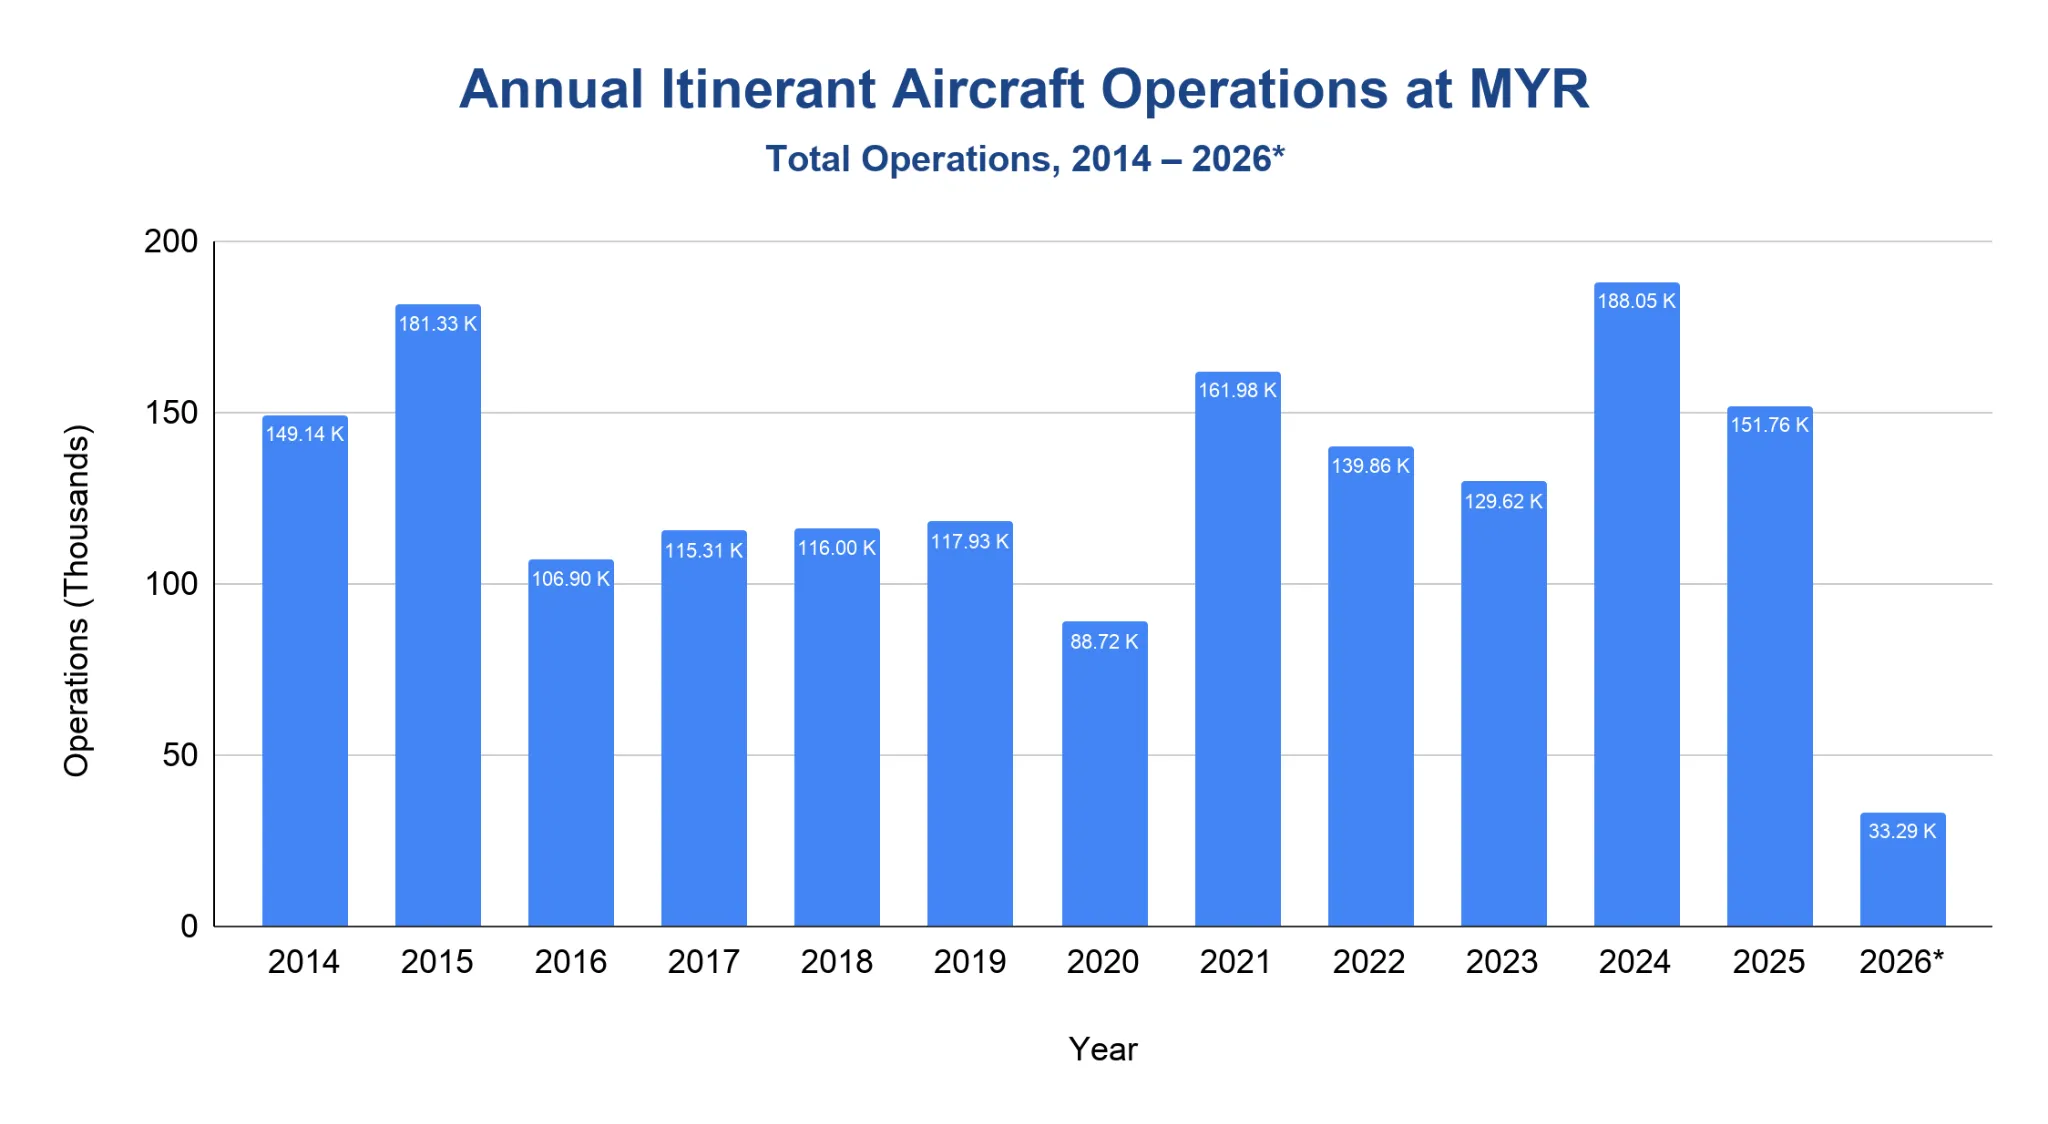
MYR recorded 151,763 itinerant aircraft operations in 2025, down from its 2024 high but still above the 2019 pre-pandemic level.
- Itinerant operations rose from 149,142 operations in 2014 to 181,325 in 2015, dropped to 106,897 in 2016, and then settled between 115,000 and 118,000 annually from 2017 through 2019.
- The pandemic reduced itinerant operations to 88,715 in 2020, a 24.8% drop from 2019.
- Activity rebounded strongly in 2021, reaching 161,976 itinerant operations.
- MYR reached a new series high of 188,048 itinerant operations in 2024.
- The 2025 total was 151,763, about 19.3% below 2024 but 28.7% above 2019.
| Itinerant Aircraft Operations by Type at MYR (2014 – 2026*) | |||||
|---|---|---|---|---|---|
| Year | Air Carrier | Air Taxi | General Aviation | Military | Itinerant Total |
| 2014 | 16,040 | 118,147 | 11,535 | 3,420 | 149,142 |
| 2015 | 15,793 | 149,949 | 12,314 | 3,269 | 181,325 |
| 2016 | 17,542 | 72,936 | 12,941 | 3,478 | 106,897 |
| 2017 | 20,809 | 76,428 | 14,196 | 3,874 | 115,307 |
| 2018 | 23,675 | 71,817 | 15,408 | 5,099 | 115,999 |
| 2019 | 23,320 | 74,433 | 14,578 | 5,600 | 117,931 |
| 2020 | 14,810 | 57,102 | 12,646 | 4,157 | 88,715 |
| 2021 | 32,241 | 110,689 | 14,483 | 4,563 | 161,976 |
| 2022 | 32,291 | 85,767 | 16,198 | 5,600 | 139,856 |
| 2023 | 28,343 | 78,442 | 18,151 | 4,685 | 129,621 |
| 2024 | 32,729 | 134,405 | 17,748 | 3,166 | 188,048 |
| 2025 | 31,660 | 101,961 | 15,810 | 2,332 | 151,763 |
| 2026* | 7,920 | 19,335 | 5,269 | 767 | 33,291 |
Source · Note: Federal Aviation Administration (FAA) Operations Network (OPSNET) figures above use itinerant operations only. Percentage changes are calculated from the full itinerant totals shown in the table. The 2026* row covers January through April.
Which airlines operate the most flights out of Myrtle Beach International Airport?
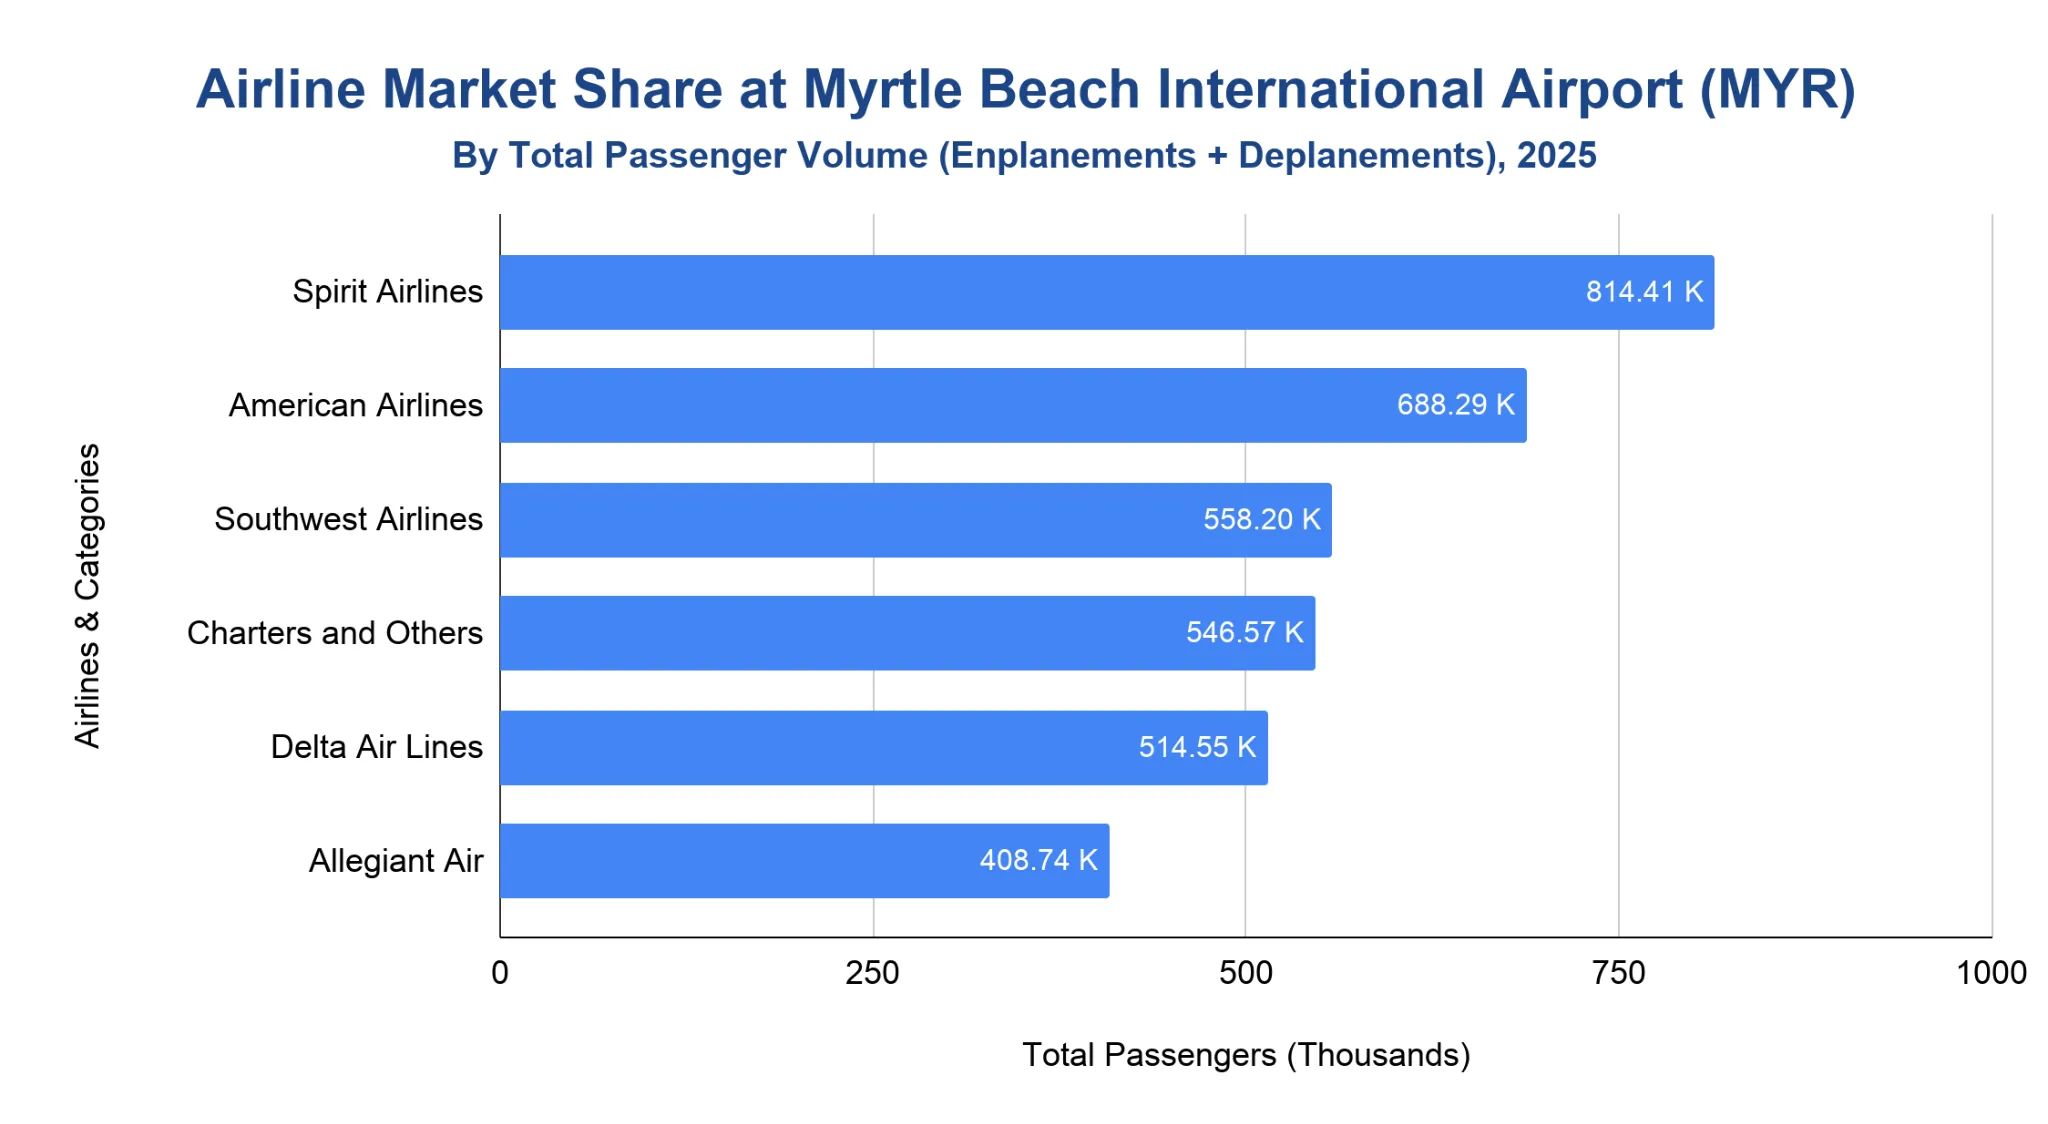
Spirit Airlines carried 814,413 total MYR passengers in 2025, the largest airline total at the airport.
- Spirit Airlines led MYR with 814,413 total passenger movements, or 23.1% of the airport total.
- American Airlines followed with 688,291 passengers, or 19.5%.
- Southwest Airlines carried 558,196 passengers, equal to 15.8% of the MYR total.
- Delta Air Lines handled 514,546 passengers, while Allegiant Air handled 408,735.
- The top five individual airlines together carried 2.98 million passengers, or 84.5% of MYR's 2025 traffic.
Note: This section uses passenger movements rather than flight departures because MYR publishes the airline breakdown as enplanements plus deplanements. Table passenger values are shown in thousands for readability.
What are the most popular routes from Myrtle Beach International Airport?
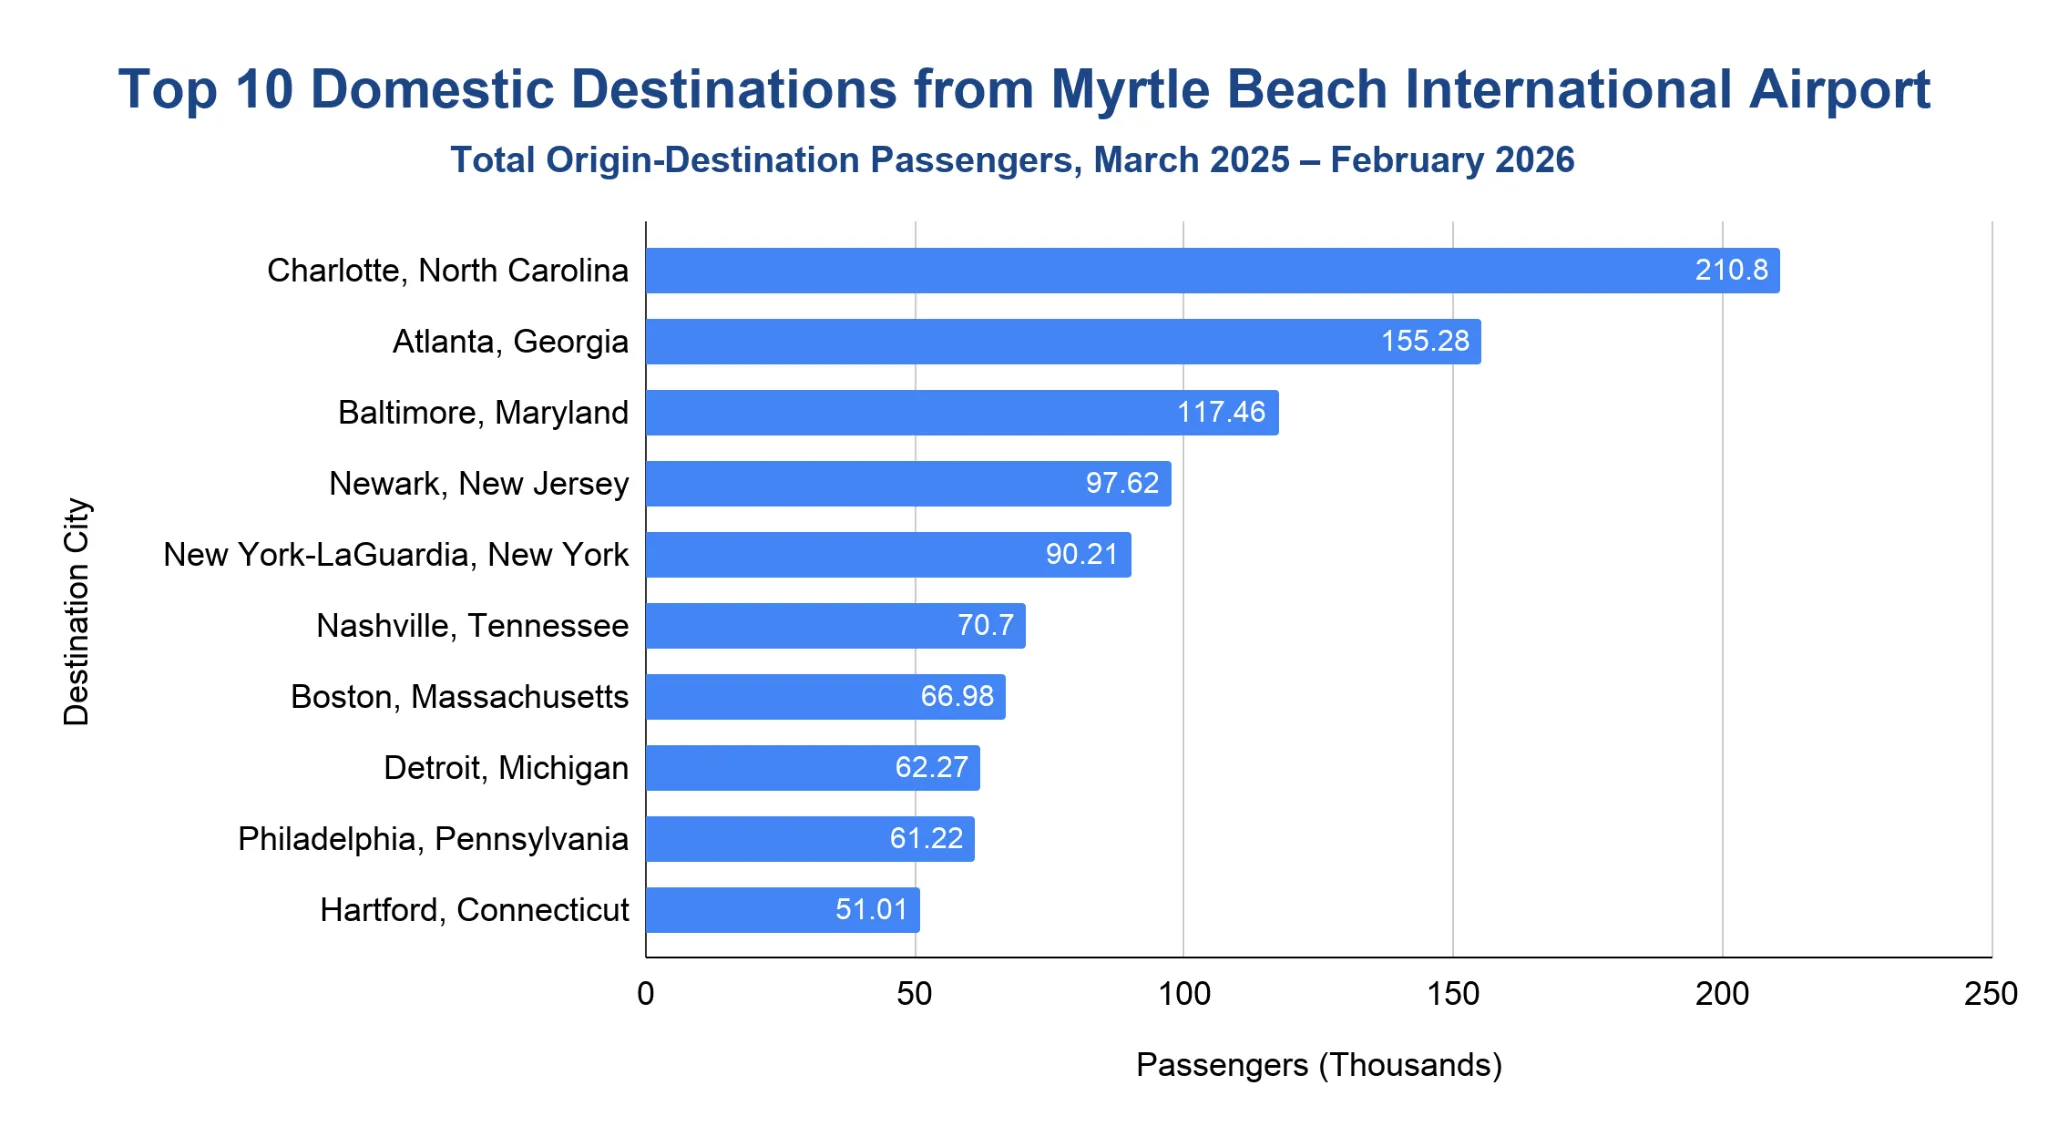
Charlotte was MYR's busiest domestic route market in March 2025–February 2026, with 210,800 passengers.
- Charlotte ranked first, reflecting American Airlines' hub connection from MYR.
- Atlanta followed with 155,280 passengers, supported by Delta's hub service.
- Baltimore ranked third with 117,460 passengers.
- Newark and New York-LaGuardia completed the top five, showing MYR's continued strength in Northeast leisure markets.
- The top 10 domestic route markets together accounted for 983,550 passengers.
Note: Bureau of Transportation Statistics route-market figures show domestic passengers for the stated 12-month period. They should not be read as total airport passenger traffic. Table passenger values are shown in thousands for readability.
Peak Travel Months at Myrtle Beach International Airport
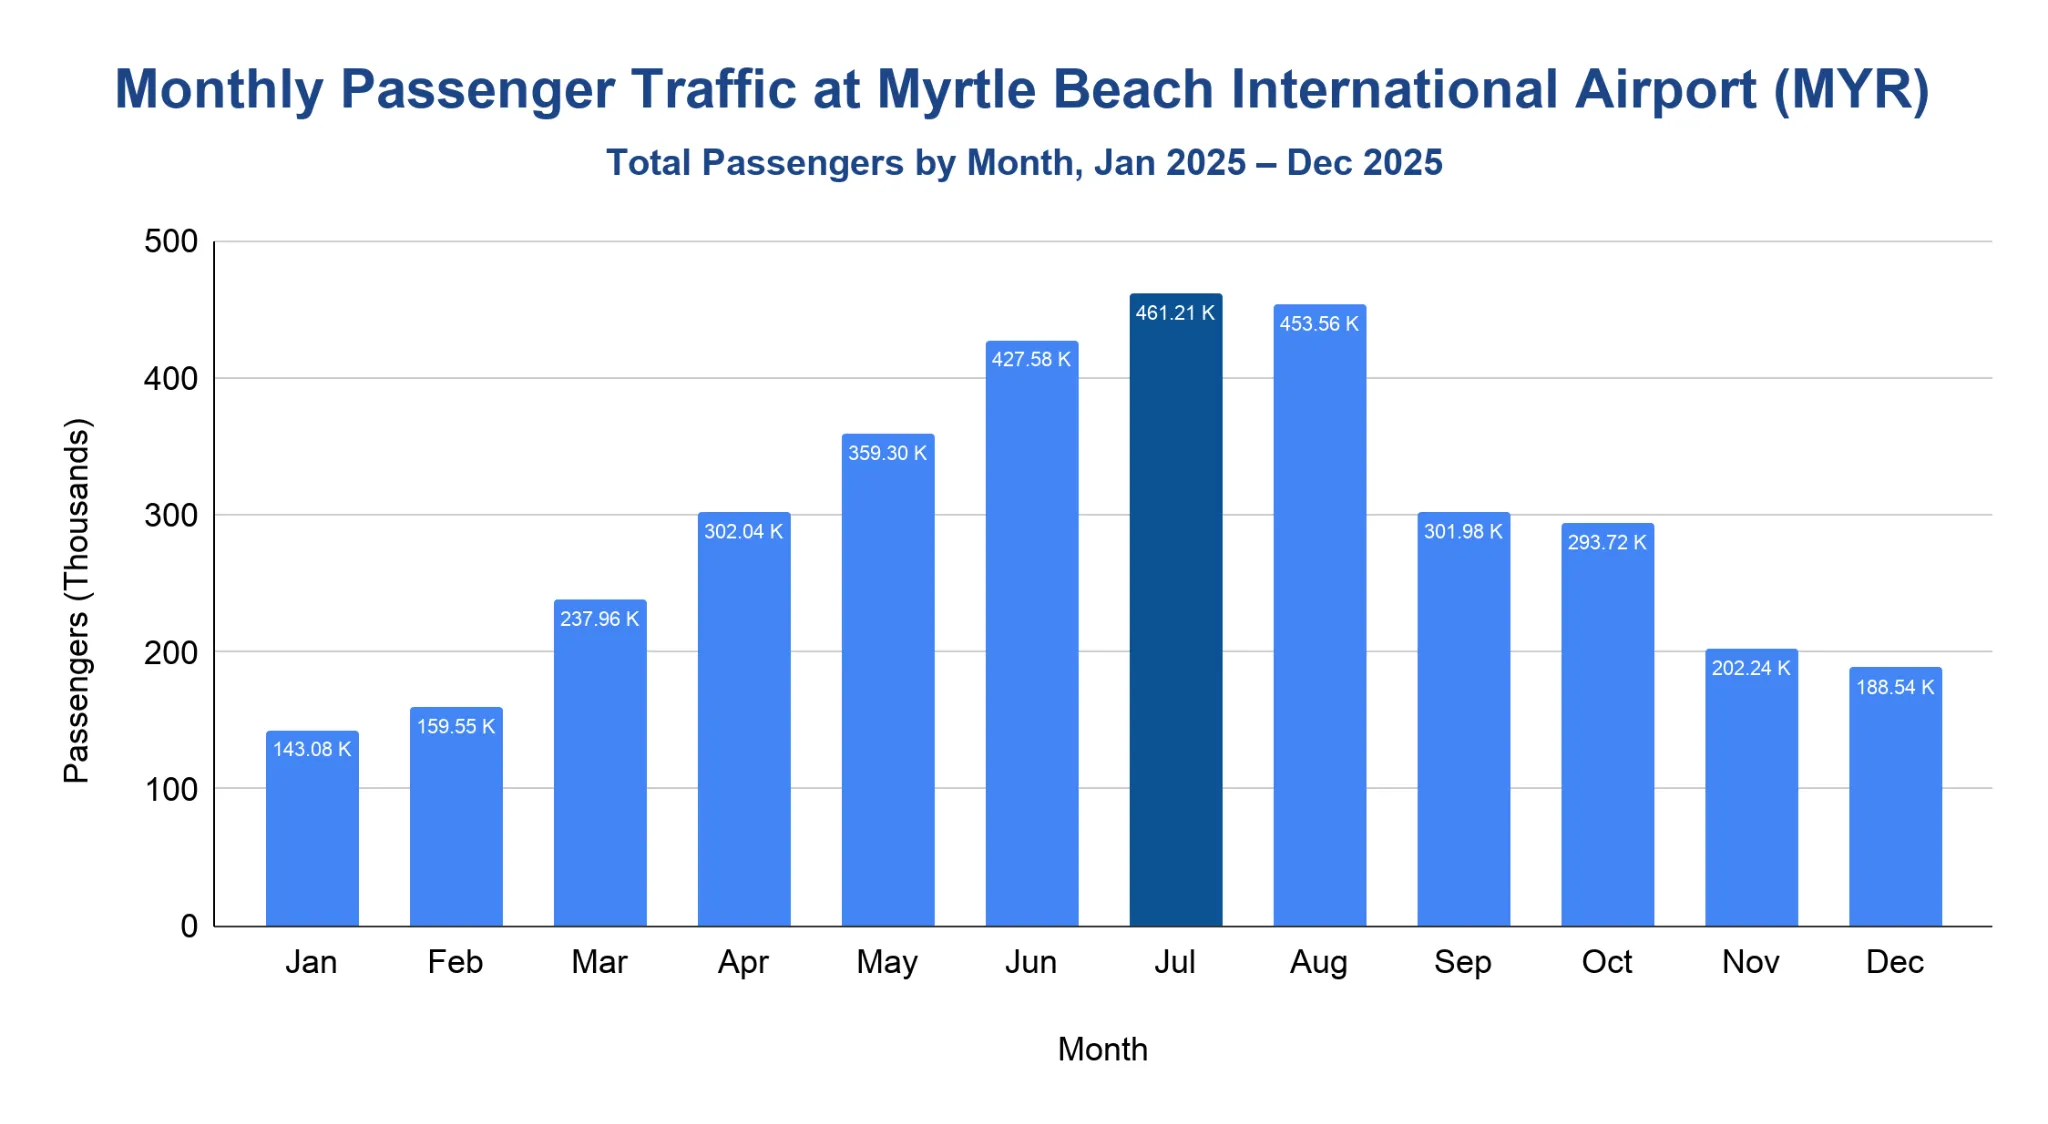
July was MYR's busiest month in 2025, with 461,208 total passengers.
- August followed with 453,560 passengers.
- June handled 427,579 passengers, confirming the airport's strong summer travel pattern.
- June through August together accounted for 1.34 million passengers, or about 38% of MYR's annual total.
- January was the slowest month, with 143,083 passengers.
- The shoulder months of May, September and October also remained substantial, each above 290,000 passengers.
Note: Monthly totals are calculated as enplanements plus deplanements. Summer means June through August. Table passenger values are shown in thousands for readability.
How much revenue does Myrtle Beach International Airport generate each year?
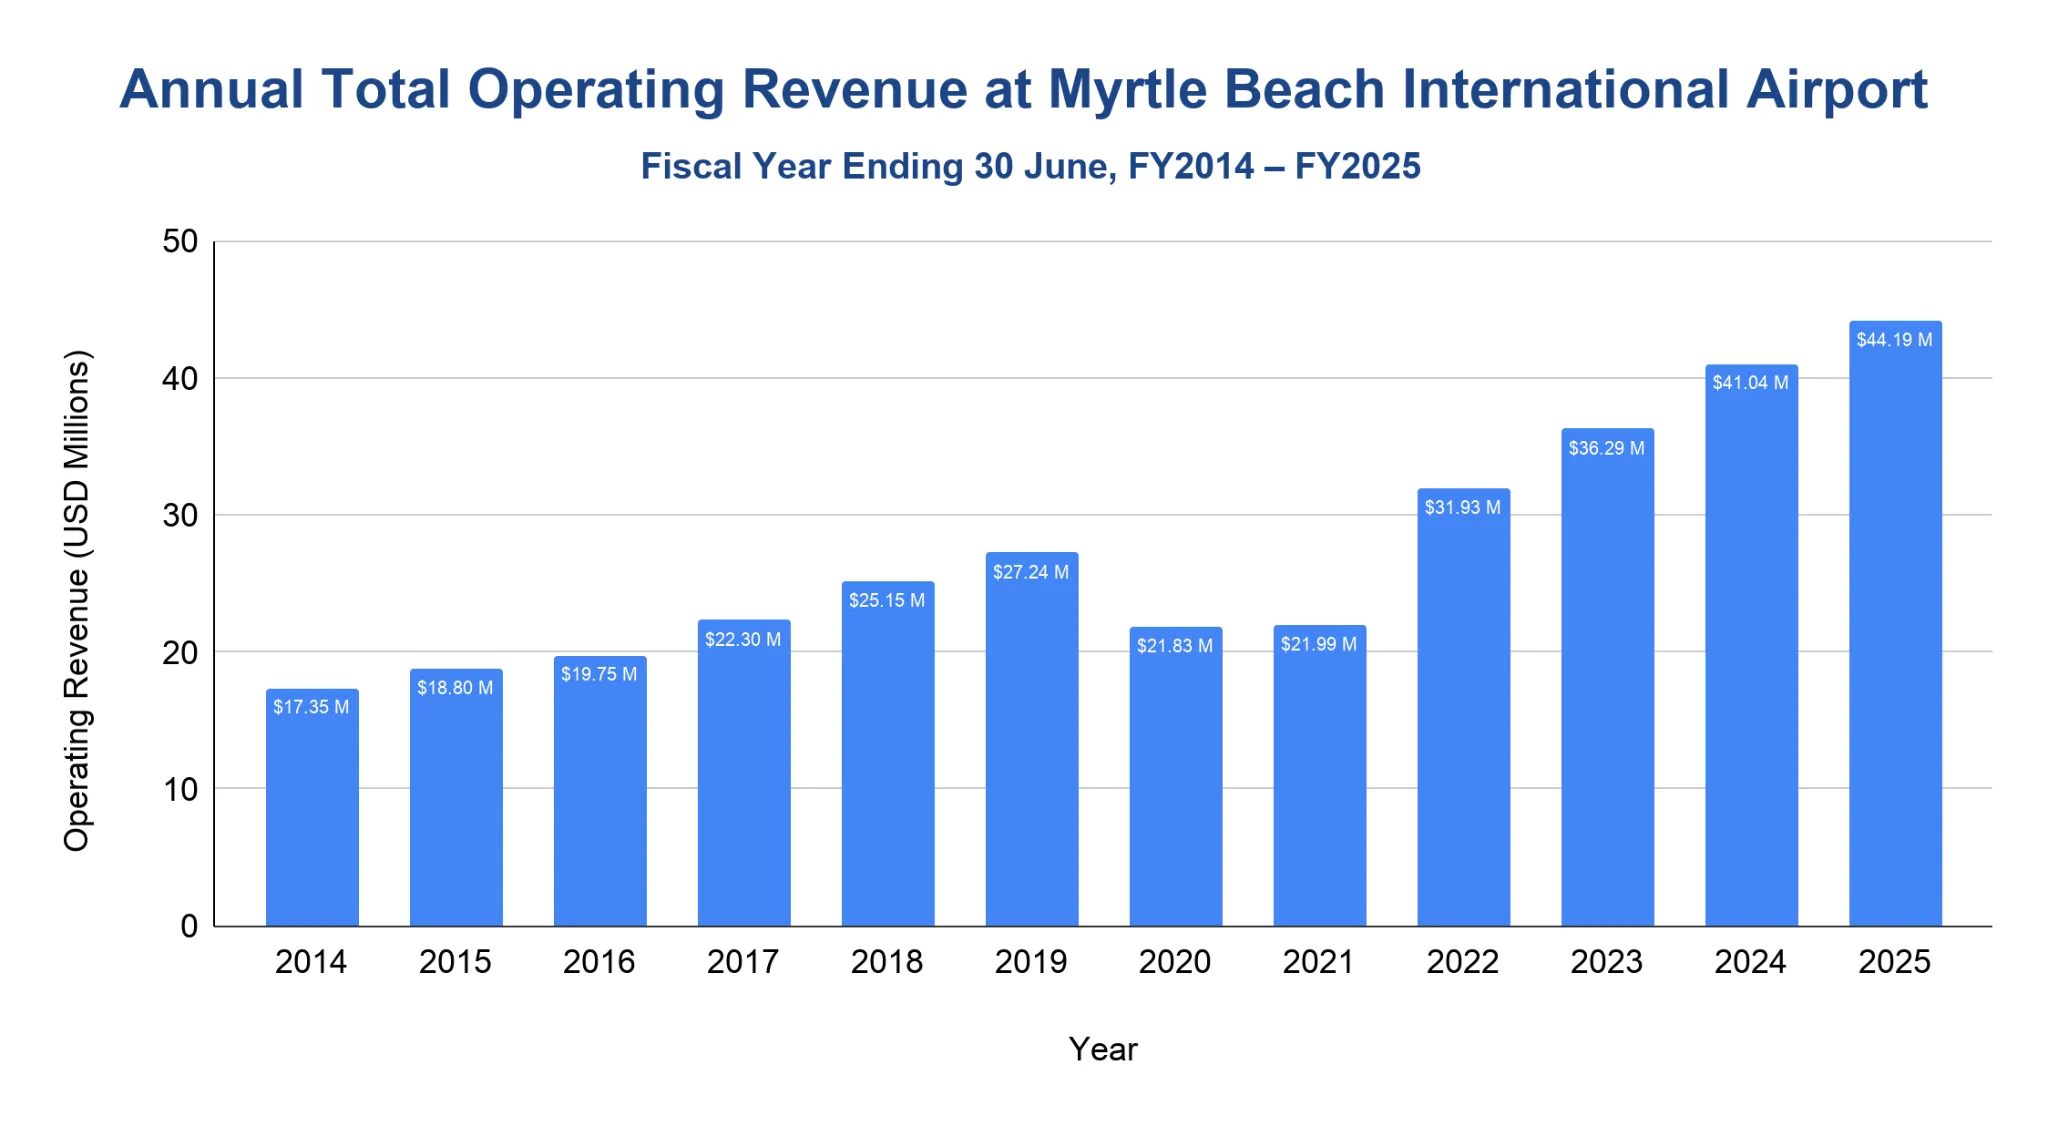
MYR generated $44.19 million in Federal Aviation Administration Form 127 revenue in fiscal year 2025 (FY2025), up 7.7% from FY2024 and 62.2% above FY2019.
- Revenue rose from $17.35 million in FY2014 to $27.24 million in FY2019, a 57% pre-pandemic increase.
- Revenue fell to $21.83 million in FY2020, then stayed nearly flat at $21.99 million in FY2021.
- The recovery accelerated in FY2022, when revenue reached $31.93 million.
- MYR passed $36 million in FY2023 and $41 million in FY2024.
- By FY2025, revenue had reached $44.19 million, the highest figure in the series.
Note: FAA Certification Activity Tracking System (CATS) Form 127 figures are reported by fiscal year ending June 30. Percentage changes are calculated from full raw dollar values, while the table shows revenue in millions for readability.
Myrtle Beach International Airport's On-time Performance
For May 2025–April 2026, 74% of MYR's major-carrier domestic departures and 74% of arrivals were on time.
- MYR's on-time departure rate held at 80% in 2021 and 2022, improved to 83% in 2023, then slipped to 80% in 2024.
- The departure on-time rate fell further to 76% in 2025 and 74% in the May 2025–April 2026 reporting period.
- Arrival punctuality followed a similar pattern, moving from 80% in 2021 to 78% in 2024, 75% in 2025 and 74% in the latest rolling period.
- Among delayed flights, average departure delay reached 88.14 minutes in the May 2025–April 2026 period, while average arrival delay was 68.91 minutes.
- The cancellation rate was 1.86% in the latest rolling period, lower than 2.24% in 2025 and 2.04% in 2024.
| Metric | 2021 | 2022 | 2023 | 2024 | 2025 | 2026* |
|---|---|---|---|---|---|---|
| On-Time Departures | 80% | 80% | 83% | 80% | 76% | 74% |
| On-Time Arrivals | 80% | 78% | 80% | 78% | 75% | 74% |
| Avg Departure Delay (min.) | 72.31 | 71.13 | 83.12 | 80.07 | 88.01 | 88.14 |
| Avg Arrival Delay (min.) | 63.38 | 63.26 | 65.78 | 67.81 | 68.63 | 68.91 |
| Cancelled | 2.44% | 2.75% | 1.61% | 2.04% | 2.24% | 1.86% |
| Flights (Thousands) | 16.2 | 16.4 | 14.4 | 16.0 | 14.5 | 10.9 |
| Reporting Carriers | 13 | 13 | 11 | 12 | 11 | 11 |
Source · Note: Bureau of Transportation Statistics defines delayed flights as those arriving or departing 15 or more minutes from schedule. Average delay minutes are calculated from delayed flights only. BTS publishes average delays in decimal-minute format, so the values are kept exactly as reported. The 2026* column refers to May 2025–April 2026.
Related Travel Statistics
- Appleton International Airport Statistics
- Atlantic City International Airport Statistics
- Eastern Iowa Airport Statistics
- Fresno Yosemite International Airport Statistics
- Grand Rapids Airport (GRR) Statistics
- Greenville–Spartanburg Airport Statistics
- Houston Hobby Airport Statistics
- Idaho Falls Regional Airport Statistics
- Tweed–New Haven Airport (HVN) Statistics
- Oakland Airport (OAK) Statistics
- Rapid City Regional Airport Statistics
- Rochester Airport (ROC) Statistics
Major Expansion Projects at Myrtle Beach International Airport
MYR's official development materials identify a 45,000-square-foot Concourse A terminal expansion with six new gates and potential for a seventh.
- The Horry County Department of Airports described the Concourse A project as a terminal expansion at MYR.
- The expansion extends the west end of the existing Concourse A building.
- The project is designed to accommodate six new gates, with potential for a seventh.
- MYR also maintains a 20-year Master Plan to guide airport development and future improvements.
- The Master Plan is the Federal Aviation Administration-required strategy document for airport development timing and facility needs.
How does Myrtle Beach International Airport rank nationally?
The Federal Aviation Administration ranked MYR 79th among United States commercial service airports by 2024 passenger boardings.
- MYR recorded 1,894,929 passenger boardings in 2024, up 14.2% from 2023.
- The Federal Aviation Administration lists MYR as a primary airport with a small-hub classification.
- In South Carolina, Charleston ranked ahead of MYR, while Greenville-Spartanburg and Columbia ranked below MYR by 2024 passenger boardings.
- MYR's 2025 total airport traffic was 3.53 million passengers, but Federal Aviation Administration commercial-service rankings use passenger boardings, not total arriving-and-departing passengers.
- The airport remains a high-volume leisure airport without being classified as a large or medium hub.
Note: Federal Aviation Administration rankings use enplanements, also called passenger boardings. MYR's airport-published total passenger traffic equals enplanements plus deplanements.
References
- FAA: MCO Aircraft Operations and Cargo Data · faa.gov
- MYR — Passenger, Airline, Route Map, Terminal Expansion and Master Plan Data (2016–2026) · flymyrtlebeach.com
- FAA OPSNET Airport Operations Standard Report (2014–2025) · aspm.faa.gov
- BTS Airline, Destination, Monthly Passenger, and On-Time Data (2021–2026) · transtats.bts.gov
- FAA CATS — total operating revenue data (2014–2025) · cats.airports.faa.gov

