

 Popular Countries
 24/7 Support
Published Sep 9, 2026
Located on the shore of San Francisco Bay in Oakland, California, San Francisco Bay Oakland International Airport (OAK) is operated by the Port of Oakland and serves as the main airport for the greater East Bay. The airport spans approximately 2,600 acres of aviation-related facilities and handled more than 9 million total passengers in the fiscal year 2024-2025.
How many passengers use Oakland International Airport each year?
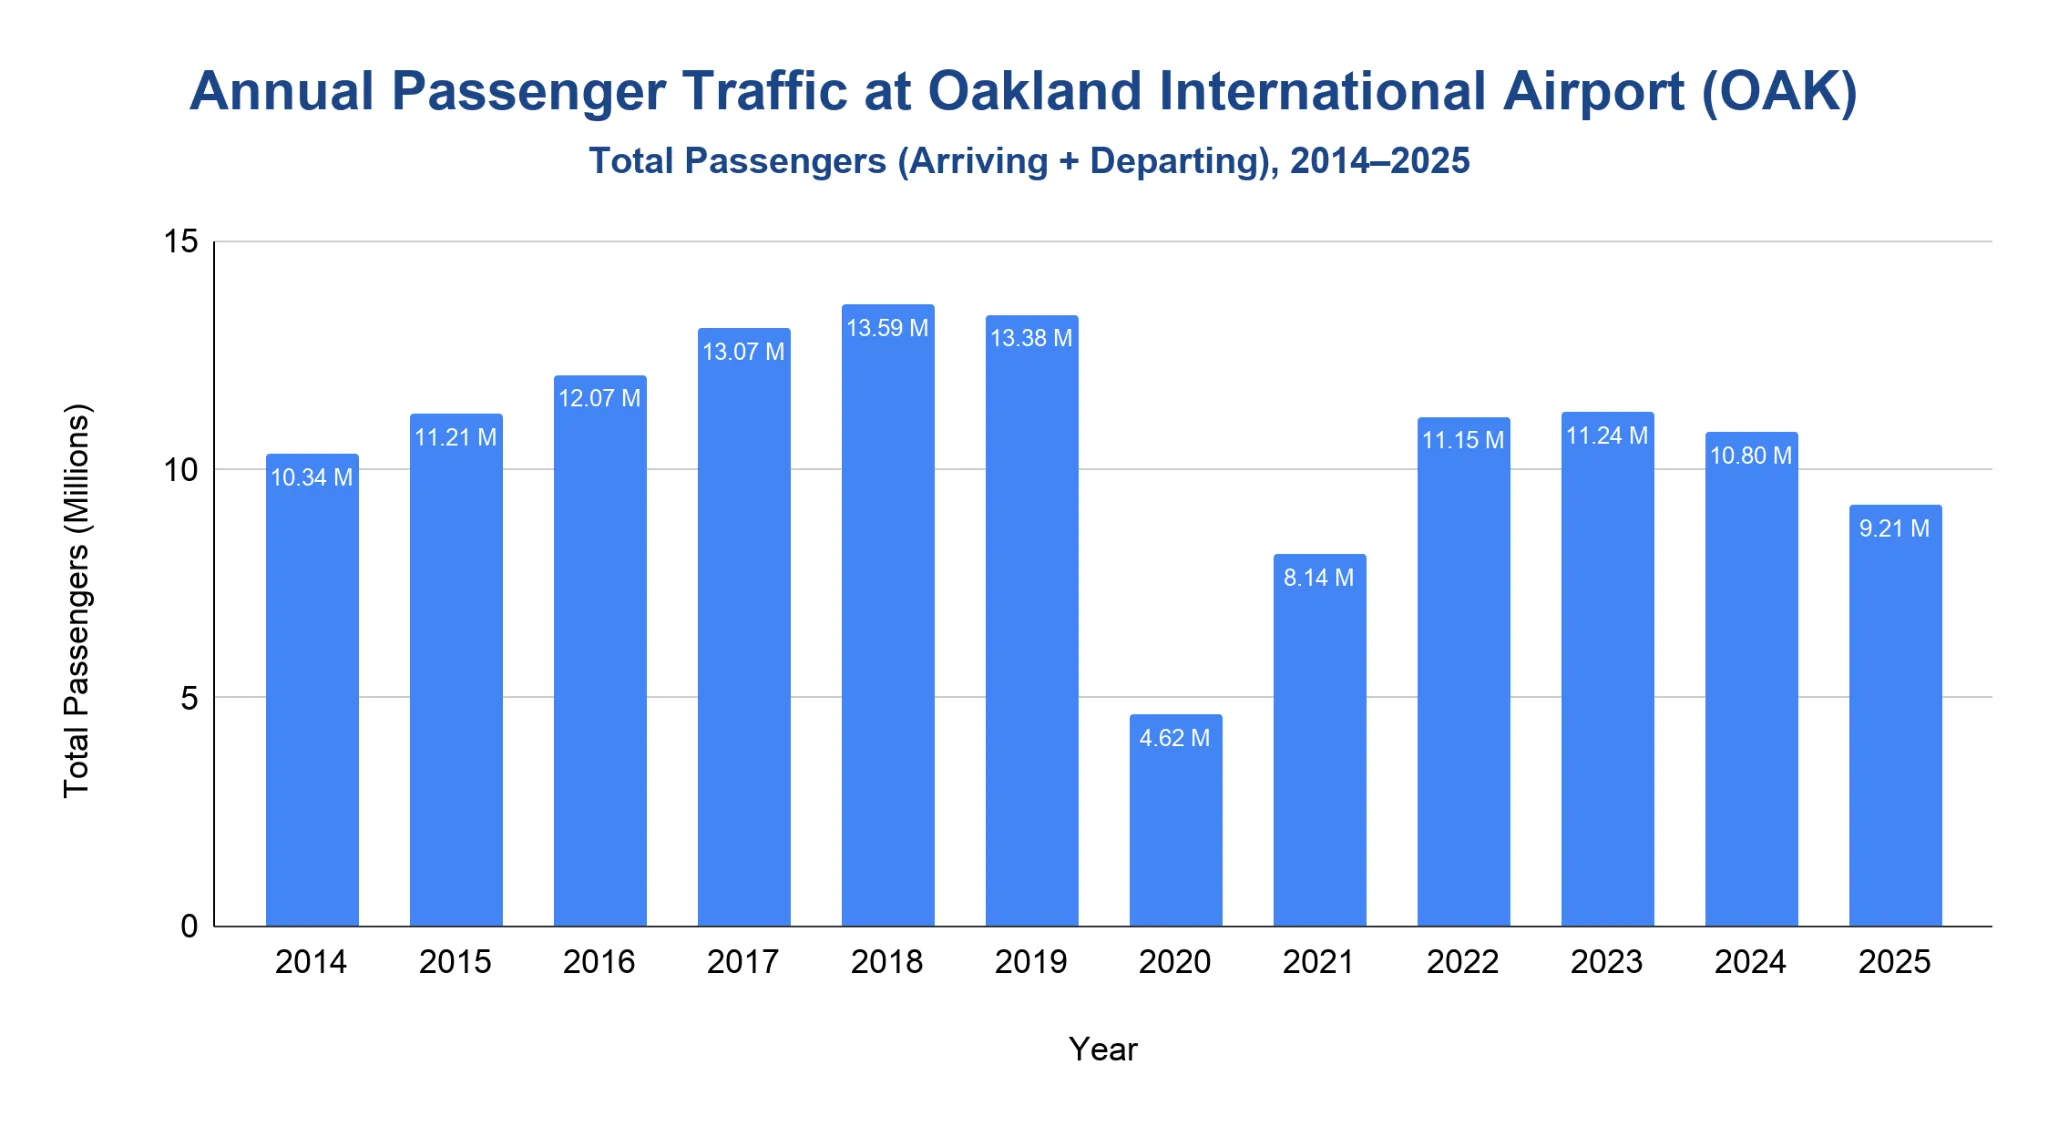
Oakland San Francisco Bay Airport handled 9.21 million total passengers in 2025, the latest full calendar year officially reported.
- From 2014 to 2018, total passenger traffic rose from 10.34 million to 13.59 million, a gain of 31.5% across the late-2010s growth period.
- Pre-pandemic traffic remained above 13 million in 2019, but eased to 13.38 million after the 2018 high.
- The pandemic year reset traffic sharply: 2020 fell to 4.62 million, down 65.5% from 2019.
- Recovery began with 8.14 million passengers in 2021 and reached 11.15 million in 2022.
- The post-pandemic plateau held near 11.24 million in 2023, then declined to 10.8 million in 2024 and 9.21 million in 2025.
Note: Total passengers means arriving plus departing passengers.
Does Oakland International Airport offer both domestic and international flights?
OAK handled 8.42 million domestic passengers and 791,825 international passengers in 2025, with domestic traffic making up 91.4% of total passenger activity.
- Domestic traffic accounted for most OAK passenger activity in 2025, at 8.42 million passengers.
- International traffic increased from 637,937 passengers in 2024 to 791,825 in 2025, up 24.1%.
- Domestic traffic declined from 10.17 million passengers in 2024 to 8.42 million in 2025, down 17.2%.
- Current published nonstop international service includes Mexico routes to Los Cabos/San José del Cabo, Monterrey, León/Guanajuato, Guadalajara, Mexico City and Morelia, plus El Salvador service to San Salvador.
| Metric | 2024 | 2025 | Change |
|---|---|---|---|
| Domestic passengers | 10,165,445 | 8,418,684 | -17.2% |
| International passengers | 637,937 | 791,825 | 24.1% |
| Total passengers | 10,803,382 | 9,210,509 | -14.7% |
| Domestic share of total passengers | 94.1% | 91.4% | -2.7 pts |
| International share of total passengers | 5.9% | 8.6% | 2.7 pts |
Source · Note: Domestic passengers are calculated as total passengers minus combined international enplaning and deplaning passengers. Total passengers include arriving and departing passengers.
How many aircraft operations does Oakland International Airport log each year?
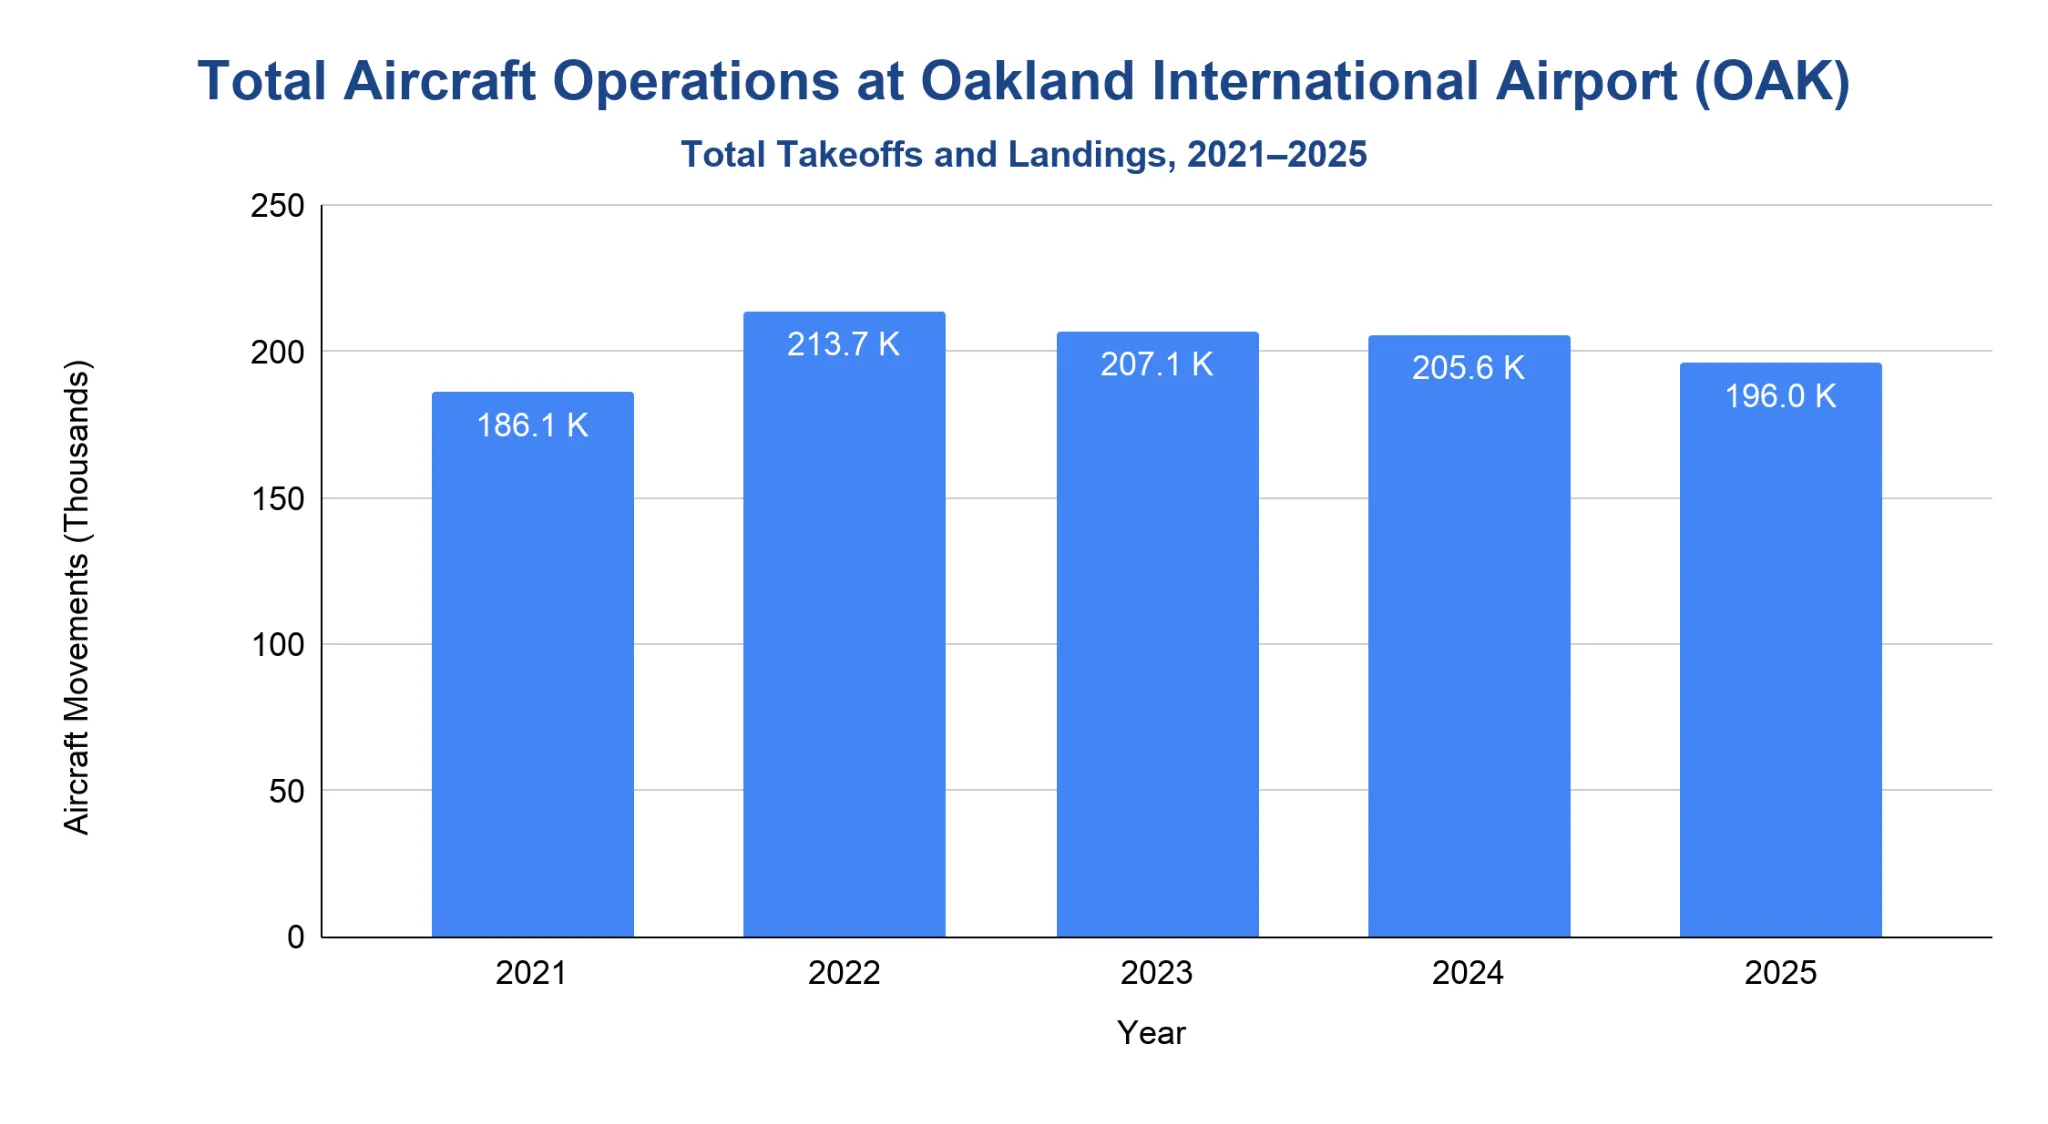
OAK logged 196,017 aircraft movements in 2025, down 4.7% from 2024.
- Post-pandemic movement totals rose from 186,095 in 2021 to 213,668 in 2022.
- A later revised annual summary placed 2023 at 207,101 movements, followed by 205,570 in 2024.
- The 2025 total of 196,017 kept operations below the 2022 recovery high.
- Commercial, cargo, air taxi and general aviation activity are included in the total movement count as reported by the airport.
Note: Aircraft movements count takeoffs and landings.
Which airlines operate the most flights at Oakland International Airport?
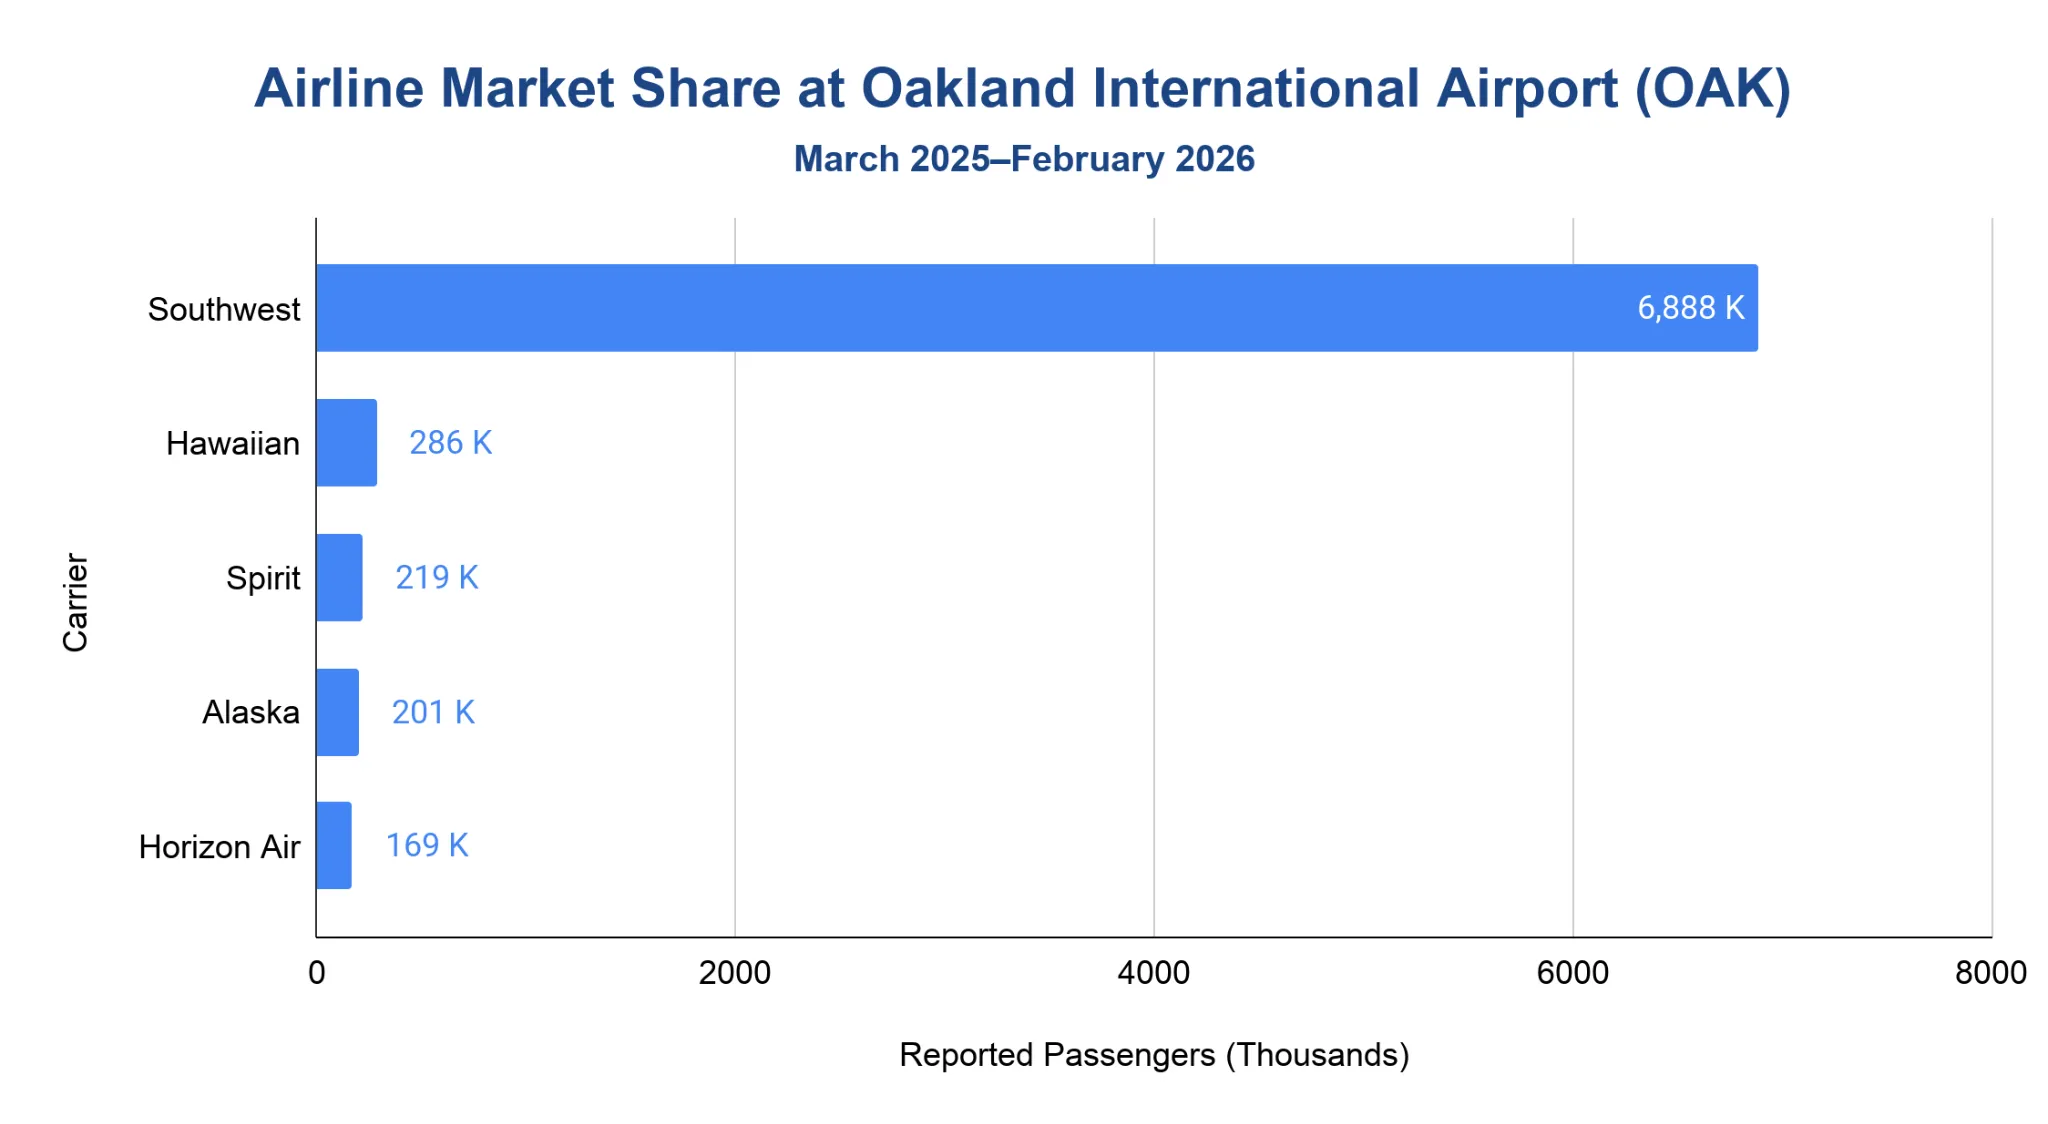
The latest Bureau of Transportation Statistics (BTS) airport profile shows Southwest carrying 6.89 million reported carrier passengers at OAK from March 2025 through February 2026, equal to 86.16% of the carrier-share total.
- Southwest was the dominant carrier in the BTS carrier-share table, with 6.89 million reported passengers.
- Hawaiian ranked second with 286,000 passengers, or 3.57% of the carrier-share total.
- Spirit followed with 219,000 passengers, ahead of Alaska with 201,000 and Horizon Air with 169,000.
- Together, the top 5 listed carriers carried 7.76 million reported passengers, while all other carriers combined accounted for 232,000 passengers.
- BTS listed 14 scheduled carriers at OAK for the latest 12-month period, unchanged from the prior 12-month period.
Note: The BTS airport profile ranks carriers by reported passenger share, not by flight count. Passenger figures in this table are shown in thousands and cover U.S. scheduled services from March 2025 through February 2026.
What are the busiest routes from Oakland International Airport?
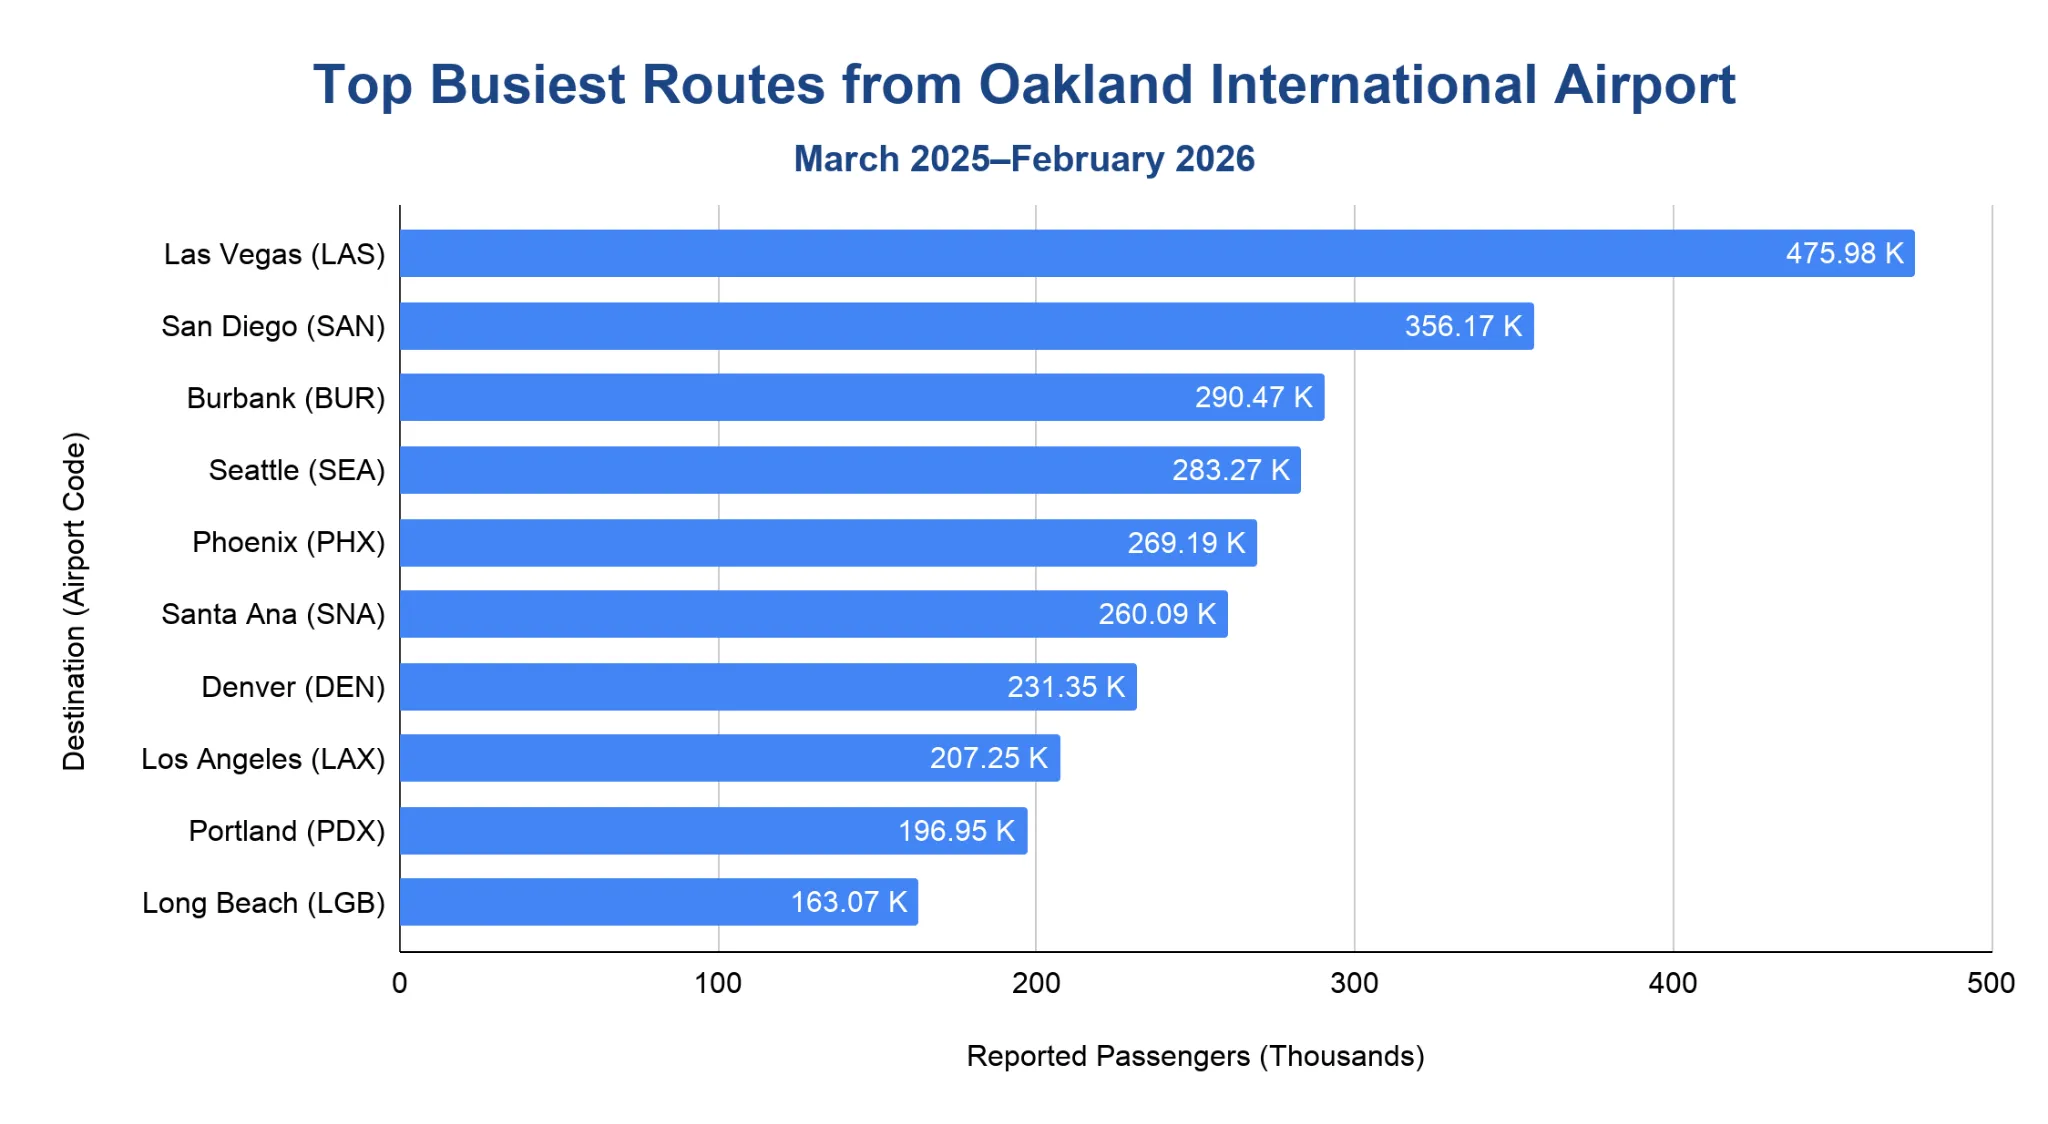
Las Vegas was OAK’s busiest U.S. destination from March 2025 through February 2026, with 475,980 reported passengers.
- San Diego ranked second with 356,170 passengers.
- Burbank followed with 290,470 passengers, ahead of Seattle at 283,270.
- Phoenix and Santa Ana both topped 260,000 passengers during the same period.
- The top 10 list is domestic-only and does not include international routes.
Note: The Bureau of Transportation Statistics (BTS) route table is U.S.-only and is based on T-100 Domestic Market data from U.S. carriers. BTS publishes the figures in thousands.
Peak Travel Months at Oakland International Airport
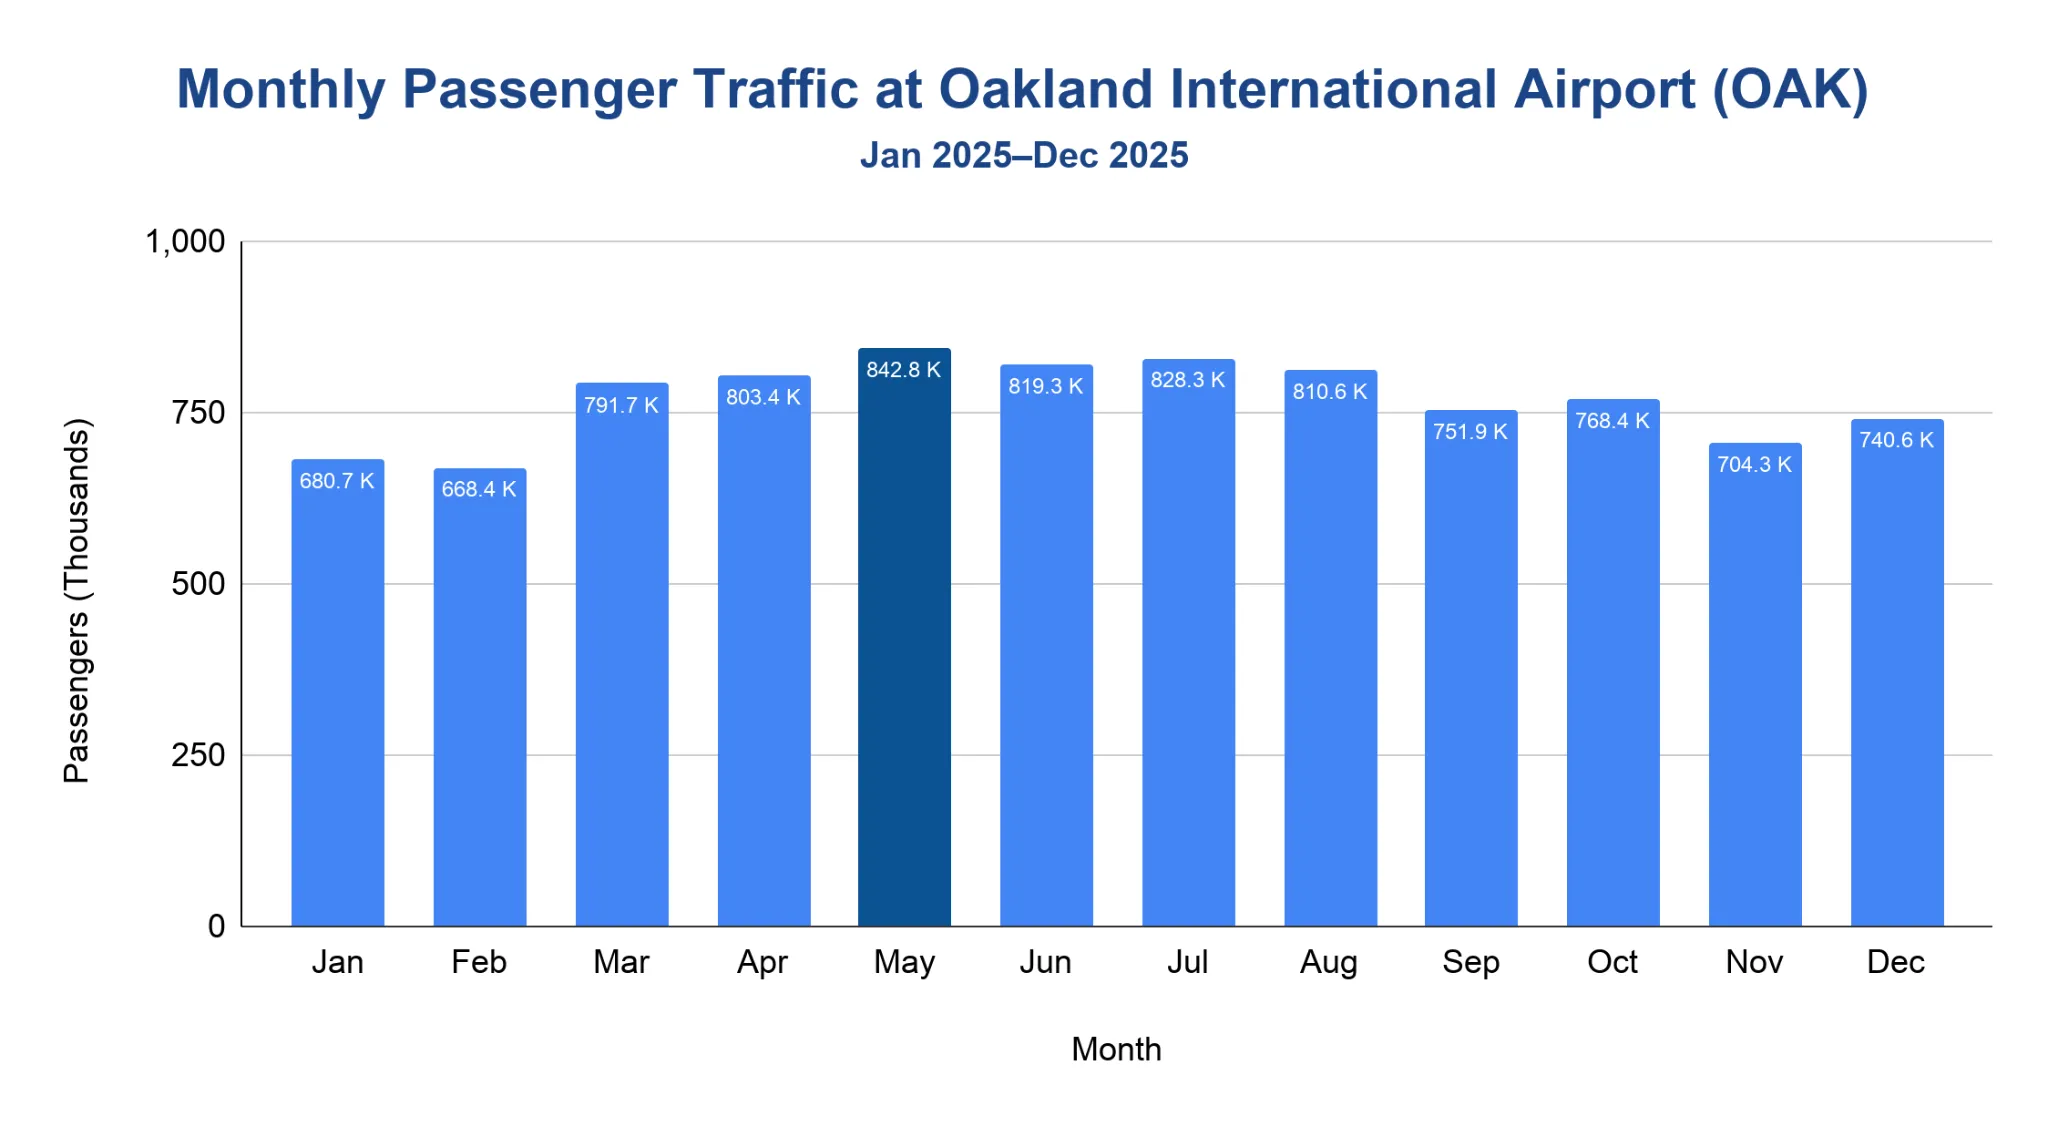
The busiest month in 2025 was May, when OAK served 842,792 total passengers.
- Spring travel was strongest in May, followed by July with 828,346 passengers and June with 819,333.
- Summer held above 810,000 passengers per month from June through August.
- February was the slowest month at 668,375 passengers.
- December finished at 740,588 passengers, below the summer peak but above the February low.
Note: Monthly totals use the same total passenger metric as the annual passenger table: arriving plus departing passengers.
How much cargo moves through Oakland International Airport each year?
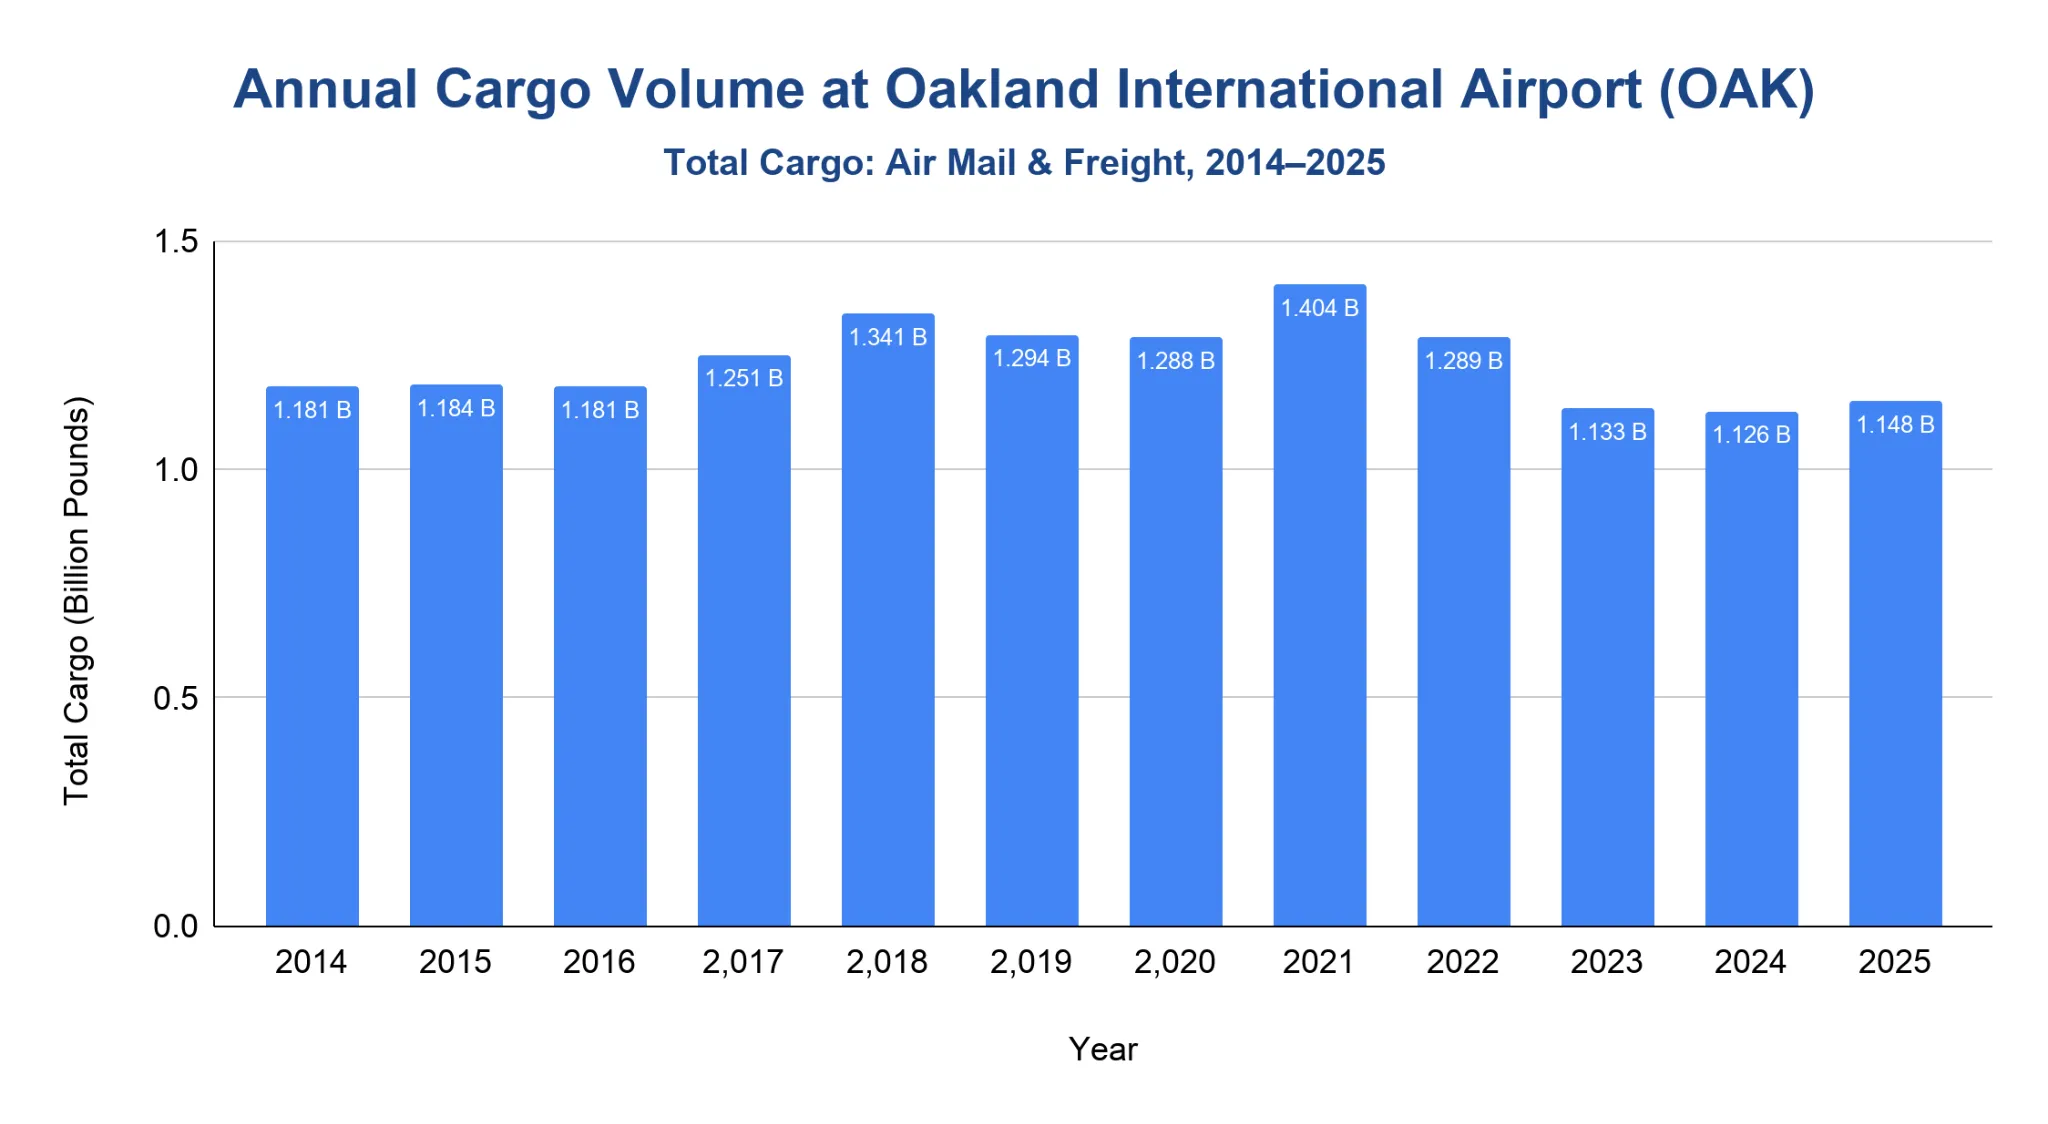
OAK handled 1.15 billion pounds of total cargo in 2025.
- From 2014 to 2018, total cargo rose from 1.18 billion pounds to 1.34 billion, a gain of 13.6%.
- Pre-pandemic cargo eased to 1.29 billion pounds in 2019.
- During the pandemic period, cargo stayed near 1.29 billion pounds in 2020 before rising to 1.4 billion in 2021.
- Post-pandemic cargo declined to 1.29 billion pounds in 2022 and 1.13 billion in 2023, then held near that level in 2024 and rose to 1.15 billion in 2025.
Note: OAK reports total cargo as air mail plus freight in thousands of pounds. For better readability, the values are converted to billion pounds.
How much revenue does Oakland International Airport generate annually?
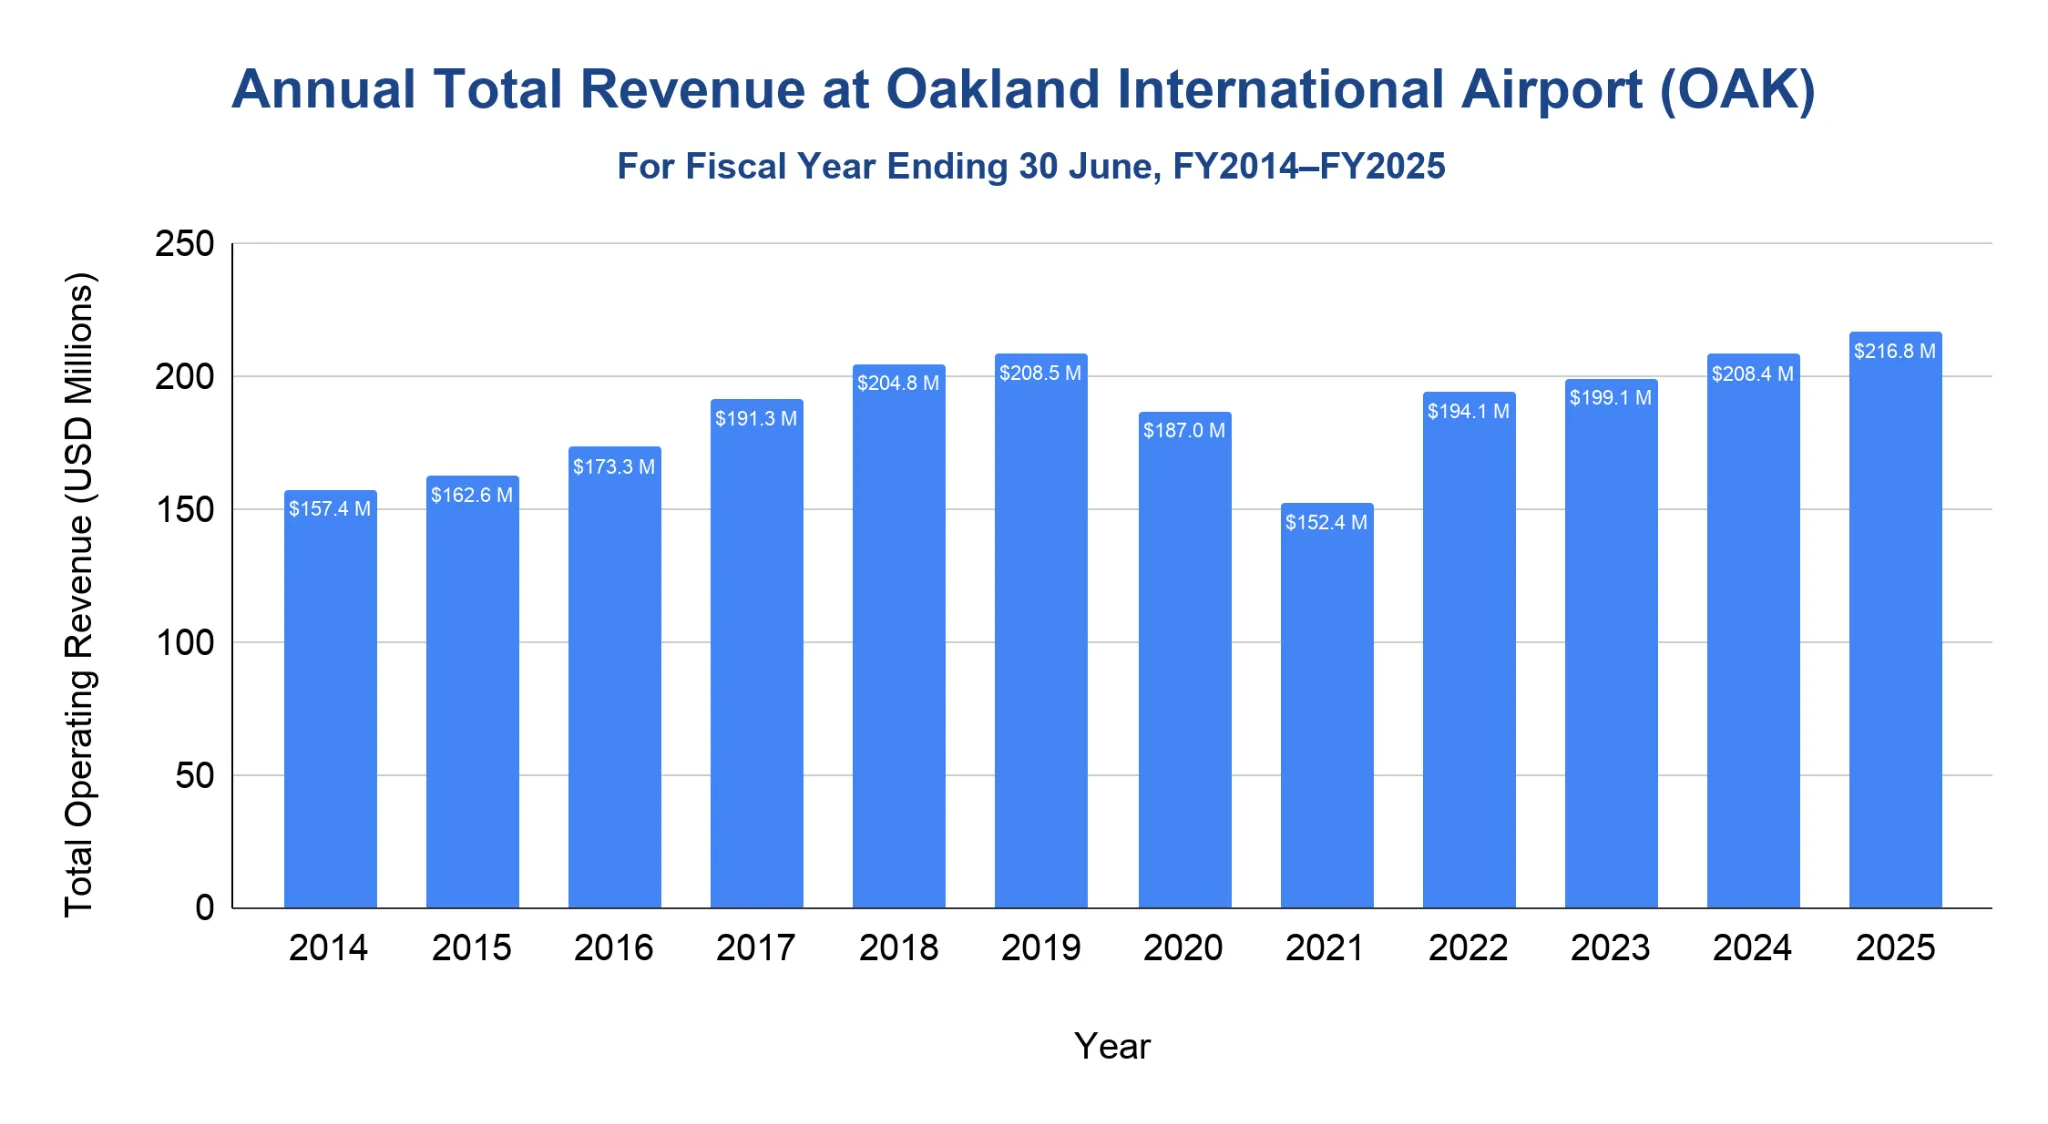
OAK reported $216.82 million in total operating revenue for fiscal year 2025.
- From 2014 to 2018, total operating revenue increased from $157.38 million to $204.78 million, a gain of 30.1%.
- Pre-pandemic revenue reached $208.53 million in 2019.
- Pandemic-era revenue fell to $186.97 million in 2020 and $152.4 million in 2021.
- The recovery began in 2022 with $194.1 million, then continued to $199.15 million in 2023, $208.36 million in 2024, and $216.82 million in 2025.
Note: Federal Aviation Administration (FAA) Form 127 reports OAK revenue by fiscal year. OAK’s fiscal year ends on June 30.
What is Oakland International Airport’s on-time performance?
OAK’s domestic flights were 78% on time at departure and 80% on time at arrival from March 2025 through February 2026.
- Departure on-time performance moved from 80% in 2024 to 79% in 2025, then 78% in the latest rolling period.
- Arrival on-time performance held at 81% in 2024 and 2025, before easing to 80% in the latest rolling period.
- Average delay for delayed departing flights was 51.51 minutes in the latest rolling period.
- The cancellation rate was 0.62%, lower than 0.64% in 2025 and 0.69% in 2024.
| Metric | 2021 | 2022 | 2023 | 2024 | 2025 | 2026* |
|---|---|---|---|---|---|---|
| Departure on-time % | 78% | 75% | 77% | 80% | 79% | 78% |
| Arrival on-time % | 80% | 78% | 79% | 81% | 81% | 80% |
| Avg departure delay (min.) | 50.37 | 48.41 | 48.40 | 49.68 | 51.12 | 51.51 |
| Avg arrival delay (min.) | 51.51 | 50.61 | 49.10 | 51.60 | 52.51 | 52.51 |
| Cancelled flights % | 1.51% | 2.02% | 0.87% | 0.69% | 0.64% | 0.62% |
| Flights (000) | 35.3 | 47.7 | 46.0 | 41.4 | 34.6 | 29.1 |
| Reporting carriers | 9 | 9 | 8 | 7 | 7 | 4 |
Source · Note: BTS counts a flight as delayed when it arrives or departs 15 minutes or more after schedule. Average delay minutes are calculated from delayed flights only. *2026 covers March 2025 through February 2026. BTS publishes average delays in decimal-minute format. As such, the values have been kept exactly as reported to avoid altering the underlying data.
Related Travel Statistics
- Aspen/Pitkin County Airport Statistics
- St. Pete-Clearwater Airport Statistics
- Colorado Springs Airport Statistics
- Dallas Fort Worth Airport Statistics
- El Paso International Airport (ELP) Statistics
- Flagstaff Pulliam Airport Statistics
- Grand Junction Regional Airport (GJT) Statistics
- Greenville–Spartanburg Airport Statistics
- Atlanta Airport (ATL) Statistics
- Los Angeles International Airport Statistics
- Santa Barbara Municipal Airport Statistics
- Worcester Regional Airport (ORH) Statistics
How does Oakland International Airport rank nationally and globally?
The Federal Aviation Administration (FAA) ranked OAK 45th among U.S. commercial service airports by 2024 passenger boardings and 13th among U.S. all-cargo airports by landed weight.
- OAK recorded 5.29 million passenger boardings in 2024, down 4.13% from 2023.
- By FAA hub category, OAK was a medium-hub primary airport in 2024.
- In cargo, OAK ranked much higher nationally, placing 13th by all-cargo landed weight.
- OAK’s 2024 all-cargo landed weight was 3.21 billion pounds, down 3.46% from 2023.
Note: FAA airport ranking tables are U.S. national rankings. They do not provide a global airport rank for OAK, so no global ranking is stated here.
References
- Oakland International Airport — airport facts, passenger, cargo, aircraft movement and route data (2014–2025) · iflyoak.com
- BTS Airline, Destination, Monthly Passenger, and On-Time Data (2021–2026) · transtats.bts.gov
- FAA CATS — total operating revenue data (2014–2025) · cats.airports.faa.gov
- FAA Passenger Boarding and All-Cargo Data Master · faa.gov

