

 Popular Countries
 24/7 Support
Published Sep 9, 2026
Grand Junction Regional Airport (GJT) is a regional airport in Mesa County, Colorado, serving Grand Junction and the wider Western Slope. The airport connects local travelers with major U.S. hub airports and supports commercial, general aviation and regional access for western Colorado.
How many passengers board flights at Grand Junction Regional Airport each year?
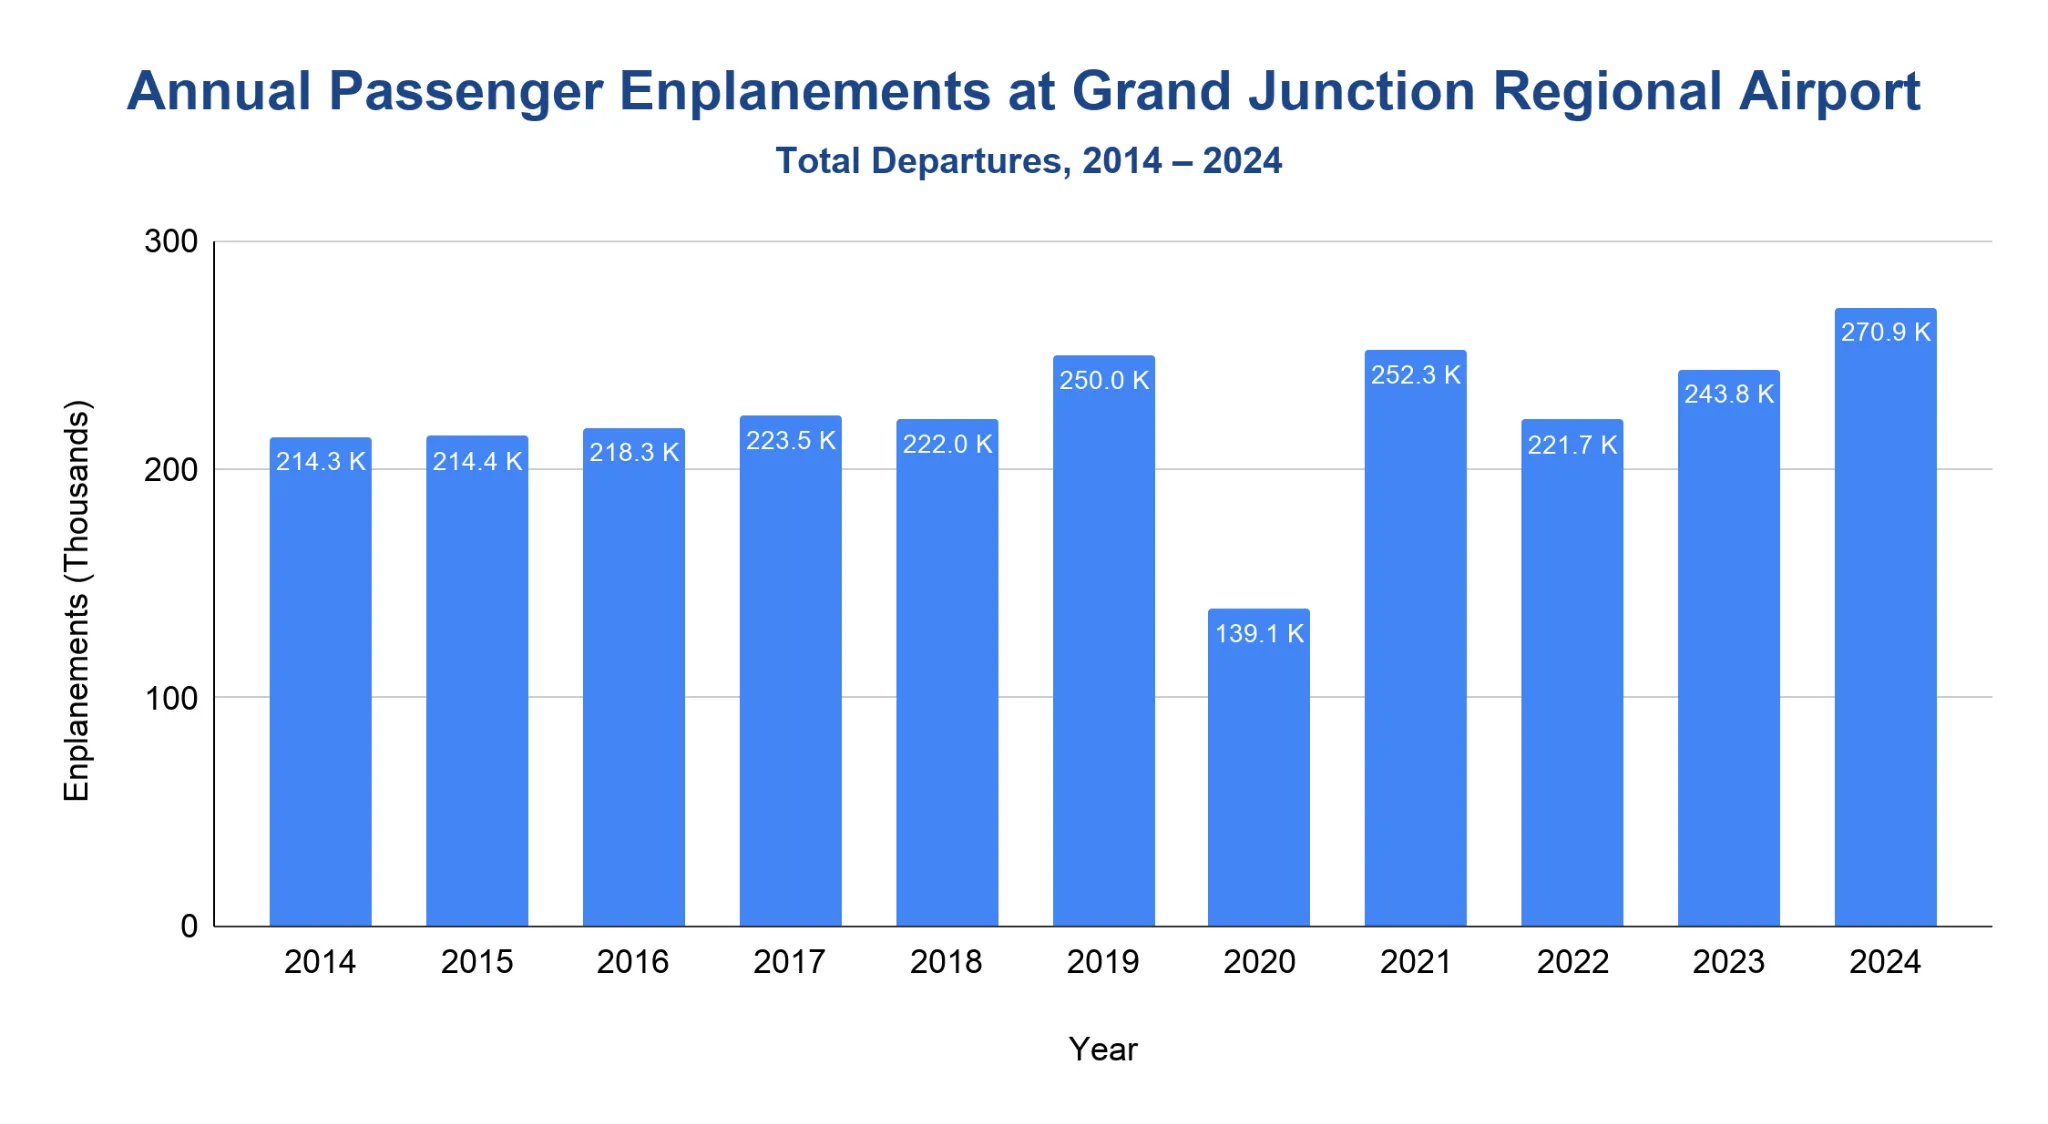
GJT recorded 270,935 FAA-reported passenger boardings in 2024, up 11.13% from 2023.
- From 2014 through 2018, official passenger boardings stayed close to 214 thousand to 224 thousand a year.
- Traffic climbed to 250,016 boardings in 2019, then fell to 139,140 in 2020 during pandemic disruption.
- Passenger boardings rebounded to 252,290 in 2021, dipped to 221,682 in 2022, and then rose in 2023 and 2024.
Note: FAA passenger boardings are enplanements, meaning departing passengers only. Where this article uses standardized table units such as thousands or USD million, percentage changes are calculated from the full source values rather than rounded table values.
Does Grand Junction Regional Airport handle domestic and international flights?
GJT’s current published nonstop network is domestic, with FlyGJT listing 6 U.S. nonstop destinations.
- Official FlyGJT route information lists nonstop service to Denver, Dallas, Las Vegas, Phoenix, Salt Lake City, and Orange County.
- Delta’s Salt Lake City service returned on 3 December 2024, restoring nonstop connectivity between GJT and Salt Lake City International Airport.
- The airport’s official air-service materials describe these routes as links into larger U.S. hub networks.
- No scheduled international nonstop routes appear in the current public nonstop destination set.
Note: Nonstop domestic service can still provide one-stop international connections through hub airports.
How many itinerant aircraft operations occur at Grand Junction Regional Airport each year?
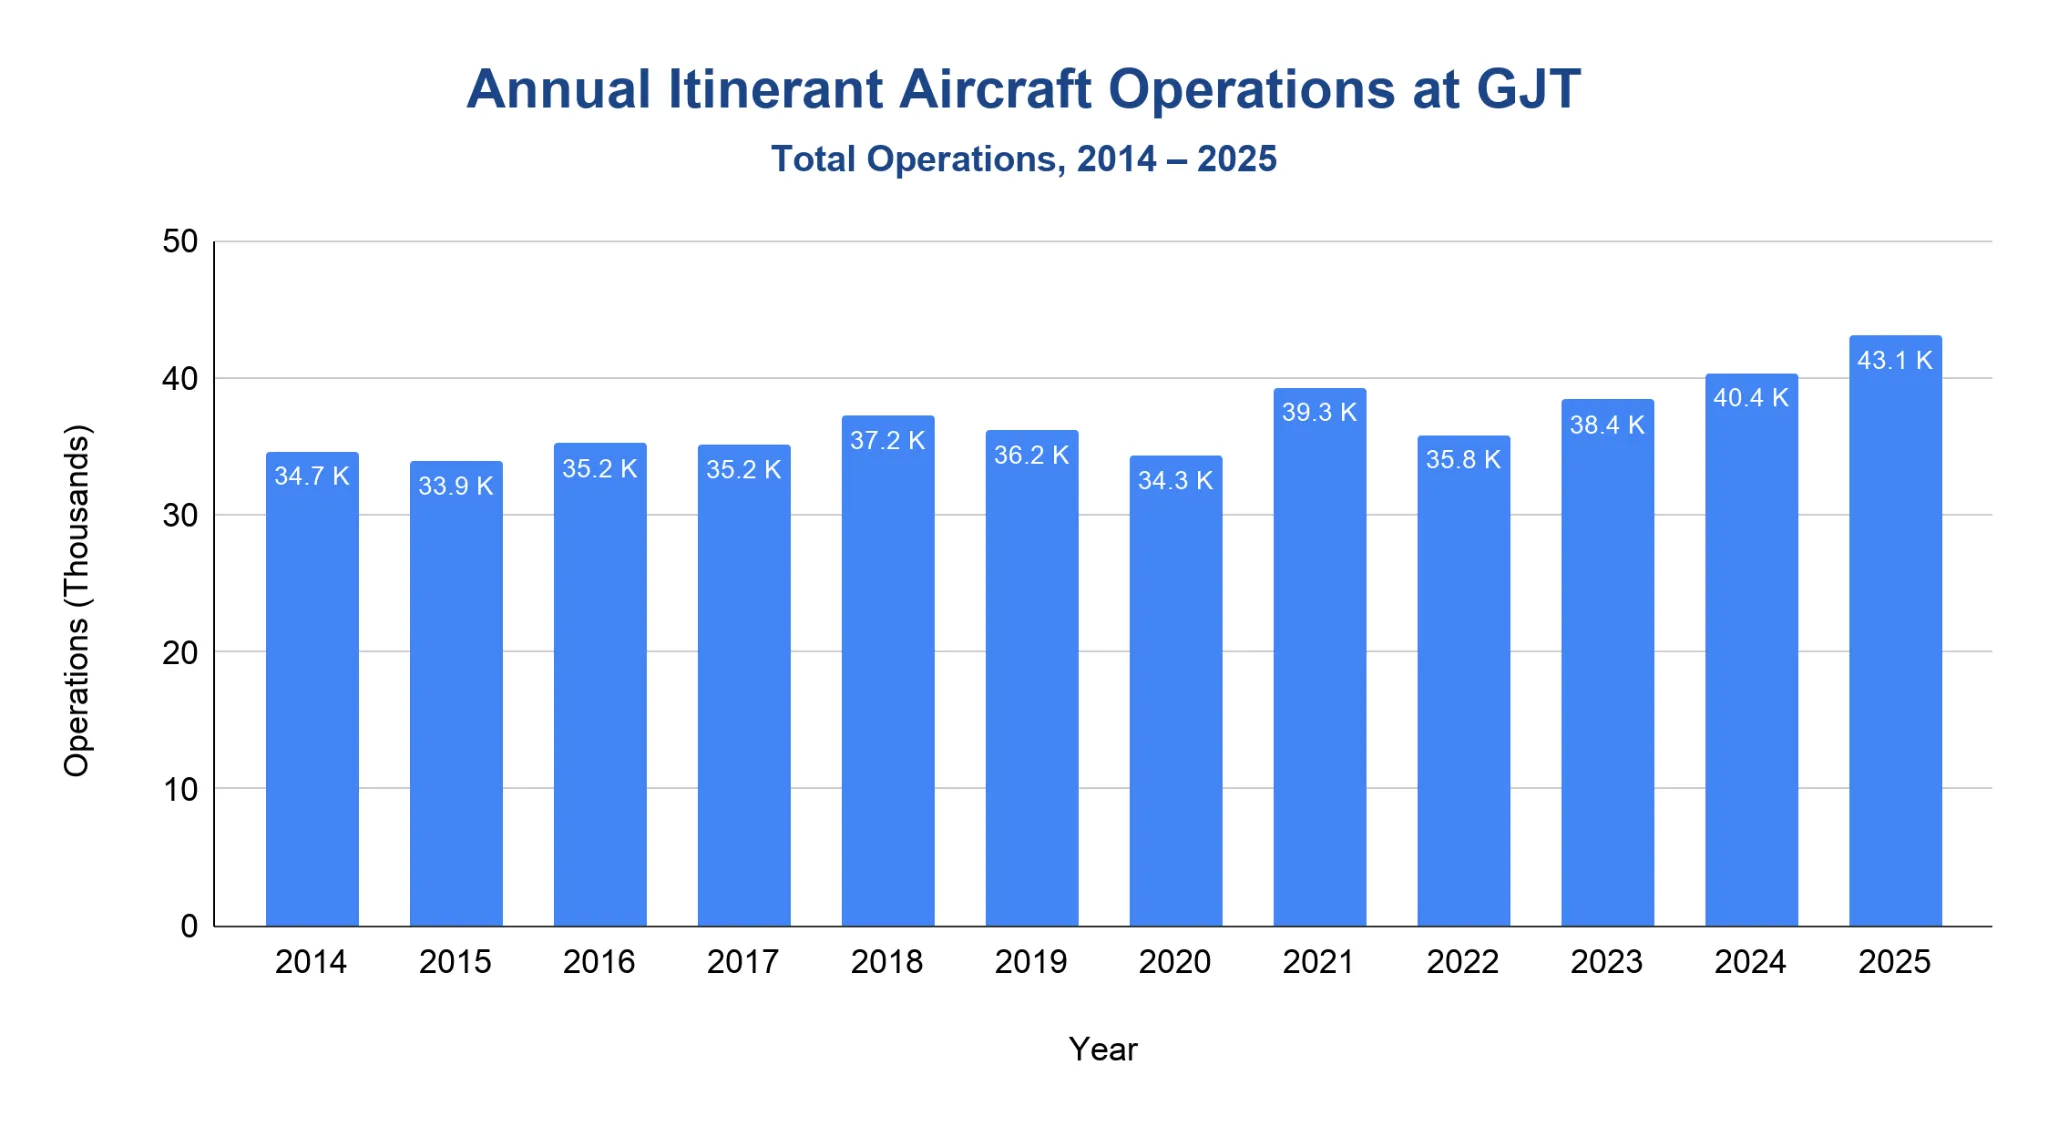
GJT recorded 43,146 itinerant aircraft operations in 2025, the highest full-year total in the 2014–2025 Operations Network (OPSNET) series.
- From 2014 through 2018, itinerant operations stayed mostly in the mid-30,000s, ranging from 33,927 in 2015 to 37,242 in 2018.
- Pre-pandemic activity stood at 36,209 itinerant operations in 2019, before dipping to 34,326 in 2020.
- Traffic rebounded to 39,306 itinerant operations in 2021, then eased to 35,849 in 2022.
- Post-pandemic growth resumed after that, rising to 38,388 in 2023, 40,379 in 2024, and 43,146 in 2025.
- General aviation remained the largest category in 2025, with 28,613 itinerant operations, followed by 7,613 air carrier operations and 5,835 air taxi operations.
- As of April 2026, OPSNET had recorded 12,423 itinerant operations at GJT.
| Itinerant Aircraft Operations by Type at GJT (2014–2026*) | |||||
|---|---|---|---|---|---|
| Year | Air Carrier | Air Taxi | General Aviation | Military | Total |
| 2014 | 3,232 | 12,246 | 17,604 | 1,573 | 34,655 |
| 2015 | 3,069 | 11,547 | 17,060 | 2,251 | 33,927 |
| 2016 | 2,743 | 12,113 | 18,461 | 1,891 | 35,208 |
| 2017 | 5,391 | 9,082 | 19,091 | 1,606 | 35,170 |
| 2018 | 4,921 | 9,309 | 21,326 | 1,686 | 37,242 |
| 2019 | 6,381 | 8,998 | 19,160 | 1,670 | 36,209 |
| 2020 | 4,929 | 6,935 | 21,425 | 1,037 | 34,326 |
| 2021 | 6,618 | 8,252 | 23,040 | 1,396 | 39,306 |
| 2022 | 6,408 | 6,483 | 21,576 | 1,382 | 35,849 |
| 2023 | 7,043 | 5,628 | 24,087 | 1,630 | 38,388 |
| 2024 | 7,441 | 5,808 | 25,708 | 1,422 | 40,379 |
| 2025 | 7,613 | 5,835 | 28,613 | 1,085 | 43,146 |
| 2026 | 2,926 | 2,029 | 7,054 | 414 | 12,423 |
Source · This section uses itinerant operations only. Itinerant operations refer to activities, services, or movements that travel from place to place rather than operating from a single, fixed location. The 2026 figure is partial-year data through April.
What are the busiest destinations from Grand Junction Regional Airport?
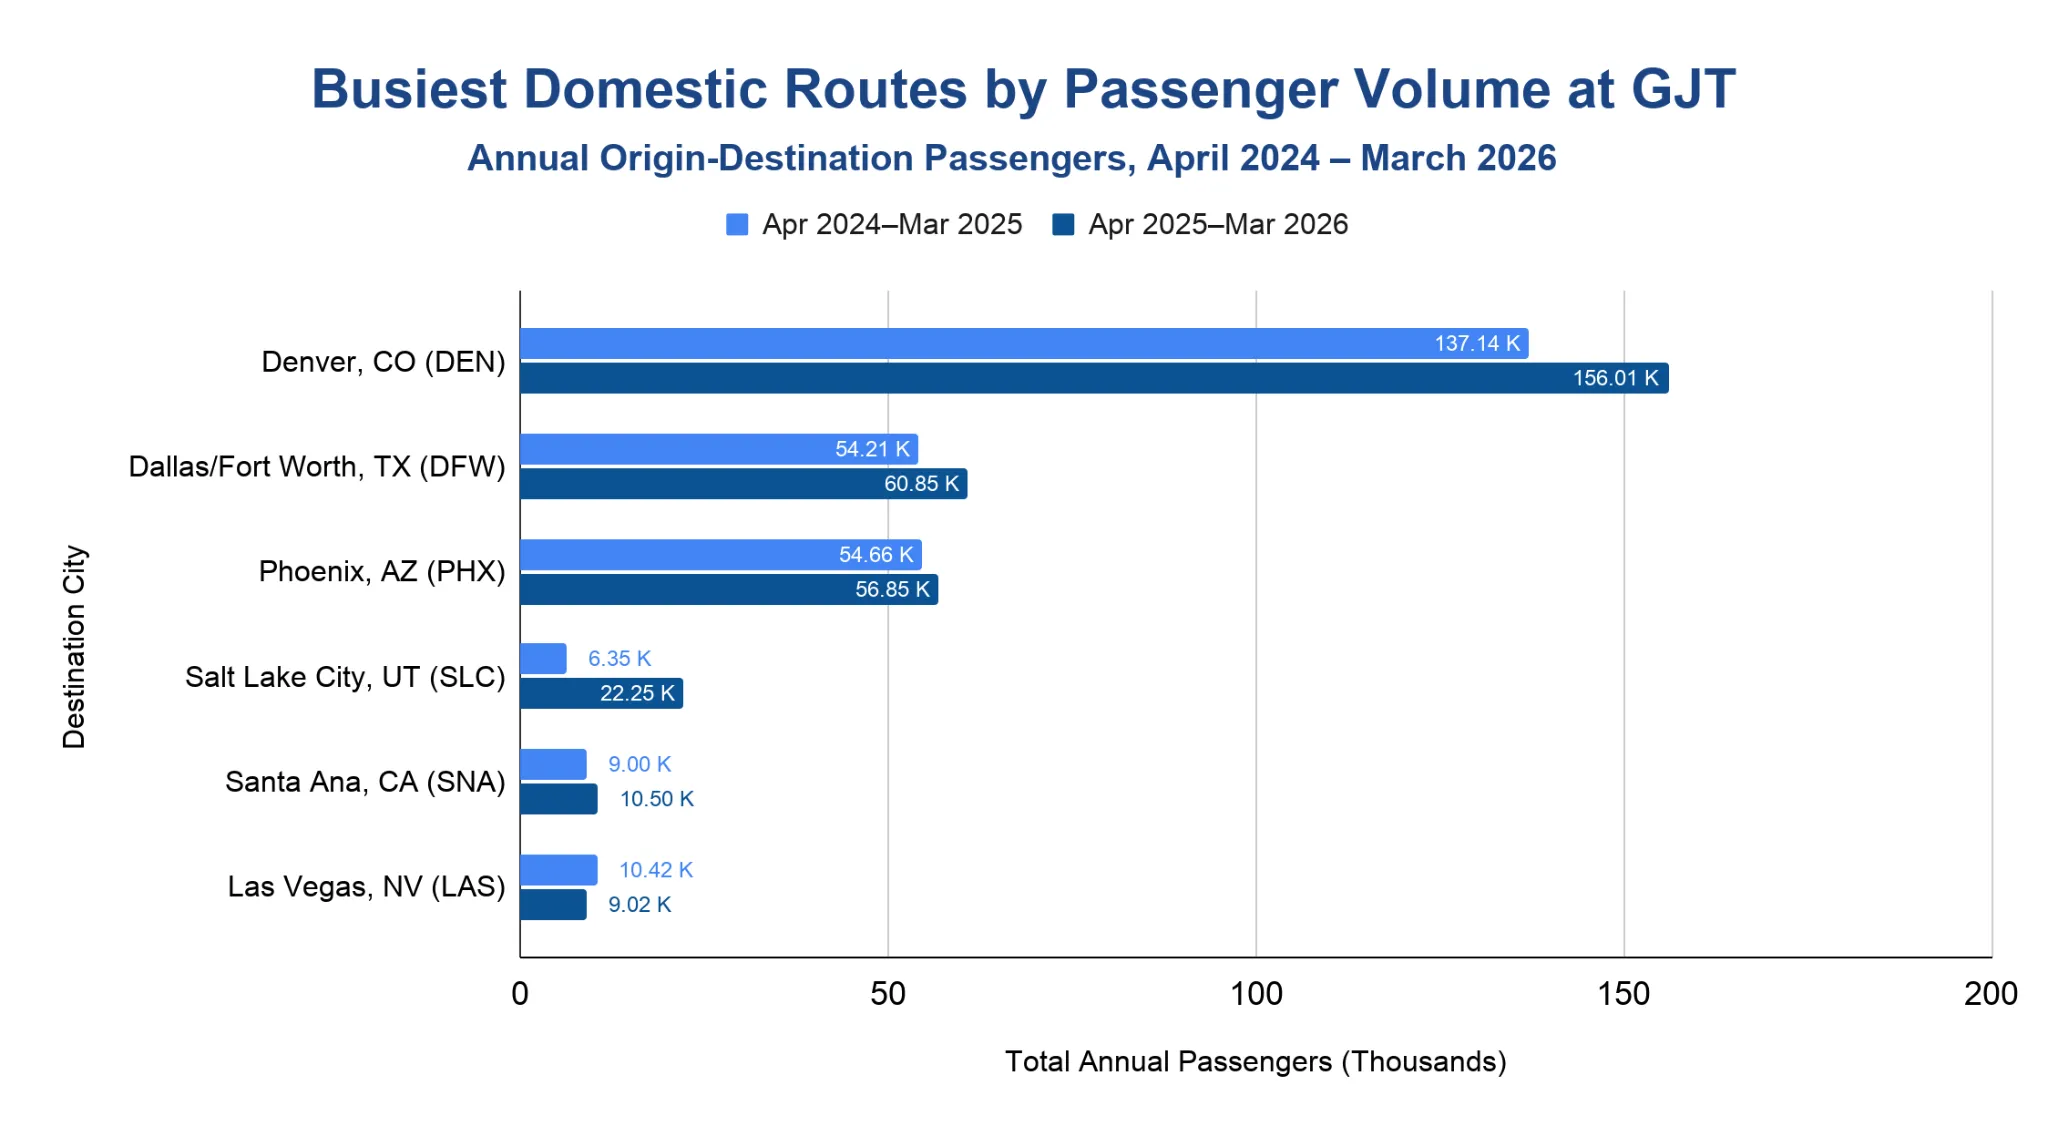
Denver was GJT’s busiest U.S. destination airport, with 156,010 passengers in the April 2025 to March 2026 period.
- Denver remained the largest destination from GJT, rising from 137,140 passengers in April 2024–March 2025 to 156,010 in April 2025 to March 2026.
- Dallas/Fort Worth ranked second with 60,850 passengers, ahead of Phoenix at 56,850.
- Salt Lake City traffic rose sharply, from 6,350 passengers to 22,250, following the return of Delta’s GJT–Salt Lake City service.
- Santa Ana/Orange County carried 10,500 passengers, while Las Vegas handled 9,020.
Peak Travel Months at Grand Junction Regional Airport
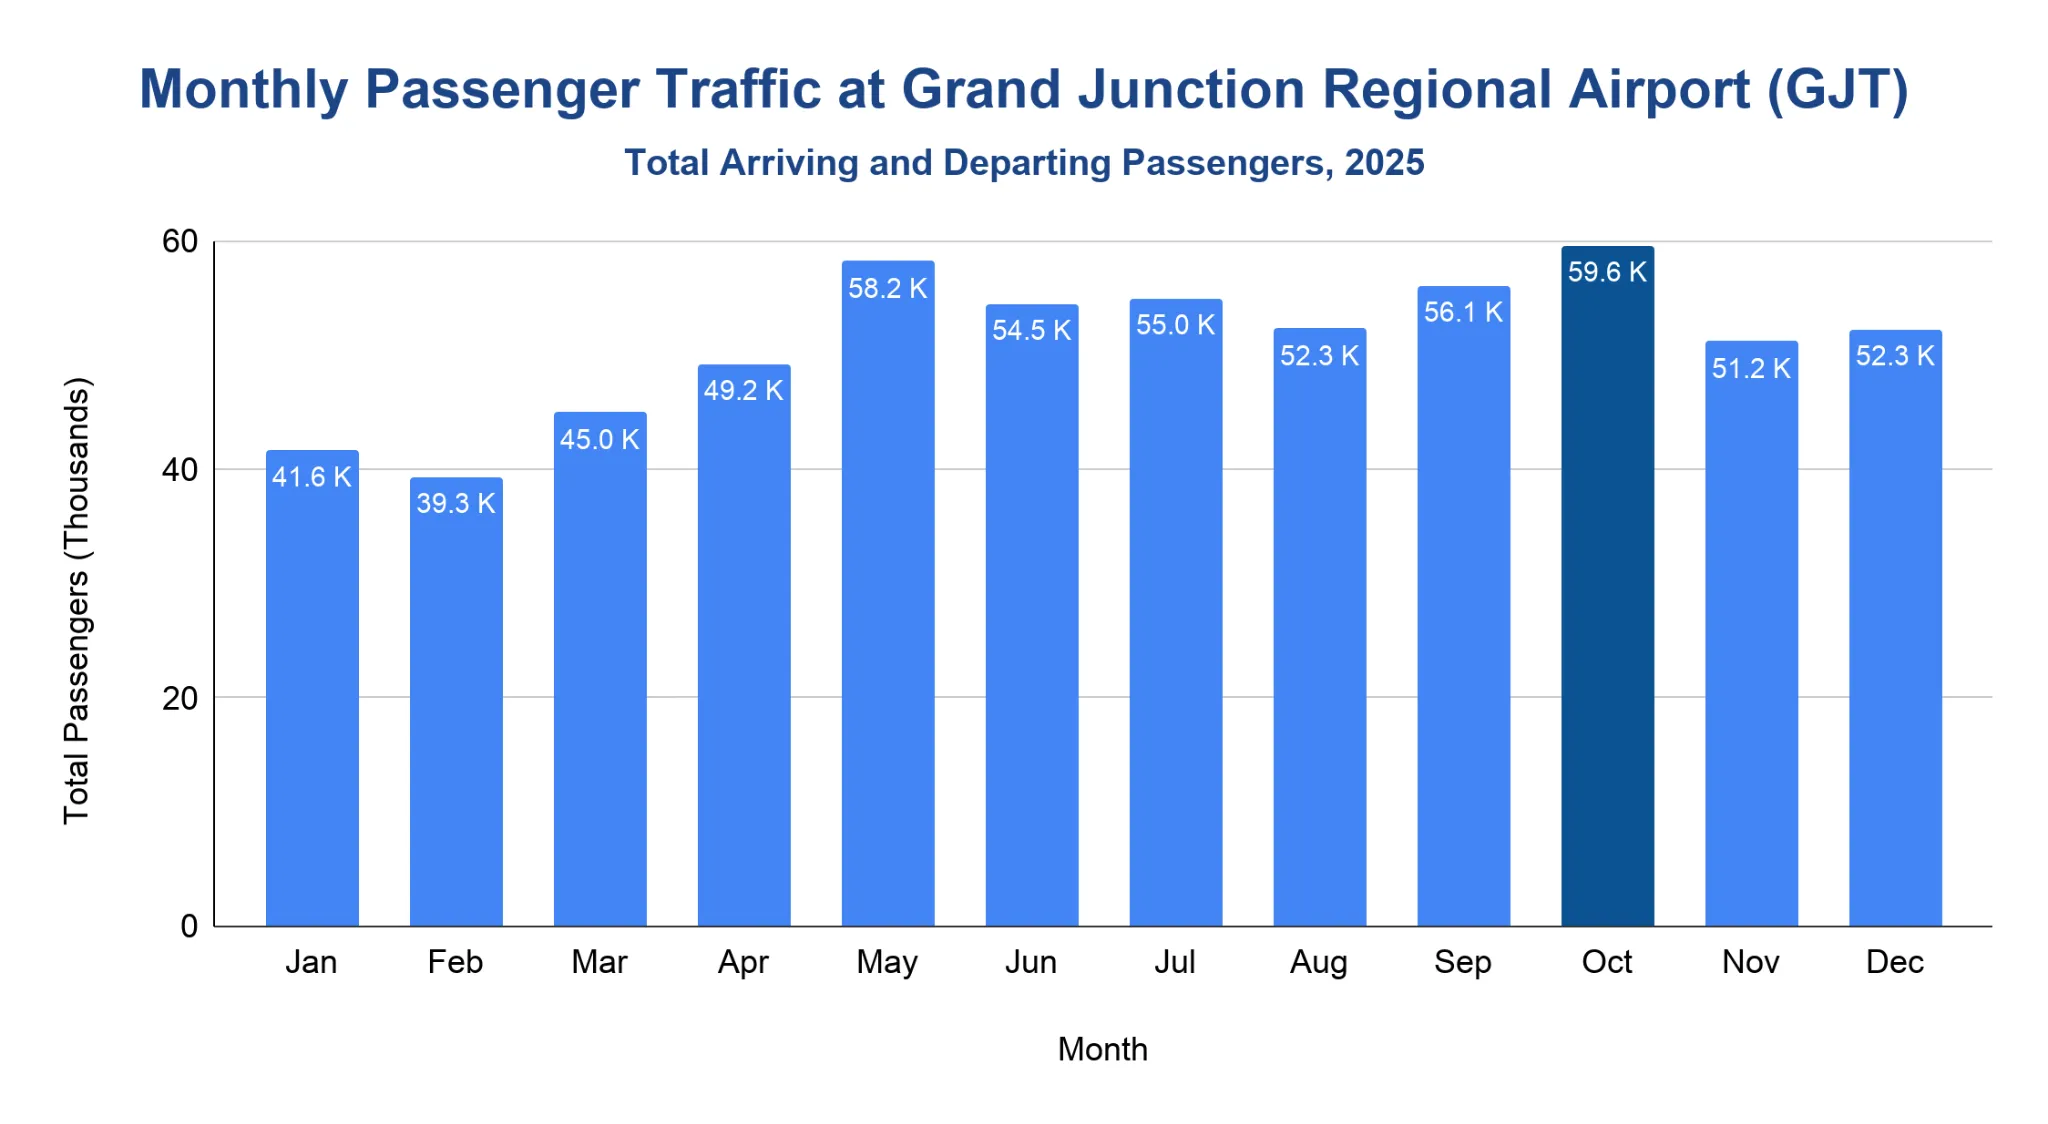
October was GJT’s busiest travel month in 2025, with a calculated total of 59,622 arriving and departing passengers.
- GJT handled a calculated 614,391 total passengers in 2025, based on 309,427 origin passengers and 304,964 destination passengers.
- October led the year with 59,622 total passengers, followed by May at 58,223.
- September was the third-busiest month with 56,099 total passengers, ahead of July at 54,969 and June at 54,514.
- February was the quietest month, with 39,340 total passengers, followed by January at 41,639.
- The strongest travel stretch ran from May through October, when monthly traffic exceeded 52 thousand total passengers.
Note: Origin passengers represent passengers departing from GJT, while destination passengers represent passengers arriving at GJT. Calculated total passengers are the sum of origin and destination passengers from the same BTS monthly data pull.
Which airlines carry the most passengers at Grand Junction Regional Airport?
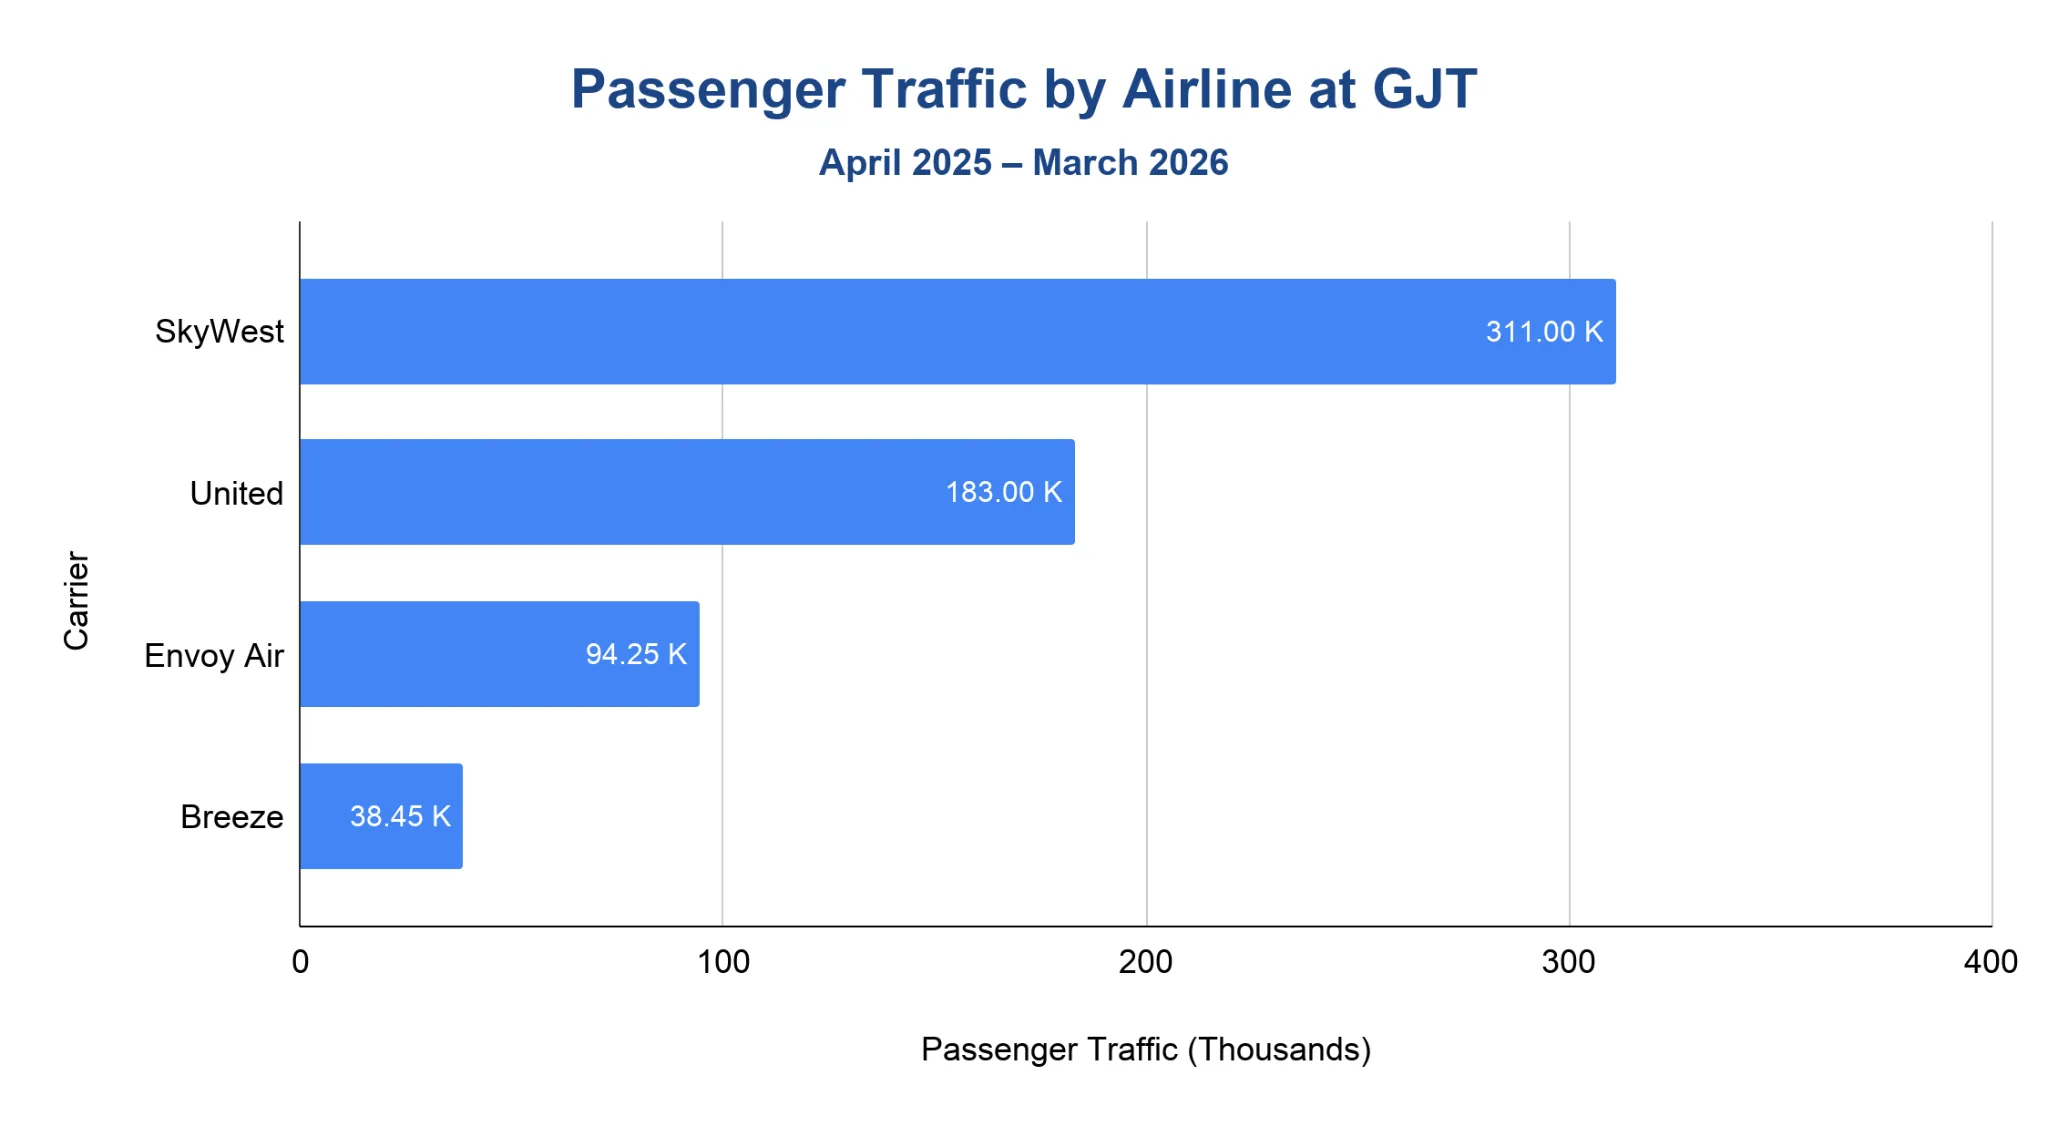
SkyWest carried the largest share of GJT’s scheduled passenger traffic, with 311 thousand passengers and a 49.56% share in April 2025 to March 2026.
- SkyWest led the airport’s carrier mix, accounting for nearly half of scheduled passenger traffic.
- United ranked second with 183 thousand passengers, or 29.25% of the total.
- Envoy Air followed with 94,250 passengers and a 15.03% share.
- Breeze carried 38,450 passengers, equal to 6.13% of scheduled passenger traffic.
Note: BTS shows carrier share by passenger traffic, not flight count.
How much operating revenue does Grand Junction Regional Airport generate annually?
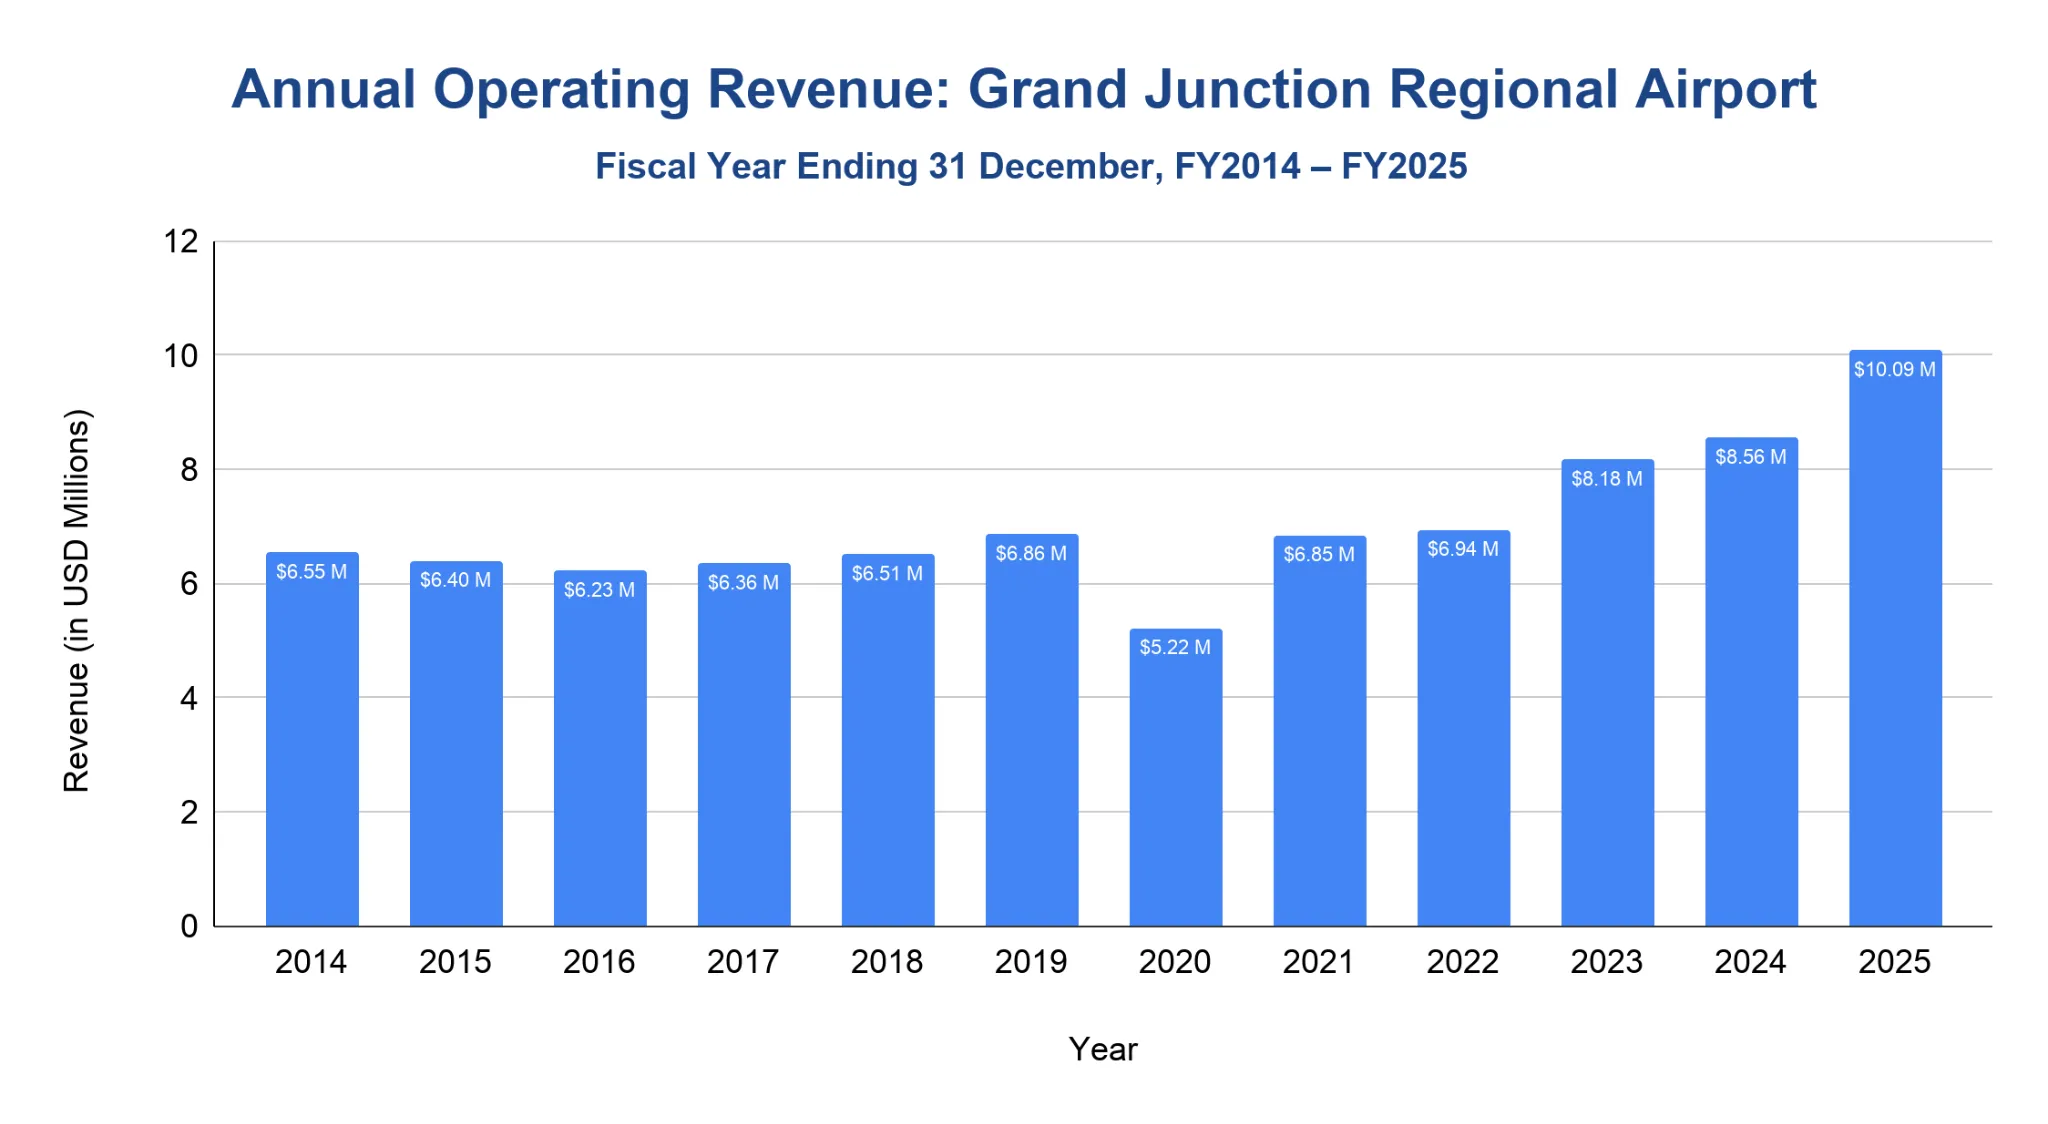
GJT generated $10.09 million in total operating revenue in FY2025, the highest figure in the 2014–2025 FAA Form 127 series.
- From FY2014 through FY2018, total operating revenue stayed close to the $6.23 million to $6.55 million range.
- Pre-pandemic revenue reached $6.86 million in FY2019, before falling to $5.22 million in FY2020.
- Revenue rebounded to $6.85 million in FY2021 and $6.94 million in FY2022.
- Growth accelerated after that, rising to $8.18 million in FY2023 and $8.56 million in FY2024.
- By FY2025, total operating revenue reached $10.09 million, up 17.88% from FY2024.
Note: FAA Form 127 reports these figures for fiscal years ending 31 December. Table values are standardized to USD million for readability.
What is Grand Junction Regional Airport’s on-time performance?
GJT posted 81% on-time departures and 80% on-time arrivals for domestic major-carrier flights in the May 2025 to April 2026 period.
- Departure on-time performance stood at 87% in 2021, before moving to 82% in 2022, 83% in 2023, 84% in 2024, and 81% in 2025.
- Arrival on-time performance followed a similar pattern, moving from 84% in 2021 to 80% in 2025.
- The May 2025 to April 2026 rolling period also showed 81% on-time departures and 80% on-time arrivals.
- Average delay among delayed flights was 92.27 minutes for departures and 64.96 minutes for arrivals in May 2025 to April 2026.
- The cancellation rate stayed below 2% across the BTS series, ranging from 0.83% in 2024 to 1.81% in 2022.
| Airport On-Time Performance at GJT | ||||||
|---|---|---|---|---|---|---|
| Metric | 2021 | 2022 | 2023 | 2024 | 2025 | 2026* |
| On-Time Departures | 87% | 82% | 83% | 84% | 81% | 81% |
| On-Time Arrivals | 84% | 80% | 82% | 82% | 80% | 80% |
| Avg Departure Delay (Min.) | 98.83 | 89.59 | 105.08 | 106.60 | 92.89 | 92.27 |
| Avg Arrival Delay (Min.) | 70.92 | 65.46 | 73.54 | 68.16 | 66.32 | 64.96 |
| Cancellation Rate | 1.37% | 1.81% | 1.43% | 0.83% | 1.19% | 1.39% |
| Flights | 4,890 | 3,421 | 3,155 | 3,966 | 4,699 | 3,247 |
| Reporting Carriers | 4 | 6 | 4 | 4 | 4 | 3 |
Source · BTS defines a delayed flight as one arriving or departing 15 or more minutes after schedule. Average delay values are calculated from delayed flights only. BTS publishes average delays in decimal-minute format, so the values have been kept exactly as reported. 2026 reflects May 2025 to April 2026.
Related Travel Statistics
- Appleton International Airport Statistics
- Birmingham Airport (BHM) Statistics
- Cincinnati Airport (CVG) Statistics
- Dallas Fort Worth Airport Statistics
- Daytona Beach International Airport Statistics
- Fort Lauderdale Airport (FLL) Statistics
- Piedmont Triad Airport Statistics
- JFK Airport Statistics
- Midway International Airport Statistics
- Myrtle Beach Airport (MYR) Statistics
- New Orleans Airport (MSY) Statistics
- Raleigh-Durham International Airport Statistics
Major Expansion Projects at Grand Junction Regional Airport
GJT received more than $53 million in 2025 FAA Airport Improvement Program funding for its runway replacement project.
- The airport announced a $38 million FAA Airport Improvement Program grant on 26 September 2025 for the first phase of runway pavement construction.
- That award brought GJT’s 2025 Airport Improvement Program funding for the runway replacement project to more than $53 million.
- In 2024, the airport announced $40.5 million in federal and Colorado Division of Aeronautics grant funding to support $45 million in capital improvements.
- The 2024 grant package included $35.4 million in FAA Airport Improvement Program funding for a portion of Runway 11/29 relocation construction costs.
- The FAA describes Airport Improvement Program grants as funding for airport infrastructure such as runways, taxiways, signage, lighting, and markings.
Note: Runway and capital-improvement funding can be announced in separate grant awards across different project phases.
References
- FAA: MCO Aircraft Operations and Cargo Data · faa.gov
- GJT (FlyGJT) — Airport Routes and Updates (2024–2025) · gjairport.com
- FAA OPSNET — Airport Operations (2014–April 2026) · aspm.faa.gov
- BTS Airline, Destination, Monthly Passenger, and On-Time Data (2021–2026) · transtats.bts.gov
- FAA CATS — total operating revenue data (2014–2025) · cats.airports.faa.gov

