

 Popular Countries
 24/7 Support
Published Sep 9, 2026
Located about 11 miles west of downtown New Orleans in Kenner, Louisiana, Louis Armstrong New Orleans International Airport (MSY) is Louisiana’s primary commercial airport and serves more than 80% of passengers flying into the state. The airport’s current terminal opened on Nov. 6, 2019, with 35 gates, and MSY handled more than 12 million total passengers in 2025.
How many passengers fly through Louis Armstrong New Orleans International Airport each year?
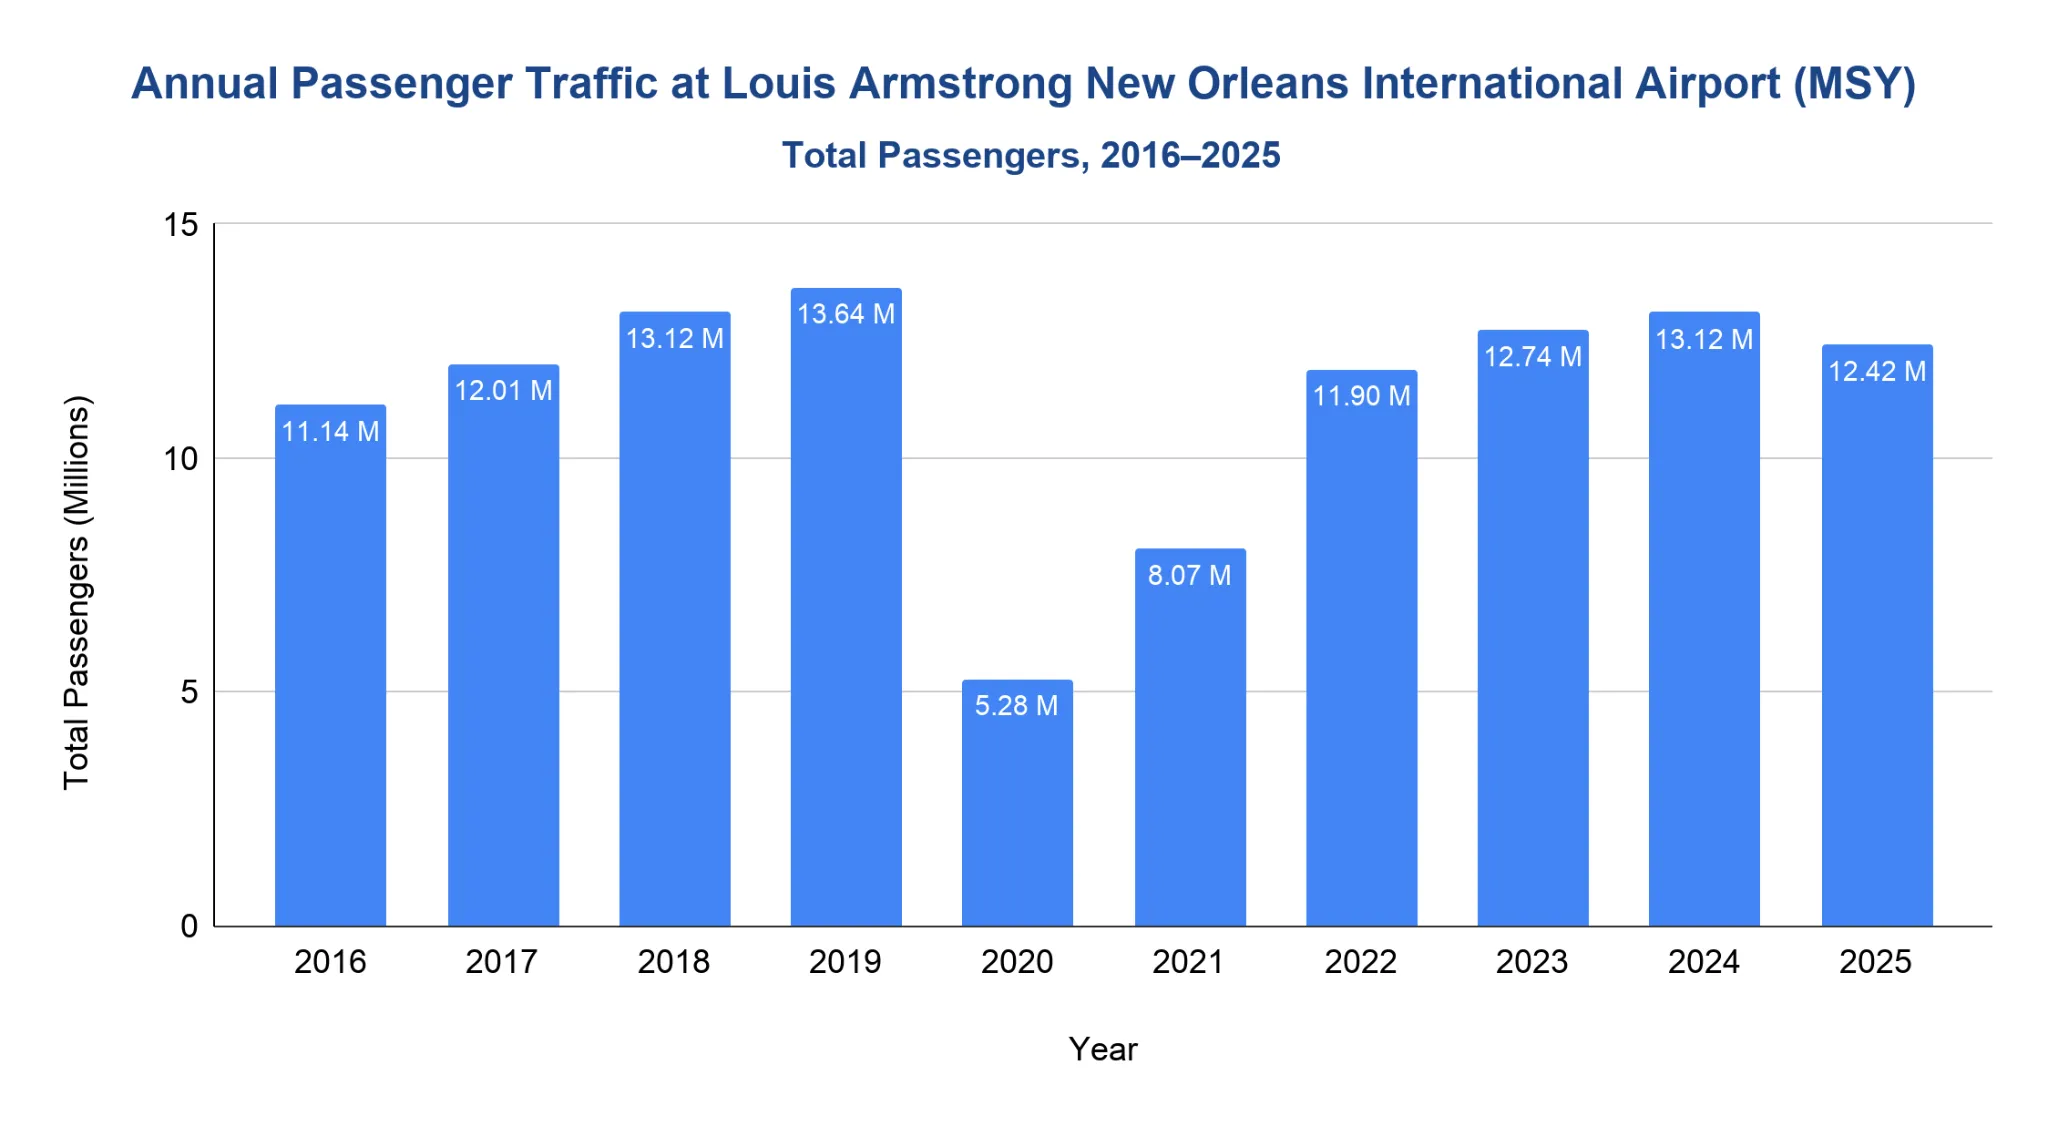
MSY handled 12.42 million total passengers in 2025, down 5.3% from the latest official 2024 comparison total.
- Passenger traffic moved from record growth in the mid-2010s to a pre-pandemic peak of 13.64 million in 2019.
- The airport first passed 10.6 million passengers in 2015, reached 11.14 million in 2016, and set another record at 13.12 million in 2018.
- The pandemic cut traffic to 5.28 million passengers in 2020, about 61.3% below the 2019 peak.
- Recovery accelerated after 2021, with 11.9 million passengers in 2022, 12.74 million in 2023, and 13.12 million in the latest official 2024 comparison.
- As of February 2026, MSY handled 1.83 million total passengers, 4.1% below the same period in 2025.
Note: Total passengers combine enplaned (departures) and deplaned (arrivals) passengers.
Does Louis Armstrong New Orleans International Airport handle mainly domestic or international flights?
MSY remained overwhelmingly domestic in 2025, with domestic traffic accounting for about 98% of total passengers.
- Domestic scheduled and charter traffic totaled 12.18 million passengers in 2025.
- International scheduled and charter traffic totaled 245,597 passengers in 2025, or about 2% of total passenger traffic.
- On a departing-passenger basis, international enplanements accounted for about 2% of MSY’s 6.22 million enplanements in 2025.
- International traffic was slightly above the pre-pandemic 2019 level, when MSY handled about 218,035 international scheduled and charter passengers.
- As of February 2026, international scheduled traffic totaled 26,528 passengers, or about 1.4% of total traffic.
| Metric | 2025 Official Value |
|---|---|
| Domestic scheduled passengers | 12,135,215 |
| Domestic charter passengers | 43,430 |
| International scheduled passengers | 244,474 |
| International charter passengers | 1,123 |
| Total passengers | 12,424,242 |
| Total enplanements | 6,217,724 |
| International enplanements | 121,177 |
Source · Note: Enplanements are departing passengers only. Total passengers include both enplaned and deplaned passengers.
How many aircraft operations take place at Louis Armstrong New Orleans International Airport each year?
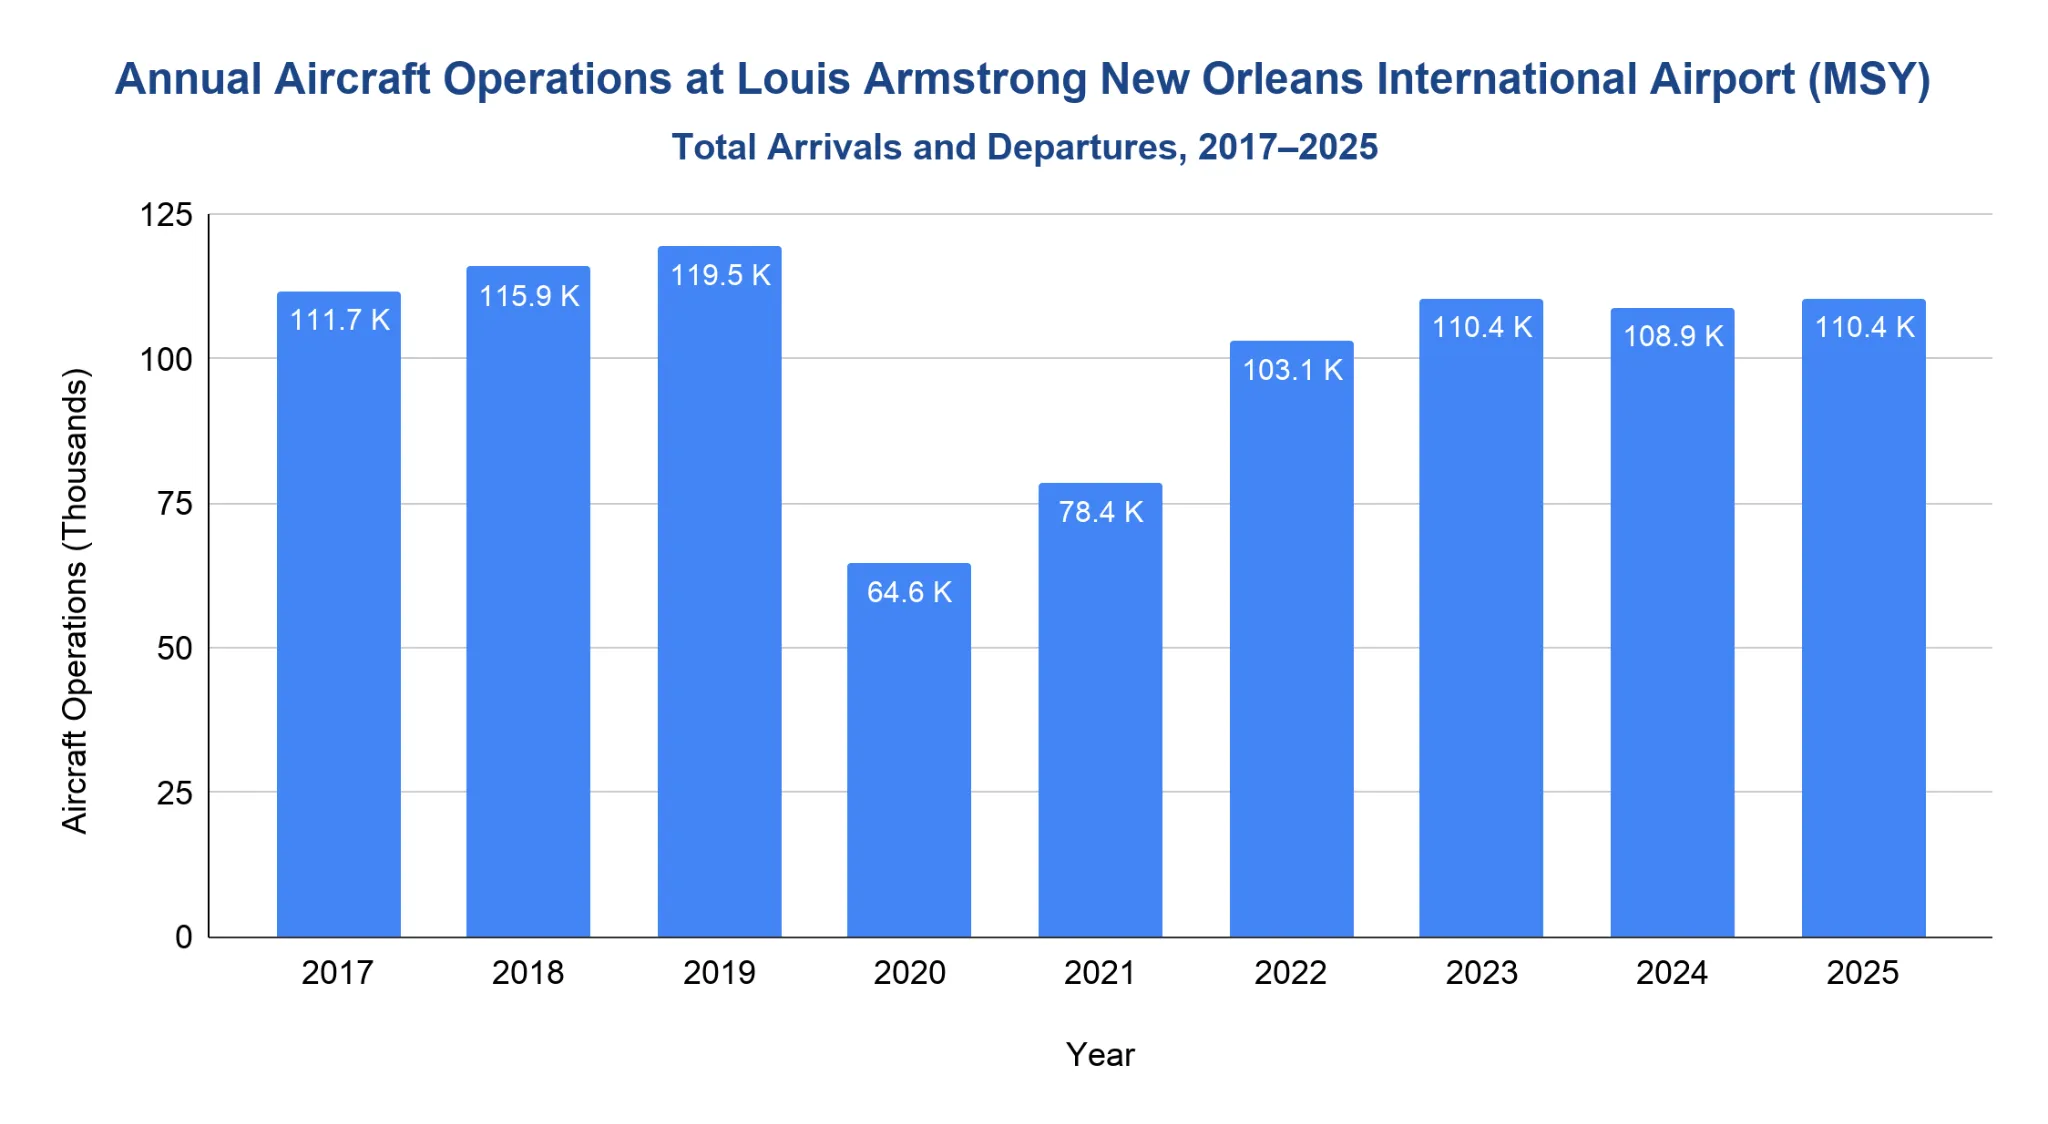
MSY recorded 110,425 aircraft operations in 2025.
- Aircraft operations recovered from the pandemic low of 64,576 in 2020 to more than 110,000 in 2025.
- The pre-pandemic 2019 total was 119,519 aircraft operations.
- The 2025 total was about 92.4% of the 2019 level.
- The 2025 total included 55,303 arrival operations and 55,122 departure operations.
- As of February 2026, MSY recorded 17,259 aircraft operations, 3.6% below the same period in 2025.
Note: Aircraft operations count arrivals plus departures.
Which airlines carry the most passengers at Louis Armstrong New Orleans International Airport?
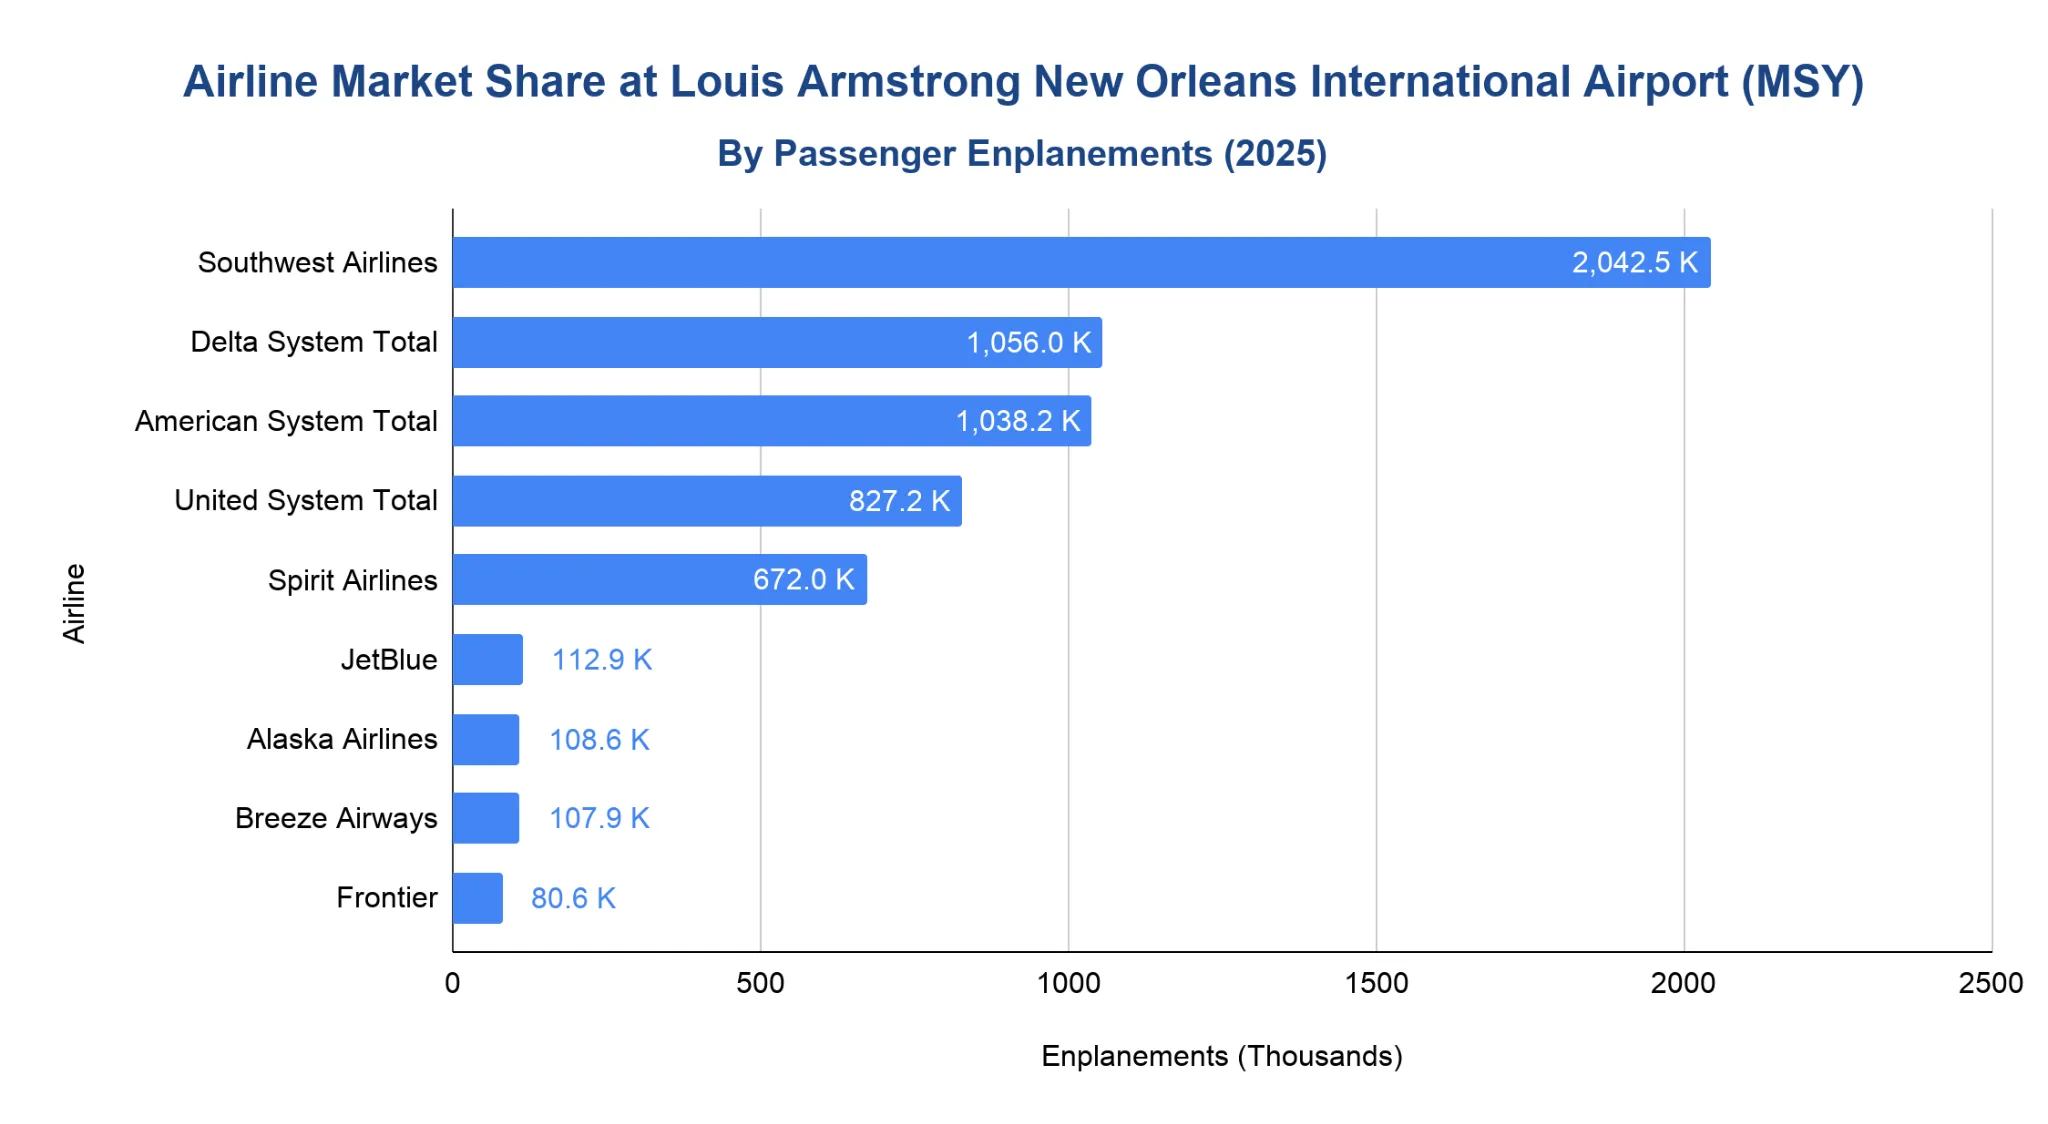
Southwest Airlines led MSY in 2025 with 2.04 million enplanements and a 32.8% departing-passenger share.
- Southwest remained the largest carrier at MSY, though its enplanements fell 7.6% from 2024.
- Delta Air Lines ranked second with 1.06 million enplanements.
- American Airlines followed closely with 1.04 million enplanements.
- United Airlines handled 827,181 enplanements, while Spirit Airlines carried 672,016.
- Smaller carriers such as JetBlue, Alaska Airlines, Breeze Airways and Frontier each handled fewer than 125,000 enplanements.
Note: Airline rankings use enplanements, which are departing passengers only.
What are the most popular destinations from Louis Armstrong New Orleans International Airport?
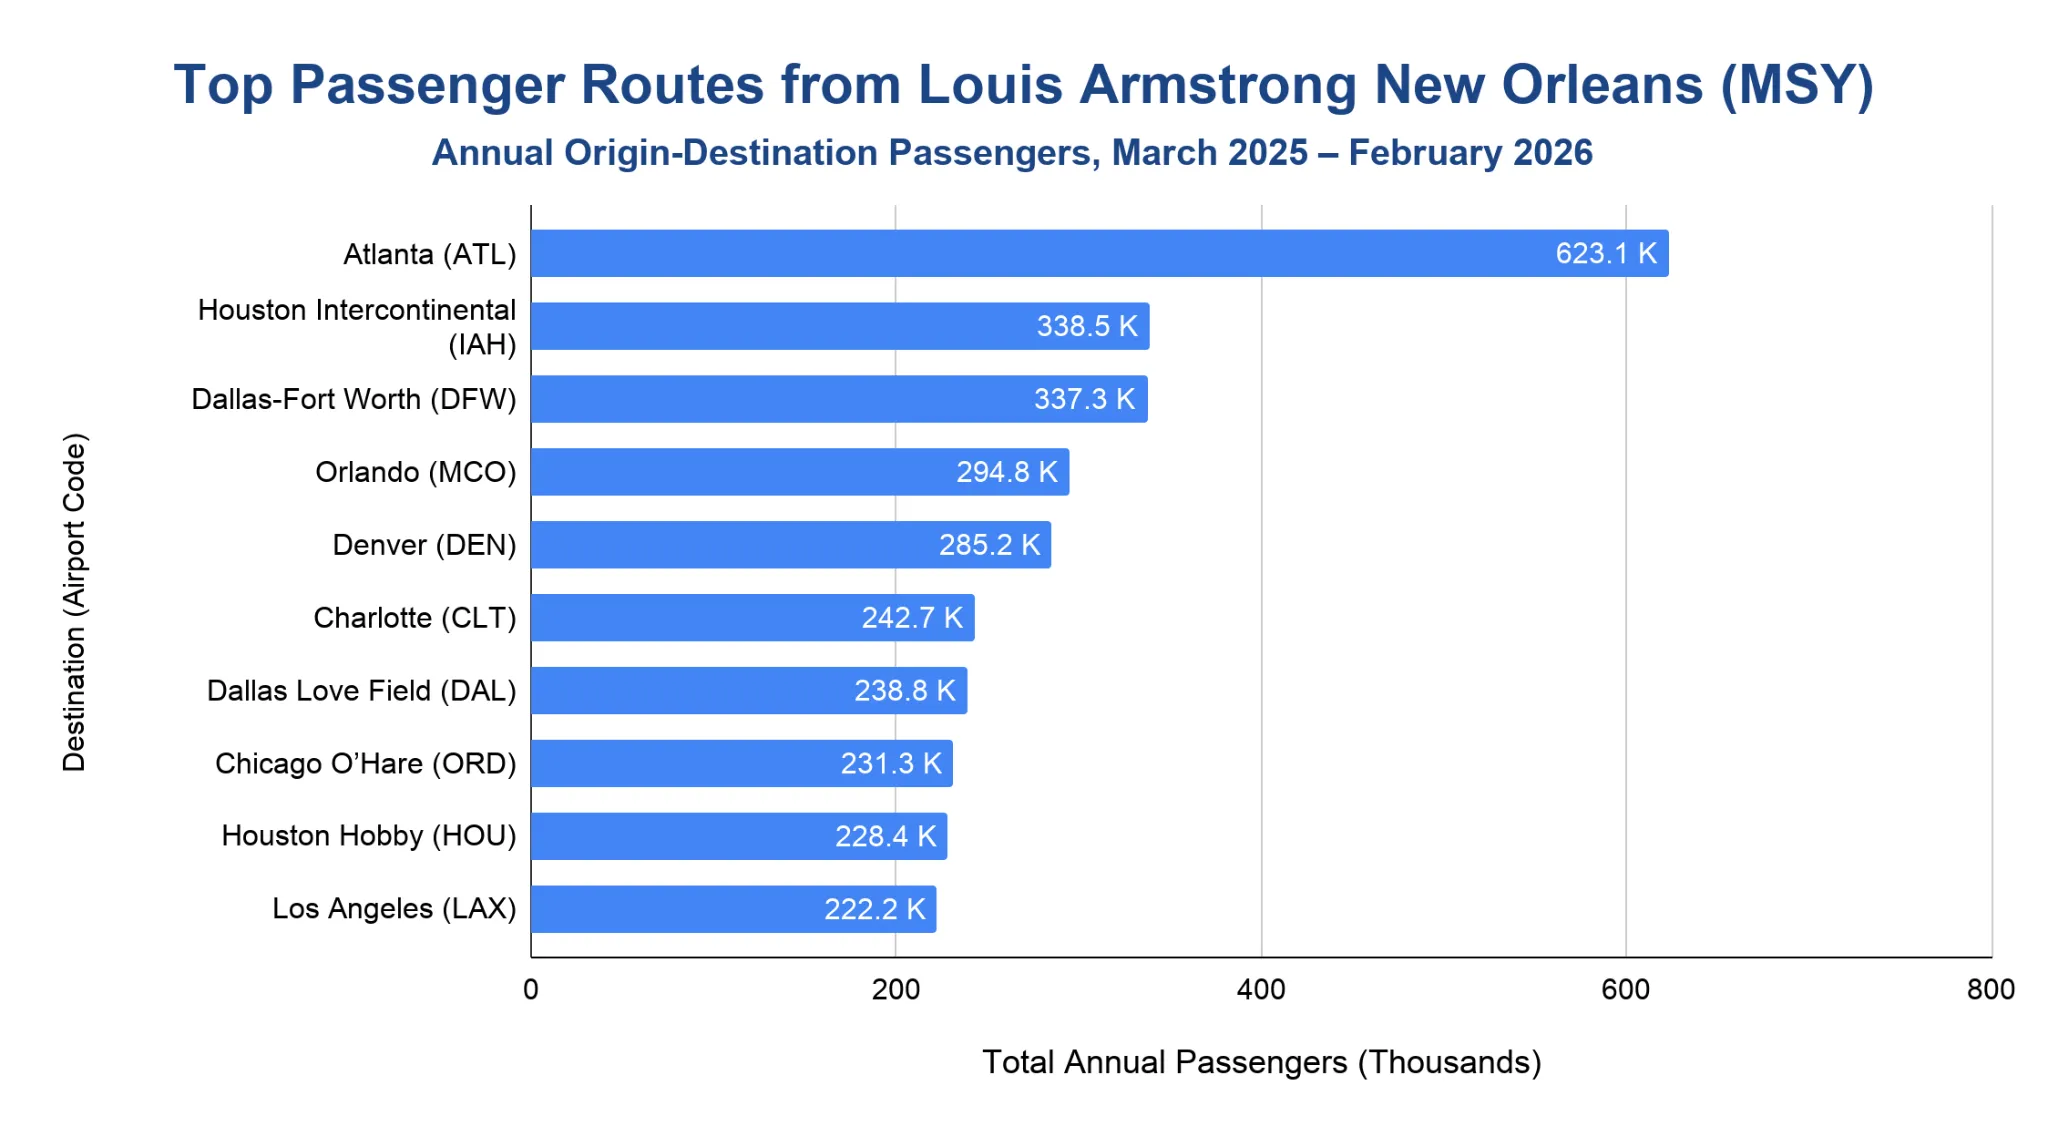
Atlanta was MSY’s top U.S. domestic market for March 2025–February 2026, with 623,060 Origin-Destination domestic market passengers.
- Atlanta (ATL) led by a wide margin with 623,060 passengers.
- Houston Intercontinental (IAH) and Dallas-Fort Worth (DFW) followed closely, at 338,510 and 337,320 passengers.
- Orlando (MCO) and Denver (DEN) rounded out the top 5, with 294,790 and 285,210 passengers.
- Charlotte (CLT), Dallas Love Field (DAL), Chicago O’Hare (ORD), Houston Hobby (HOU) and Los Angeles (LAX) completed the top 10.
Note: BTS reports this destination table in thousands; values shown here are expanded to passenger counts. The table is U.S.-only and does not include international markets.
Peak Travel Months at Louis Armstrong New Orleans International Airport
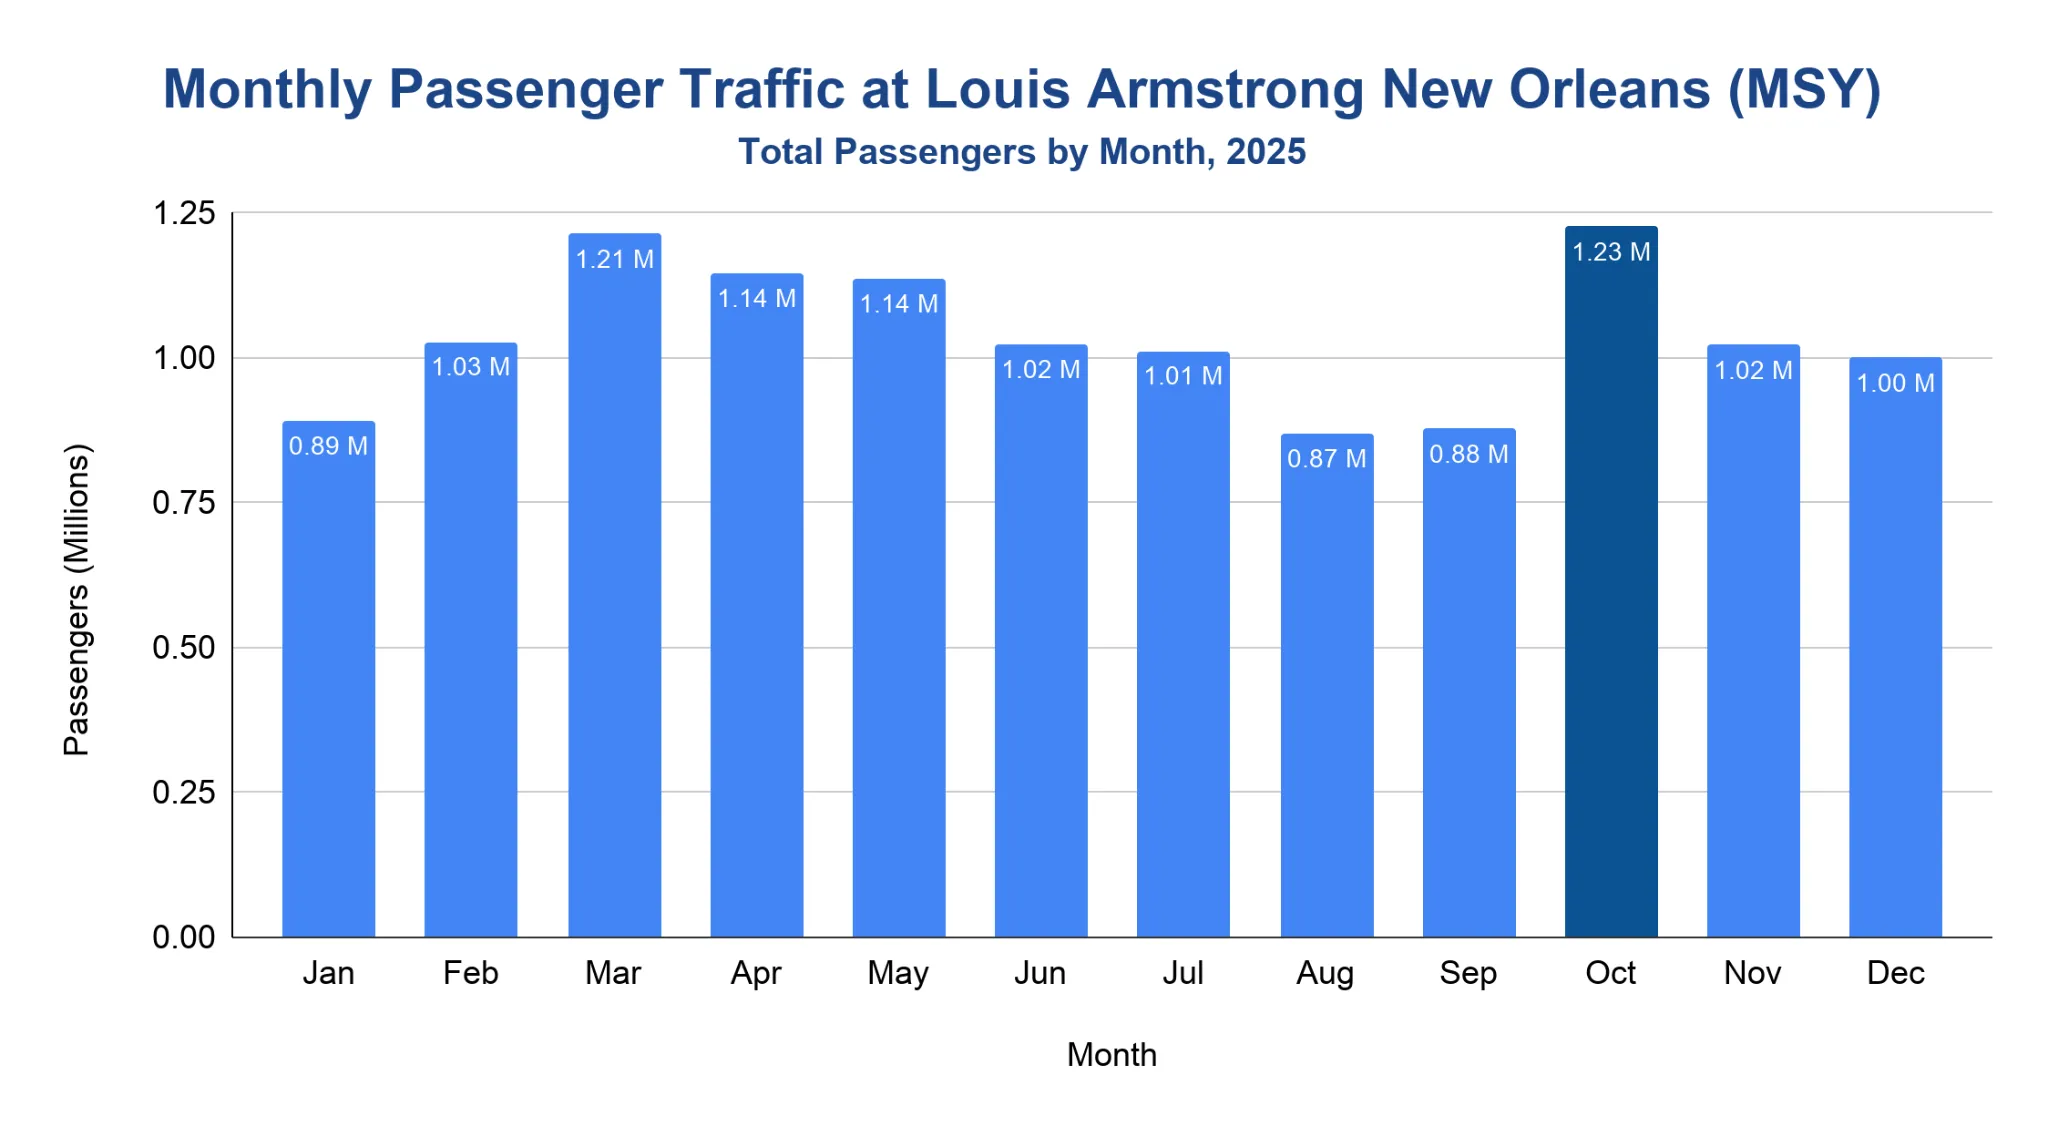
October was MSY’s busiest reported month in 2025, with 1.23 million total passengers.
- The year opened below 1 million passengers in January before rising to 1.03 million in February and 1.21 million in March.
- Spring stayed strong, with 1.14 million passengers in April and 1.14 million in May.
- October was the annual high point, followed by 1.02 million passengers in November and 999,555 in December.
- August and September were the slowest months, at 867,974 and 876,519 passengers.
How much revenue does Louis Armstrong New Orleans International Airport generate each year?
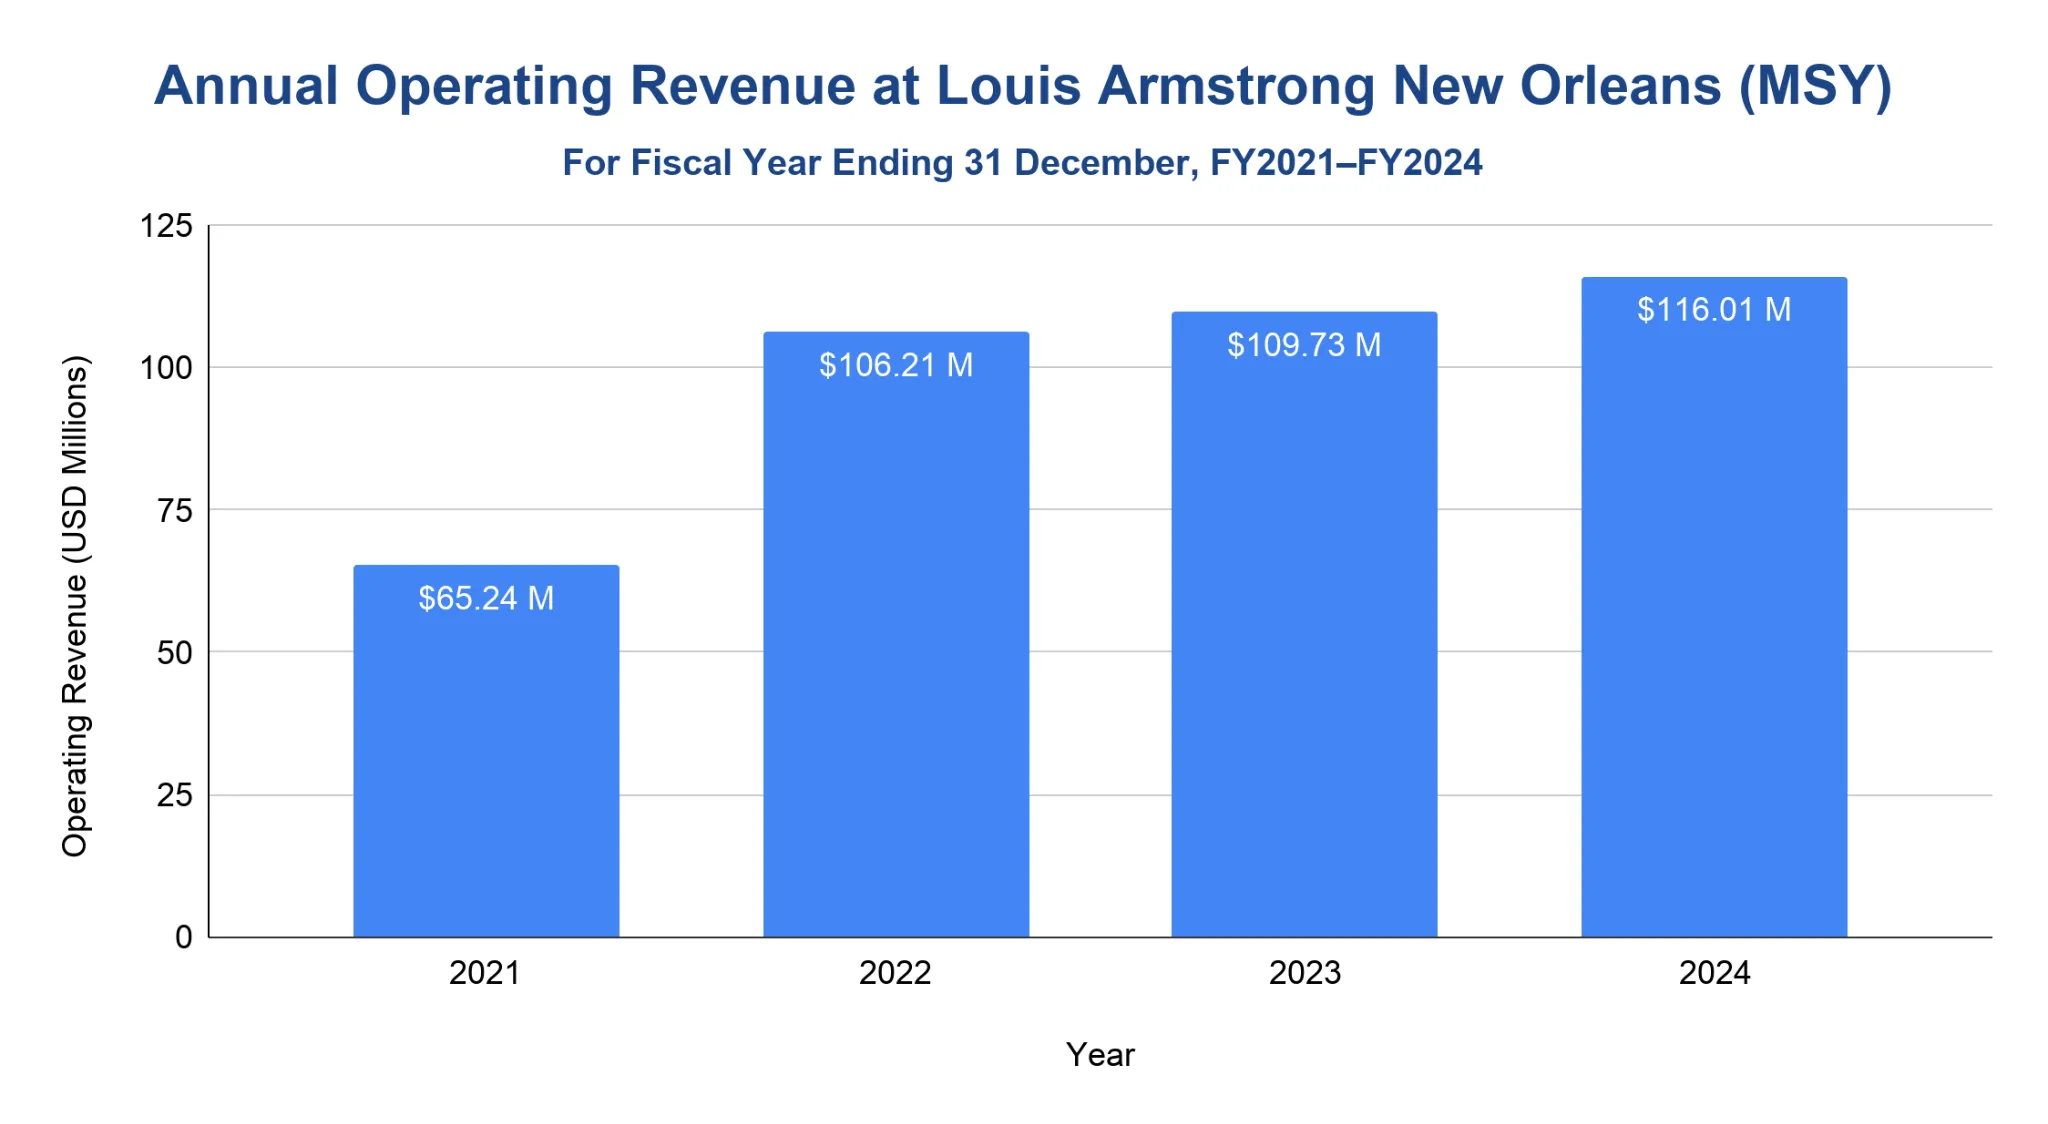
MSY reported $116.01 million in operating revenue for fiscal year 2024.
- Operating revenue rose from $65.24 million in 2021 to $106.21 million in 2022 as passenger traffic recovered.
- Revenue increased again to $109.73 million in 2023 and $116.01 million in 2024.
- Passenger and cargo airline revenue accounted for $52.18 million in 2024, about 45% of operating revenue.
- Nonairline revenue accounted for $63.83 million in 2024, about 55% of operating revenue.
Note: The airport’s fiscal year ends December 31.
How much cargo moves through Louis Armstrong New Orleans International Airport each year?
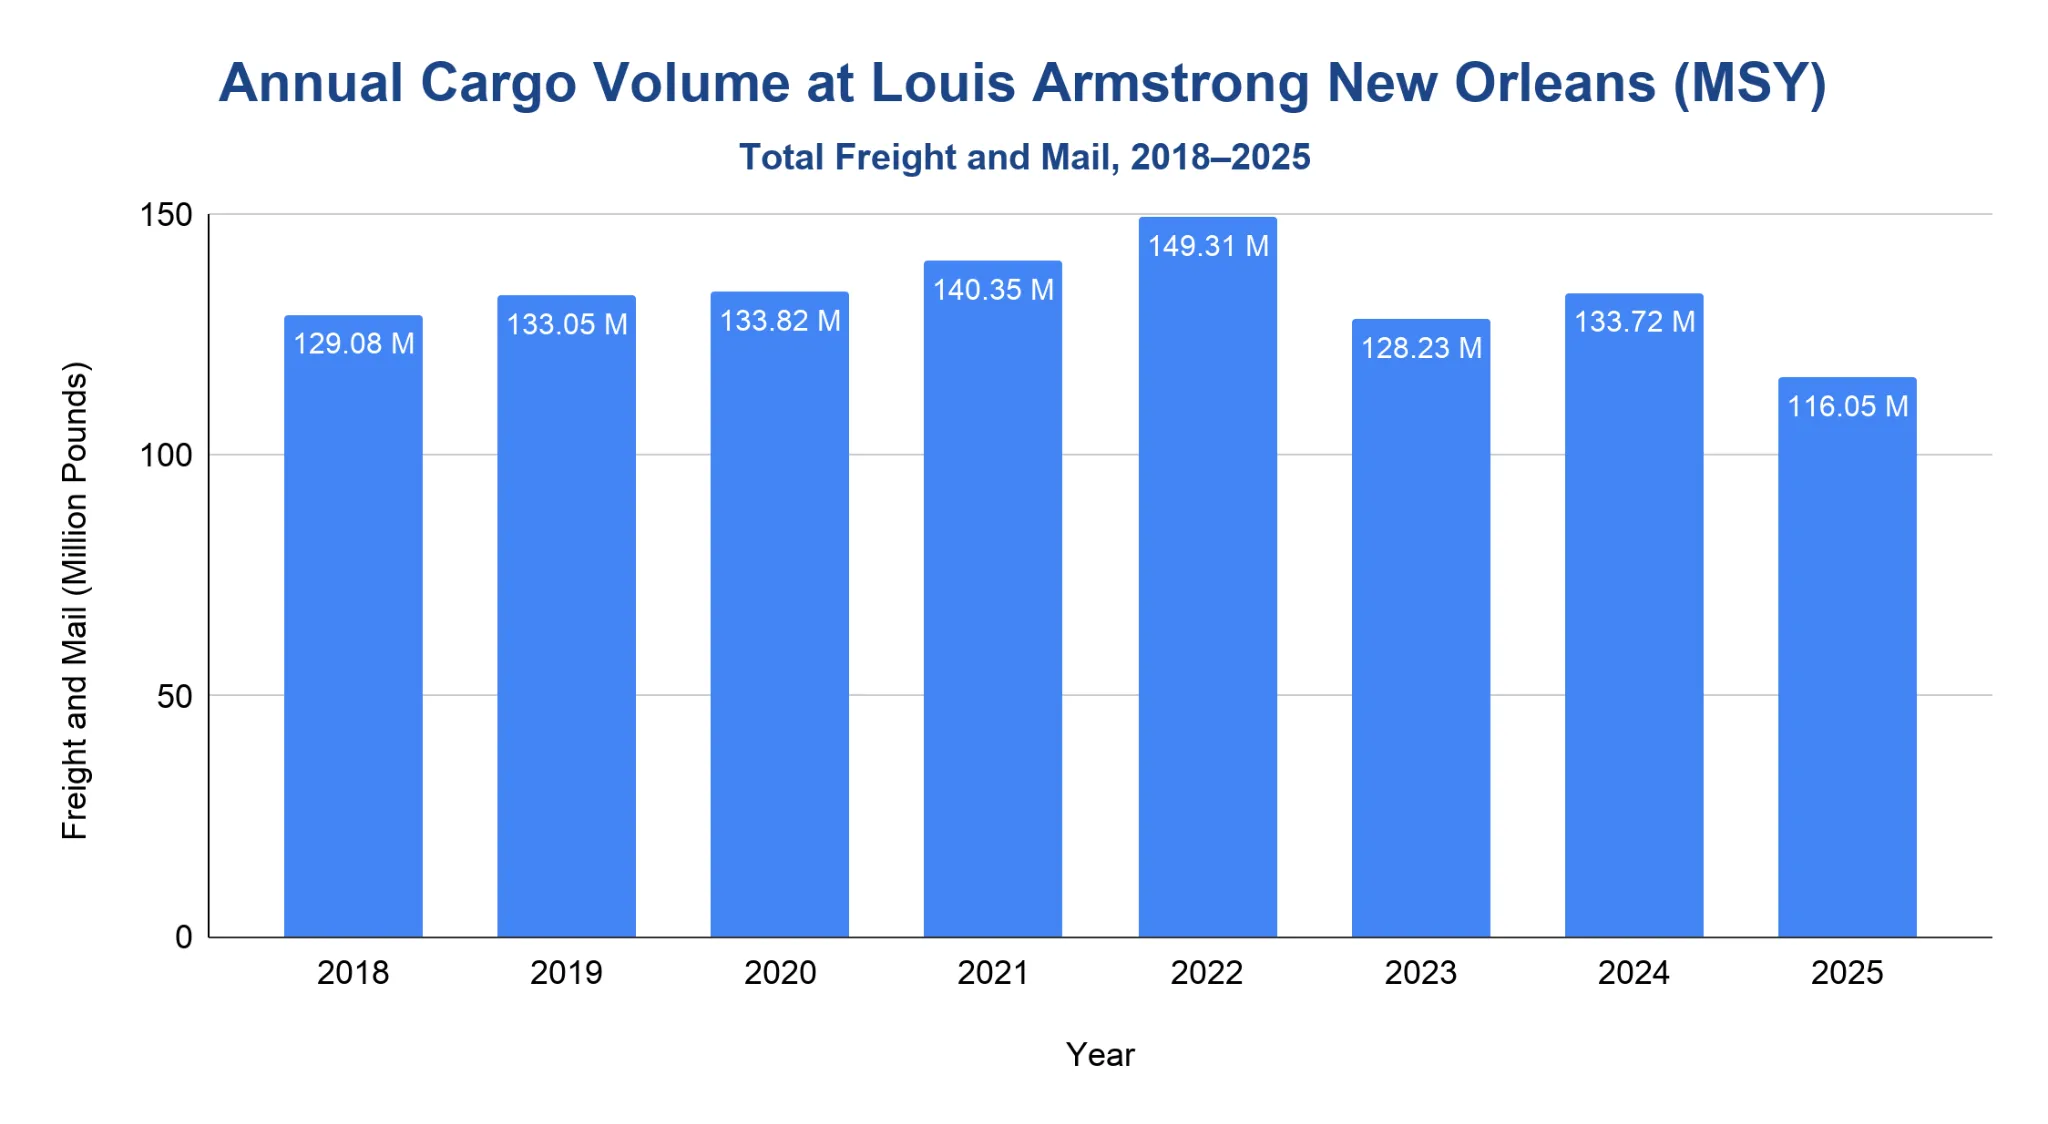
MSY handled 116.05 million pounds of freight and mail in 2025.
- Freight and mail volume was 133.05 million pounds in 2019, then held steady during the pandemic at 133.82 million pounds in 2020.
- Cargo grew to 140.35 million pounds in 2021 and peaked at 149.31 million pounds in 2022.
- Volume fell to 128.23 million pounds in 2023, rose to 133.72 million pounds in 2024, then declined to 116.05 million pounds in 2025.
- UPS handled 40.61 million pounds in 2025, while Federal Express handled 35.65 million pounds across domestic and international freight lines.
- As of February 2026, MSY handled 18.02 million pounds of freight and mail, up 2.9% from the same period in 2025.
Note: Freight and mail includes both cargo and mail volumes.
What is Louis Armstrong New Orleans International Airport’s on-time performance?
For March 2025–February 2026, MSY recorded 76% on-time departures, 76% on-time arrivals and a 1.08% cancellation rate.
- Calendar year 2025 also posted 76% on-time rates for both departures and arrivals.
- Average delay among delayed flights was 75.57 minutes for departures and 65.46 minutes for arrivals in 2025.
- Cancellations rose from 1.45% in 2024 to 1.78% in 2025, then stood at 1.08% for March 2025–February 2026.
- Since 2021, annual on-time departure rates have stayed between 75% and 77%.
| Metric | 2021 | 2022 | 2023 | 2024 | 2025 | 2026* |
|---|---|---|---|---|---|---|
| On-time departures | 77% | 75% | 77% | 77% | 76% | 76% |
| On-time arrivals | 75% | 75% | 76% | 76% | 76% | 76% |
| Avg. departure delay (min.) | 67.88 | 64.34 | 67.44 | 72.83 | 75.57 | 76.12 |
| Avg. arrival delay (min.) | 58.93 | 60.60 | 60.74 | 62.92 | 65.46 | 66.14 |
| Cancellation rate | 5.26% | 2.47% | 1.07% | 1.45% | 1.78% | 1.08% |
| Reporting flights (000) | 37.6 | 48.1 | 49.6 | 50.2 | 51.1 | 42.5 |
Source · Note: BTS defines a delayed flight as one arriving or departing 15 or more minutes after schedule. The 2026 period covers March 2025 through February 2026. BTS publishes average delays in decimal-minute format. As such, the values have been kept exactly as reported to avoid altering the underlying data.
What is the historical economic impact of Louis Armstrong New Orleans International Airport?
The official economic-impact study in the airport archive found MSY contributed $5.26 billion to the New Orleans-area economy in 2013.
- The May 2014 study estimated 53,360 total jobs tied directly or indirectly to airport activity.
- Airport-related activity generated $2.01 billion in earnings for New Orleans-area residents.
- State and local tax revenue totaled $484.62 million.
- A later airport release tied to the new terminal projected that, once the terminal opened, MSY would support more than 64,000 jobs, $6.4 billion in local spending and $2.4 billion in local earnings.
Related Travel Statistics
- Baltimore/Washington Airport Statistics
- Hollywood Burbank Airport (BUR) Statistics
- St. Pete-Clearwater Airport Statistics
- Colorado Springs Airport Statistics
- Daytona Beach International Airport Statistics
- Denver International Airport Statistics
- Greenville–Spartanburg Airport Statistics
- Harry Reid Airport (LAS) Statistics
- Missoula Montana Airport (MSO) Statistics
- Myrtle Beach Airport (MYR) Statistics
- Oakland Airport (OAK) Statistics
- Wilmington International Airport Statistics
How does Louis Armstrong New Orleans International Airport rank in the United States?
MSY ranked 38th among U.S. commercial service airports by Federal Aviation Administration (FAA) calendar-year 2024 passenger boardings.
- The FAA reported 6.54 million passenger boardings at MSY in 2024.
- Passenger boardings increased 3.61% from 6.31 million in 2023.
- FAA classified MSY as a primary medium-hub airport in the 2024 ranking table.
- Within Louisiana, MSY ranked 1st by FAA passenger boardings in 2024.
- MSY accounted for about 82% of Louisiana passenger boardings in the FAA state-by-airport table.
Note: FAA rankings use enplanements, also called passenger boardings. Enplanements count departing passengers only, not total passengers.
Major Expansion Projects at Louis Armstrong New Orleans International Airport
MSY’s current capital-project list includes a $27.1 million Runway 2/20 rehabilitation scheduled for completion by December 2026.
- The North Terminal opened on Nov. 6, 2019, after a $1.029 billion terminal program.
- The terminal program delivered a 35-gate, roughly 972,000-square-foot facility with 3 concourses.
- The Runway 2/20 Keel Rehabilitation Project is funded with $22.5 million from the Federal Aviation Administration Airport Improvement Program.
- The runway project covers the full 7,001-foot length of Runway 2/20 and includes pavement, lighting, marking and connector work.
- MSY also began a master-plan update in 2025 to guide long-term airport development over the next 20 years.
References
- MSY — Airport Traffic, Airline, Cargo, Economic Impact and Capital Projects Data (2013–February 2026) · flymsy.com
- Bureau of Transportation Statistics — LAS Performance Data and Route Information · bts.gov
- FAA: MCO Aircraft Operations and Cargo Data · faa.gov
- LLA — Airport Financial Statements and Operating Revenue Data (Fiscal Years 2021–2024) · lla.la.gov

