

 Popular Countries
 24/7 Support

Updated
How many passengers pass through George Bush Intercontinental Airport each year?
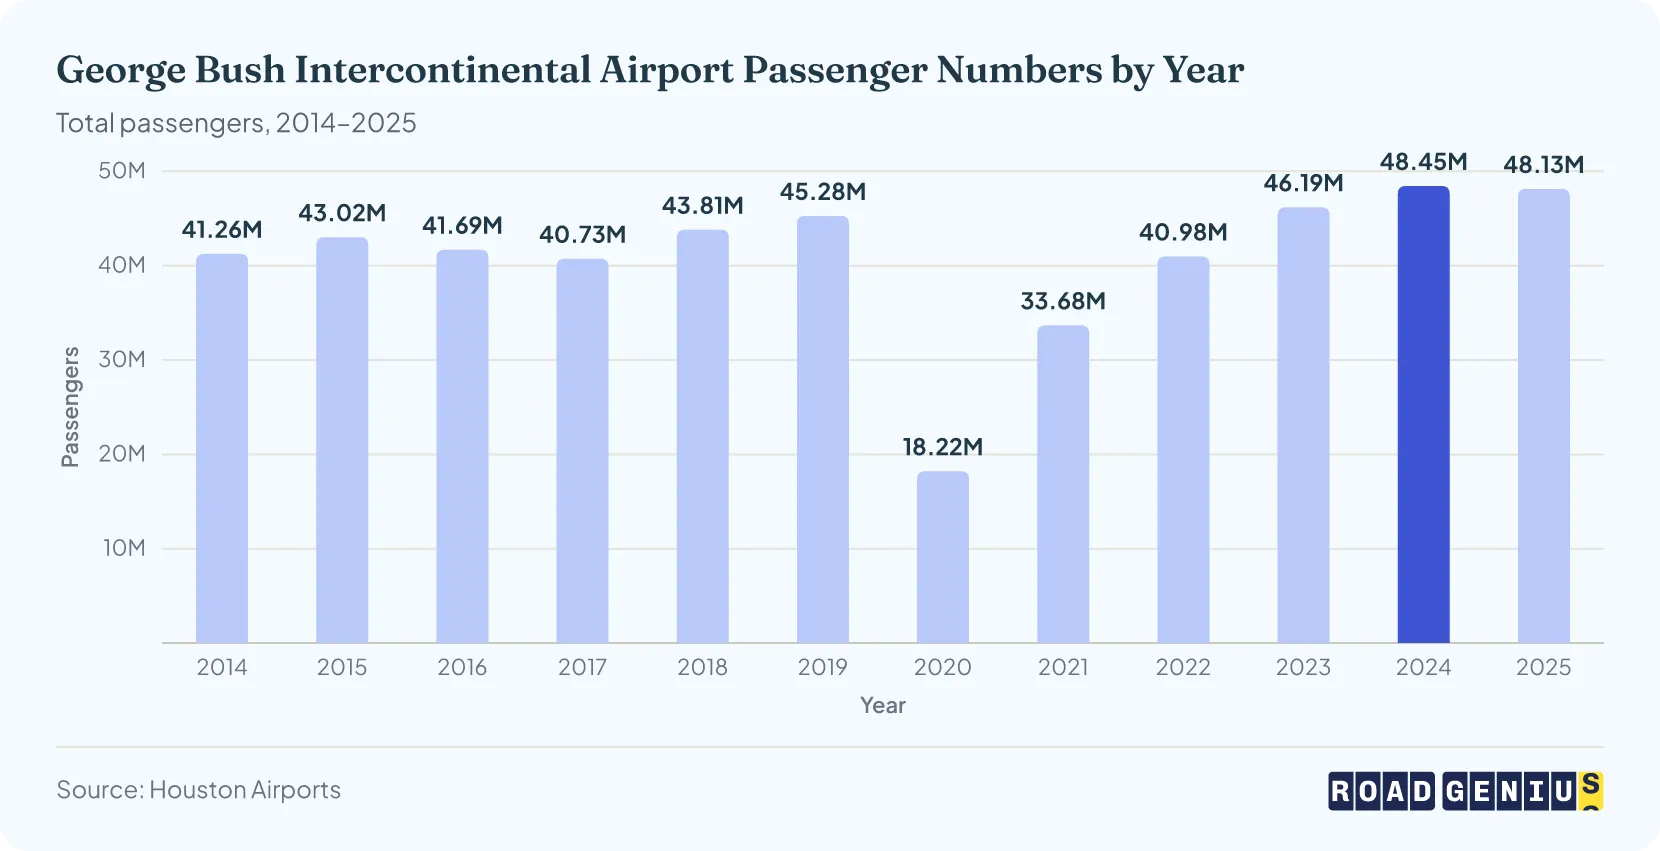
George Bush Intercontinental Airport (IAH) now handles more than 48 million passengers a year3.
- IAH welcomed 48.13 million passengers in 2025, down from 20244 but still 6% above the pre-pandemic 2019 level.
- IAH passenger traffic reached 48.45 million in 20245, compared to 46.19 million in 20236 and 40.98 million in 2022.7
- Before the pandemic, 45.28 million passengers used IAH in 20198; traffic then fell to 18.22 million in 2020 as COVID-19 hit travel.7
What were George Bush Intercontinental Airport's passenger numbers in 2025?
IAH served about 48.13 million travelers in 2025.4
What was the total passenger traffic at George Bush Intercontinental Airport in 2024?
IAH served 48.45 million passengers in 20245: 36.32 million domestic (75%) and 12.13 million international (25%).7
How many passengers and flights does IAH handle per day?
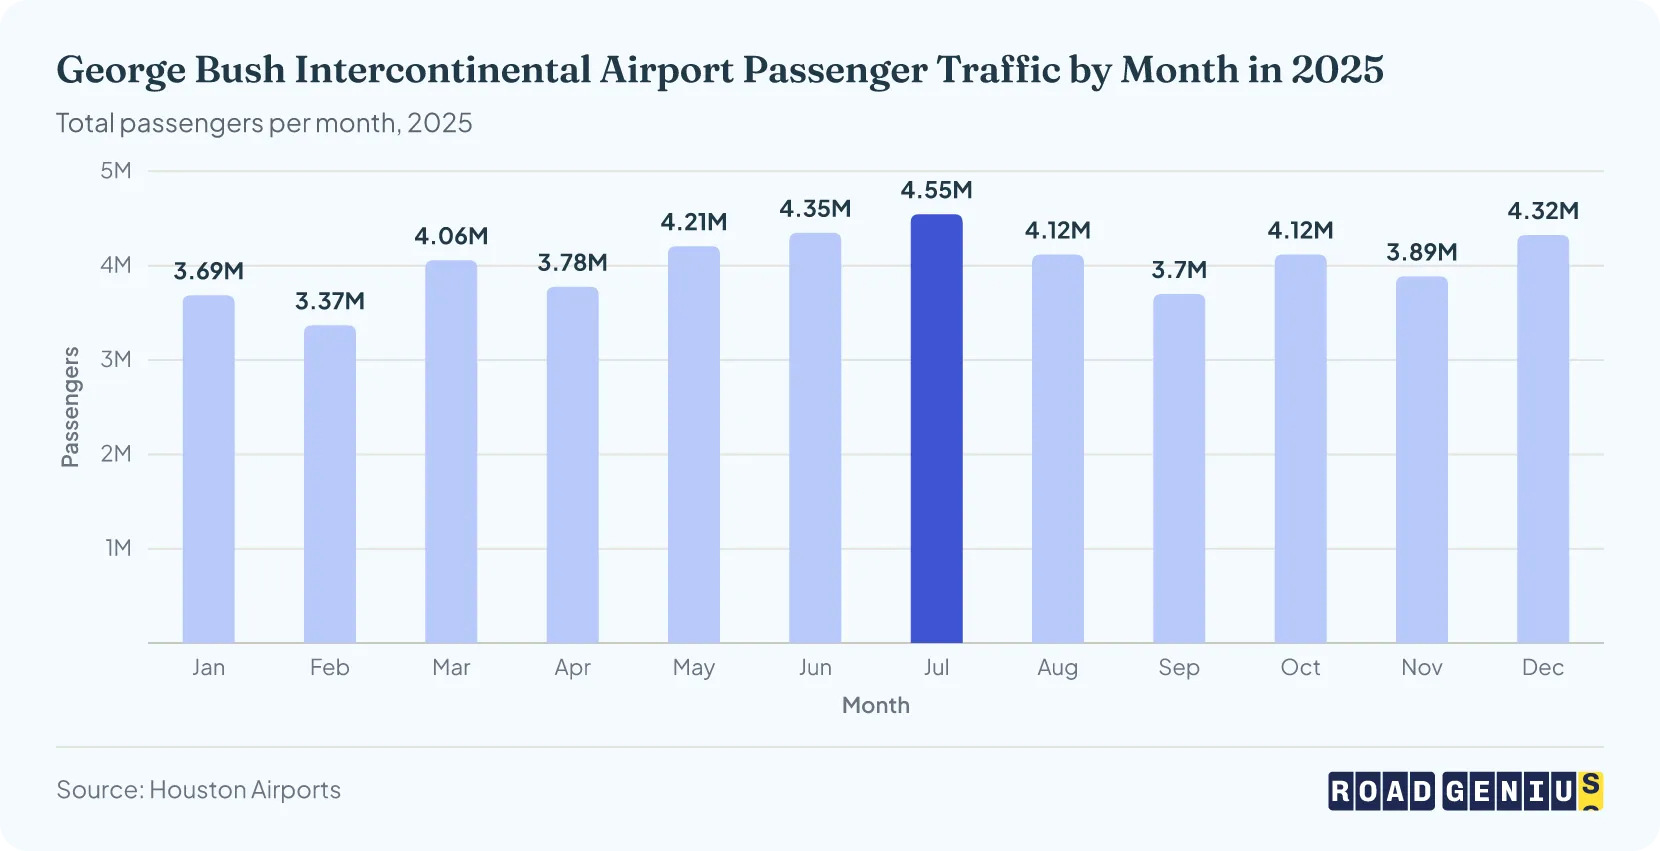
On its 2025 totals, IAH handles about 132,000 passengers a day and 1,250 flights a day (counting takeoffs and landings).
How large is George Bush Intercontinental Airport?
Which terminal is busiest at IAH?
Terminal C was the busiest at IAH in 2025, handling 15.69 million passengers.7
Passengers by terminal (2025):
- Terminal C: 15.69 million passengers
- Terminal E: 11.63 million passengers
- Terminal A: 10.26 million passengers
- Terminal D: 5.66 million passengers
- Terminal B: 4.90 million passengers7
How many flights does IAH handle each year?
George Bush Intercontinental Airport (IAH) now handles more than 457,000 aircraft operations (takeoffs and landings) a year.
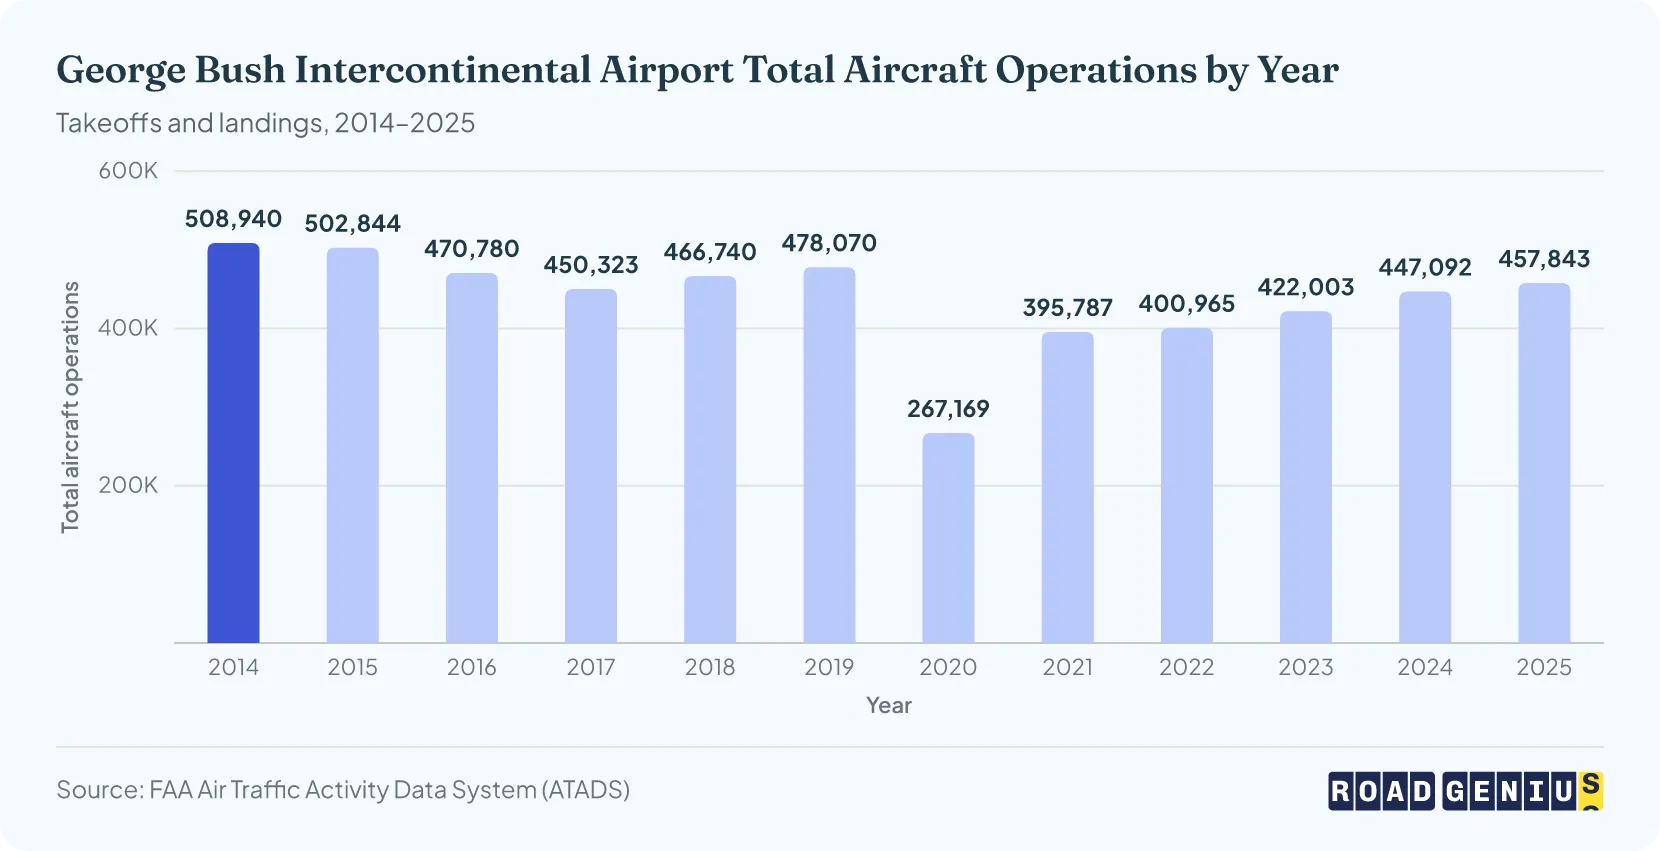
| George Bush Intercontinental Airport (IAH) aircraft operations by type, 2019–2025 | |||||
|---|---|---|---|---|---|
| Year | Air Carrier | Air Taxi | General Aviation | Military | Total |
| 2019 | 380,049 | 87,921 | 9,959 | 141 | 478,070 |
| 2020 | 206,355 | 54,235 | 6,378 | 201 | 267,169 |
| 2021 | 316,282 | 72,127 | 7,242 | 136 | 395,787 |
| 2022 | 328,987 | 63,447 | 8,378 | 153 | 400,965 |
| 2023 | 361,397 | 52,484 | 7,970 | 152 | 422,003 |
| 2024 | 381,088 | 57,956 | 7,939 | 109 | 447,092 |
| 2025 | 384,288 | 65,929 | 7,400 | 226 | 457,843 |
Source · FAA Operations Network (OPSNET), airport operations by calendar year
Which airlines carry the most passengers at IAH?
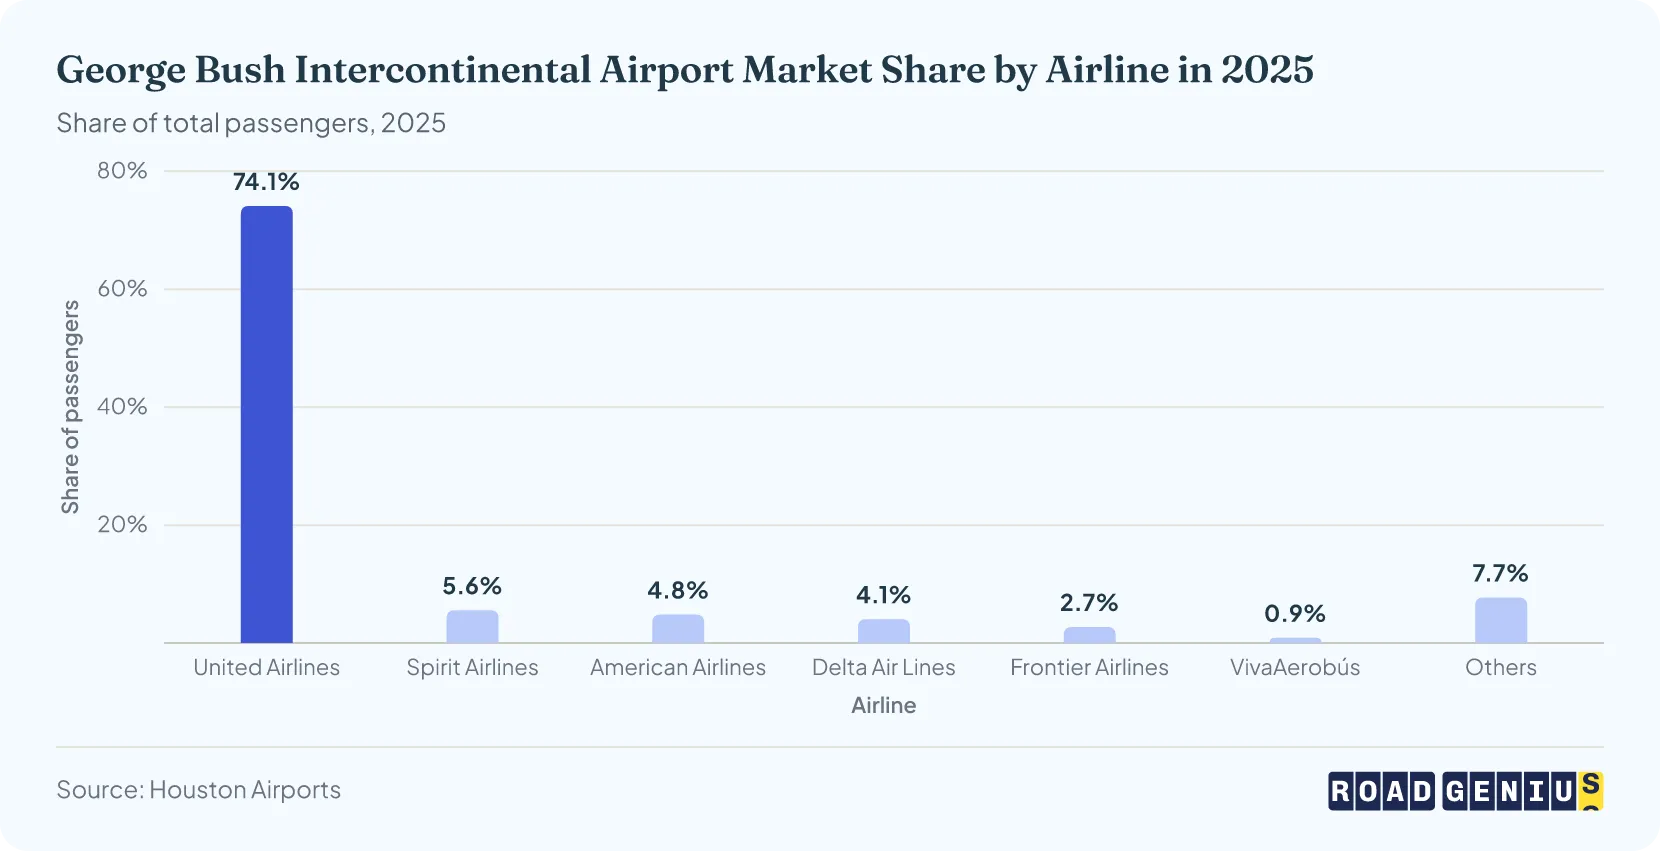
United Airlines carried the most passengers at George Bush Intercontinental Airport (IAH) in 2025, with a 74.1% market share.7
Market Share by Airline at IAH (2025)
- United Airlines: 74.1% (35.69 million passengers)
- Spirit Airlines: 5.6% (2.69 million passengers)
- American Airlines: 4.8% (2.33 million passengers)
- Delta Air Lines: 4.1% (1.96 million passengers)
- Frontier Airlines: 2.7% (1.32 million passengers)
- VivaAerobús: 0.9% (429,168 passengers)
- Other carriers: 7.7% (3.73 million passengers)7
What are the busiest routes at George Bush Intercontinental Airport?
Chicago O'Hare is IAH's busiest domestic route and Mexico City its busiest international route.
Top Domestic Routes by Passengers (September 2025–August 2026)
- IAH - Chicago O'Hare (ORD): 848,110 passengers
- IAH - Denver (DEN): 827,230 passengers
- IAH - Los Angeles (LAX): 764,830 passengers
- IAH - Atlanta (ATL): 707,350 passengers
- IAH - San Francisco (SFO): 608,010 passengers
- IAH - Dallas/Fort Worth (DFW): 602,560 passengers
- IAH - Newark (EWR): 560,040 passengers
- IAH - Orlando (MCO): 559,280 passengers
- IAH - New York LaGuardia (LGA): 516,900 passengers
- IAH - Las Vegas (LAS): 506,830 passengers14
Top International Route (2025)
- IAH - Mexico City (MEX): 838,574 passengers in 2025, counting both directions, down 3% from 867,482 in 202415. It is the only IAH route among the 50 busiest US–international airport pairs.
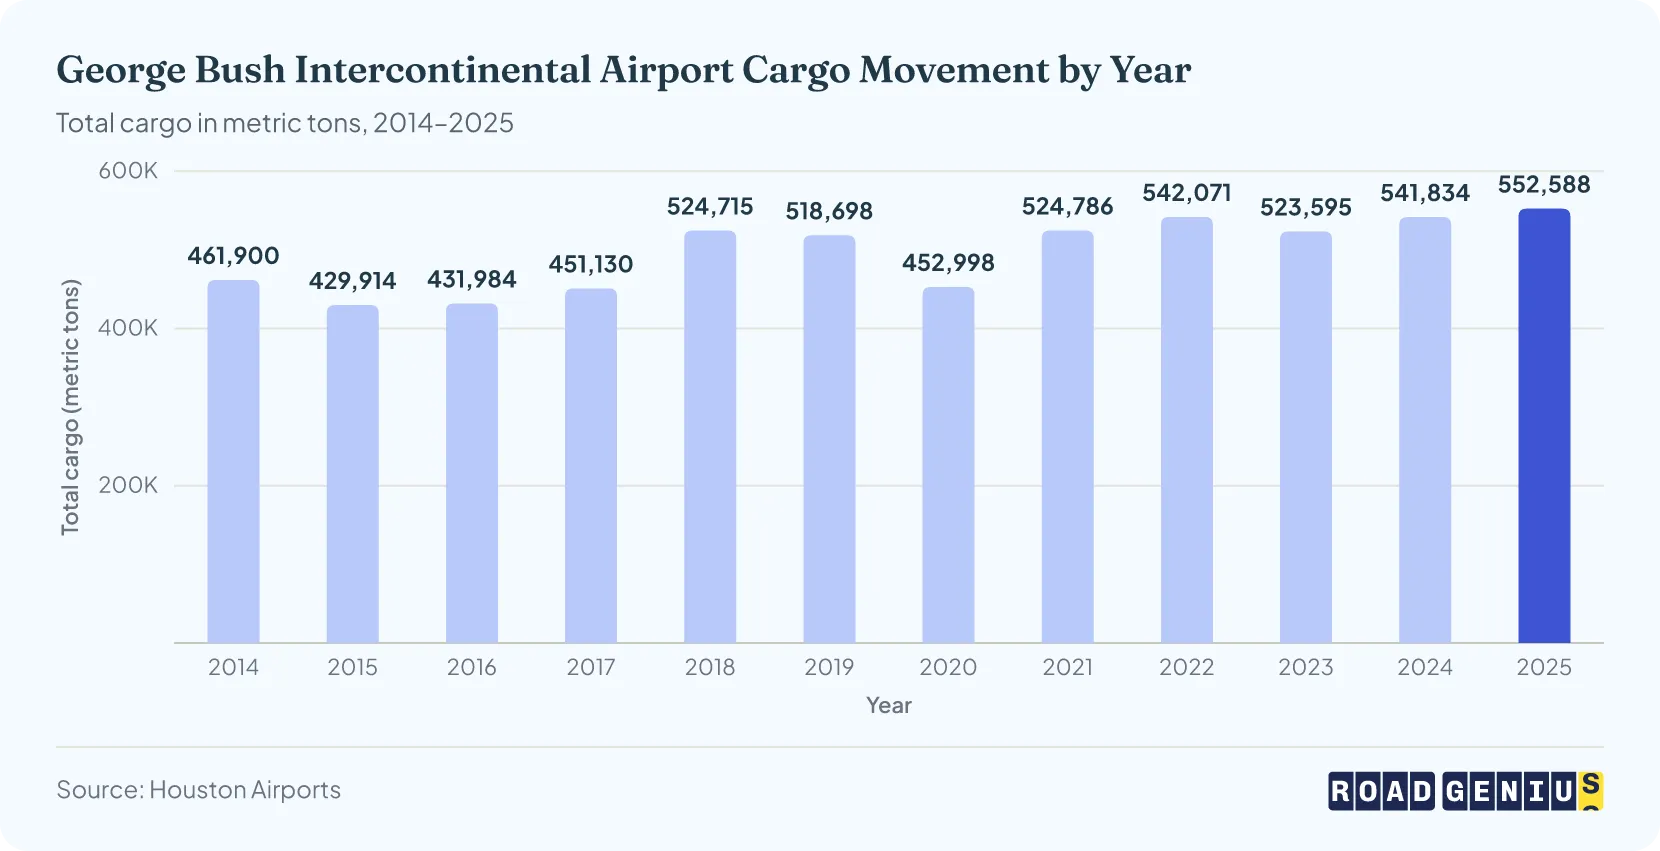
How much cargo moves through George Bush Intercontinental Airport each year?
George Bush Intercontinental Airport (IAH) now handles more than 550,000 metric tons of cargo a year.
Car and campervan rentals around Houston
- Austin, TX
- Dallas, TX
- Houston, TX
- Car Rental George Bush Intercontinental Airport (IAH)
- San Antonio, TX
- Texas
- Car Rental Texas
- Houston to Austin
- Houston to Galveston
- Houston to San Antonio
- Dallas to Houston
More Statistics
- Meadows Field Airport (BFL) Statistics
- Billings Airport (BIL) Statistics
- St. Pete-Clearwater Airport Statistics
- Eugene Airport (EUG) Statistics
- Atlanta Airport (ATL) Statistics
- Ithaca Tompkins International Airport Statistics
- LaGuardia Airport (LGA) Statistics
- Montrose Regional Airport (MTJ) Statistics
- Most Delayed US Airports
- Peoria Airport (PIA) Statistics
- T.F. Green International Airport Statistics
- Wichita Airport (ICT) Statistics
How does IAH compare with other US airports?
How often are flights on time at IAH?
In 2025, 78% of domestic flights at George Bush Intercontinental Airport (IAH) arrived on time and 76% departed on time.14
IAH vs Hobby: how do Houston's two airports compare?
IAH handled about 3.5 times as many passengers as William P. Hobby Airport (HOU), Houston's other commercial airport, in 2025, and nearly all of Houston's international traffic.
- Passengers (2025): IAH 48.13 million; Hobby 13.94 million4
- International passengers (2025): IAH 12.42 million (26% of its traffic); Hobby 0.87 million (6%)4
- Change from 2024: IAH down 0.7%; Hobby down 4.6%4
See the full Houston Hobby Airport statistics for Hobby's airlines, routes and trends.
What is the economic impact of Houston's airports, including IAH?
Houston's airports, including George Bush Intercontinental Airport (IAH), generate $40.6 billion a year in economic activity for the region, according to a 2024 study using 2023 data.
How much revenue does the Houston Airport System generate?
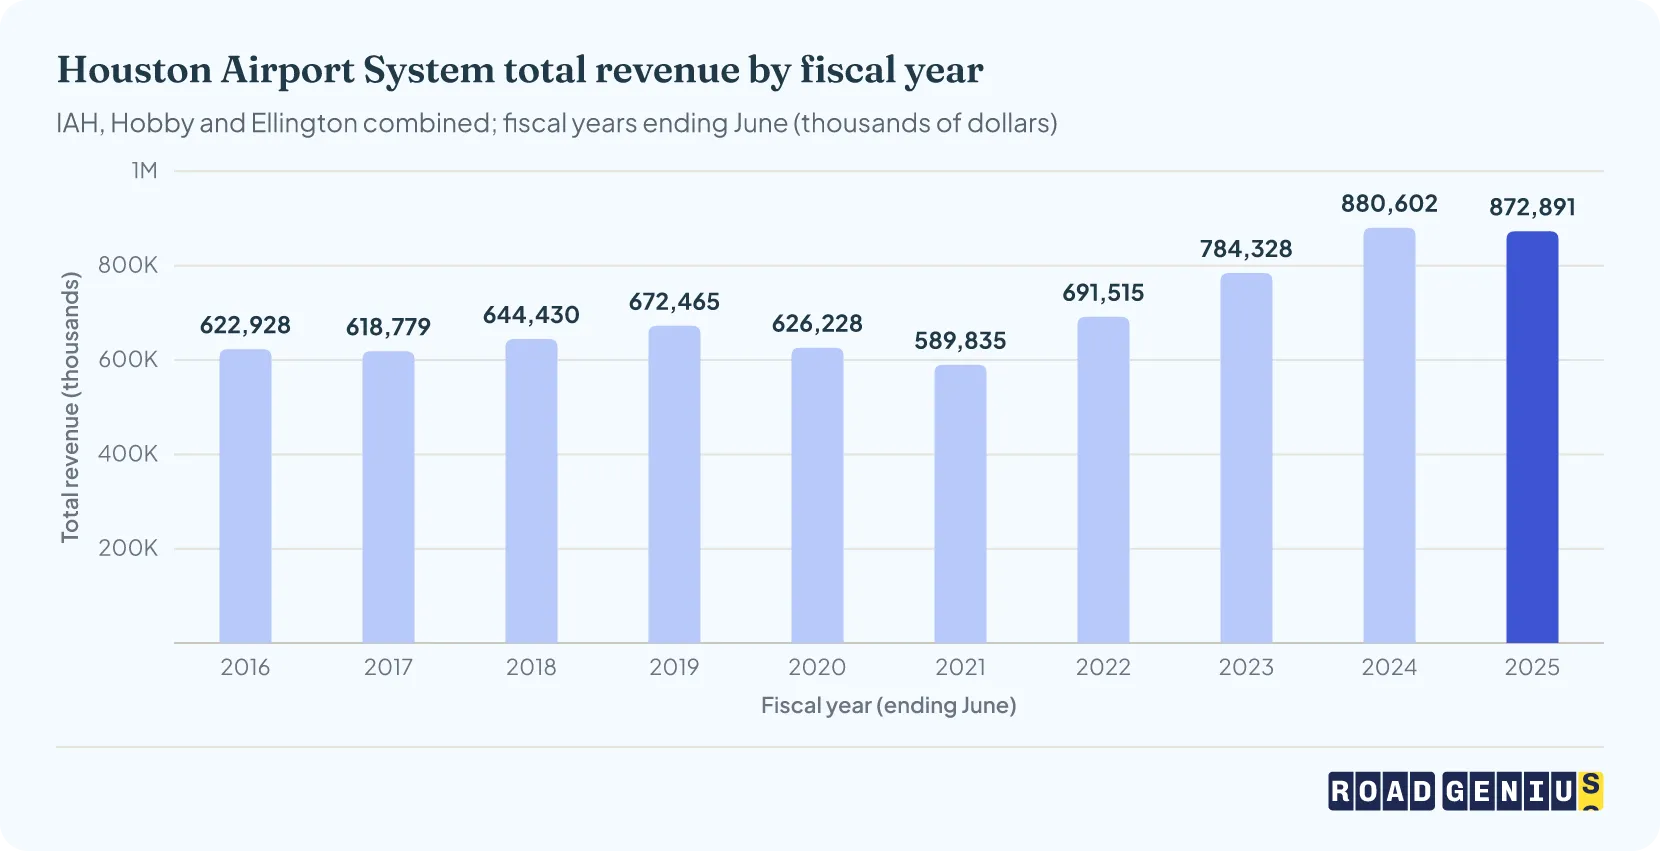
The Houston Airport System, which runs IAH, Hobby and Ellington airports, has brought in more than $870 million a year in each of the last two fiscal years.
- Total revenue was $872.89 million in fiscal year 2025 (year ending June), slightly below 2024's record but 30% above the 2019 level.
- Revenue climbed as travel recovered, from $691.52 million in fiscal year 2022 and $784.33 million in fiscal year 2023 to $880.60 million in fiscal year 2024, a 12% rise on the year before.
- Before the pandemic, revenue was $672.47 million in fiscal year 2019. It fell to $626.23 million in fiscal year 2020 and $589.84 million in fiscal year 2021 as COVID-19 restrictions cut air travel.
Houston Airports does not publish revenue for IAH on its own.
Houston Airport System Revenue in Fiscal Year 2025
Total revenue for fiscal year 2025 (year ending June) was $872.89 million.
- Operating revenue was $638.15 million (73%) and non-operating revenue $234.74 million (27%).
Houston Airport System Revenue in Fiscal Year 2024
Total revenue for fiscal year 2024 (year ending June) was $880.60 million.
- Operating activities brought in $595.56 million (68%) and non-operating sources $285.04 million (32%), including $46.74 million in federal COVID-relief grants.
References
- Houston Airport System Annual Comprehensive Financial Report, FY2025 (years ended June 30, 2025 and 2024) · downloads.ctfassets.net ↑ b c
- About Houston Airports · fly2houston.com ↑ b
- Houston Airports fast facts · fly2houston.com ↑
- ACI-NA 2025 North American Airport Traffic Summary (Top 50) · airportscouncil.org ↑ b c d e f g h i j
- ACI-NA 2024 North American Airport Traffic Summary (Top 50) · airportscouncil.org ↑ b c d
- ACI-NA 2023 North American Airport Traffic Summary (Top 50) · airportscouncil.org ↑ b
- Houston Airports Statistics dashboard (Power BI) — Houston Airports · app.powerbigov.us ↑ b c d e f g h i j k l
- PLAN AHEAD: Terminal E Construction Is Underway · fly2houston.com ↑
- Houston Airports closes 2025 with strong international growth, record cargo performance · fly2houston.com ↑ b
- International Air Traffic Maintains Growth Year to Date · houstonfirst.com ↑
- FAA Airport Data and Information Portal — IAH airport data · adip.faa.gov ↑ b
- How to Navigate IAH Airport: A First-Time Traveler's Guide to Houston's Bush Airport · fly2houston.com ↑
- FAA Air Traffic Activity Data System (ATADS) — Airport Operations report · aspm.faa.gov ↑ b c d
- BTS TranStats airport profile — Houston George Bush Intercontinental (IAH) · transtats.bts.gov ↑ b c d
- U.S. International Air Passenger and Freight Statistics Report, Fourth Quarter 2025 (year ended December 2025) · transportation.gov ↑
- FAA — Commercial Service Enplanements and Hub Classification, CY2024 · faa.gov ↑
- Multiple Airport Statistics: Different Airports from multiple countries — BGR#how-much-cargo-moves-through-bangor-0b603a · faa.gov ↑
- NEW: Houston's airports pump $40.6 billion into annual economy · fly2houston.com ↑ b c
- Fly2Houston — IAH Newsroom: Official Statistics and Press Releases · fly2houston.com
- BTS TranStats — Airport profiles (route information by airport) · transtats.bts.gov
