

 Popular Countries
 24/7 Support
Published Sep 9, 2026
St. Pete-Clearwater International Airport (PIE) serves the Tampa Bay area from its site in Pinellas County, Florida, and has seen substantial passenger growth over the past decade. The airport is located about 9 miles north of downtown St. Petersburg, and is home to a large airfield and terminal complex supporting commercial services and other aviation activity.
How many passengers use St. Pete-Clearwater International Airport each year?
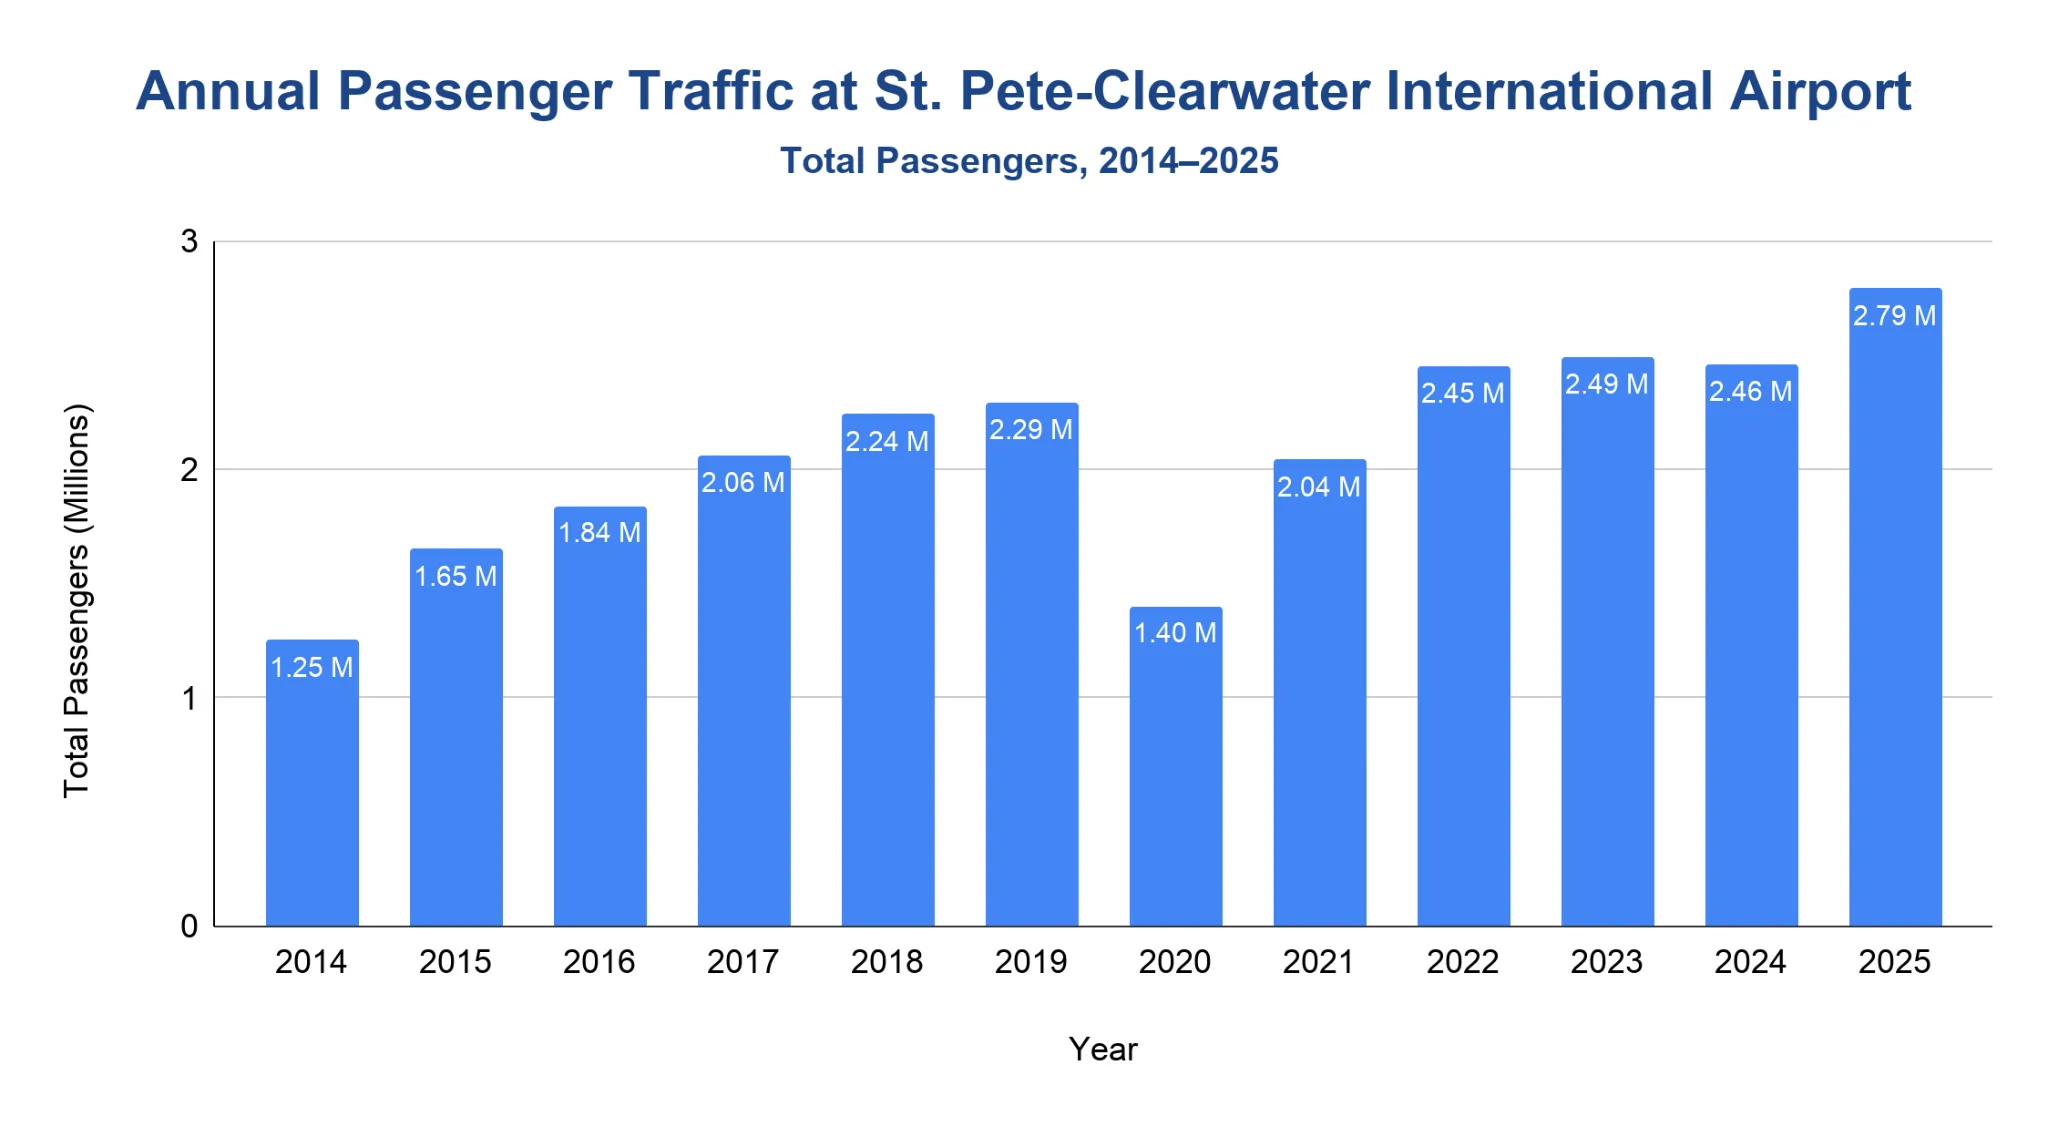
St. Pete-Clearwater International Airport handled about 2.79 million passengers in 2025, marking its busiest year on record and extending more than a decade of long-term growth.
- Traffic nearly doubled from 1.25 million passengers in 2014 to 2.49 million in 2023, which had previously been the airport’s busiest year.
- Prior to the pandemic, the airport saw consistent year-on-year growth, driven largely by expanding low-cost leisure routes.
- When the pandemic hit, passenger numbers fell to 1.40 million in 2020, before rebounding sharply to 2.04 million in 2021.
- Momentum continued with 2.45 million passengers in 2022 and 2.49 million in 2023, stabilizing at 2.46 million in 2024.
Does St. Pete-Clearwater International Airport handle domestic or international flights?
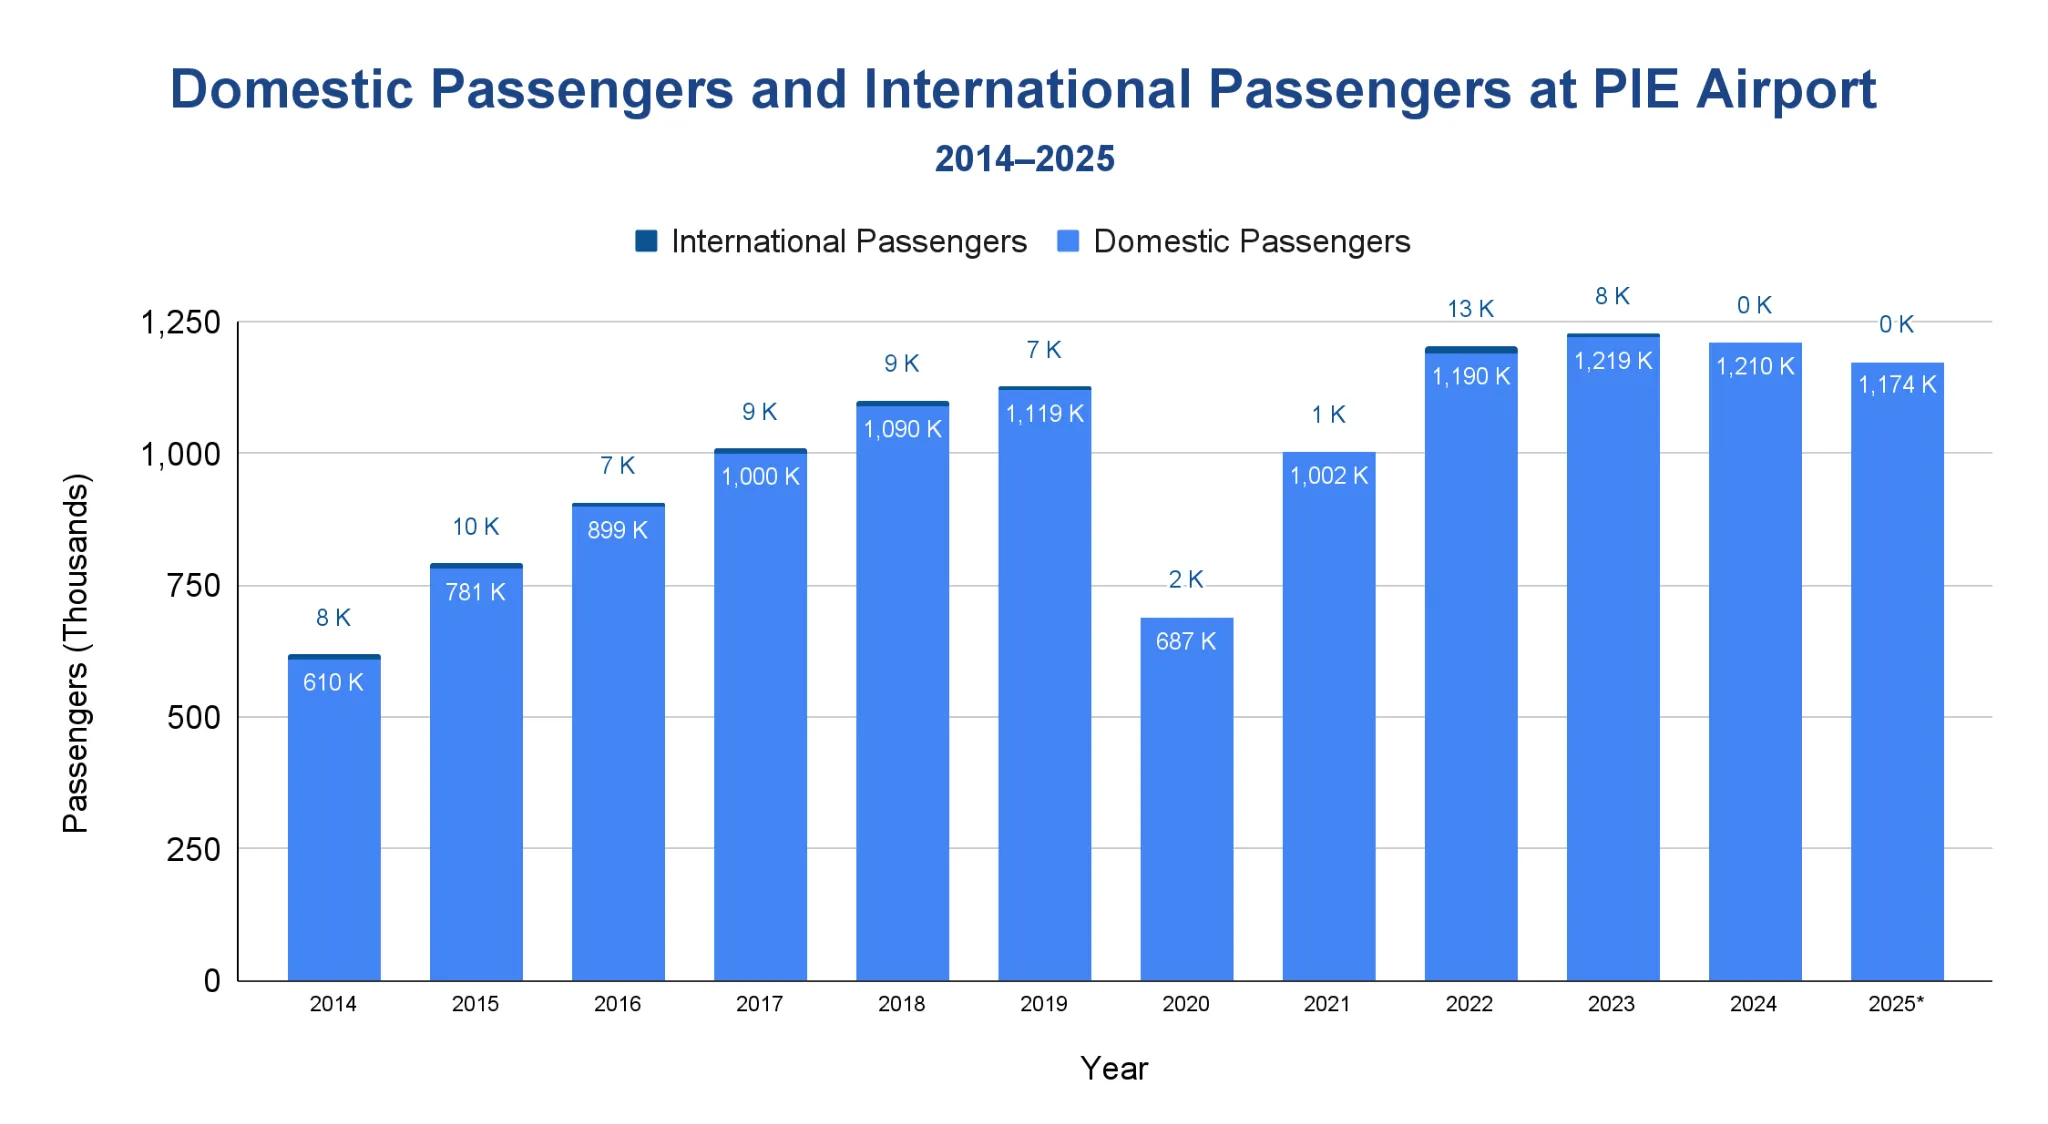
St. Pete-Clearwater International Airport is a predominantly domestic airport, with international passenger traffic accounting for only a very small share of total volume and disappearing entirely in recent years.
- From 2014 through 2019, PIE handled roughly 610,030 to 1.12 million domestic passengers per year, while international traffic typically totalled just 6,677 to 9,718 passengers annually, representing well under 1% of overall traffic.
- During the pandemic, domestic volumes fell sharply to 687,140 passengers in 2020 and recovered to 1 million in 2021, while international traffic dropped to just 2,189 in 2020 and 1,238 in 2021.
- A brief uptick occurred in 2022, when international traffic rose to 12,560 passengers, but domestic traffic still accounted for virtually all activity at 1.19 million passengers.
- In 2023, the airport handled 1.22 million domestic passengers compared with 8,108 international passengers.
- By 2024, international passenger counts fell to zero, while domestic traffic remained strong at 1.21 million passengers. The airport remained entirely domestic through October 2025, when it recorded 1.17 million domestic passengers and no international passengers.
How many aircraft operations occur at St. Pete-Clearwater International Airport each year?
St. Pete-Clearwater International Airport recorded about 175,000 aircraft operations in 2024, reflecting sustained growth in commercial activity and steady general aviation use.
- Annual aircraft operations rose from about 124,000 in 2014 to 143,000 in 2019, before declining during the pandemic.
- Traffic fell to about 126,000 operations in 2020, then rebounded steadily through 2021 and 2022.
- Operations climbed sharply in 2023 and 2024, reaching a post-pandemic high of 175,000 movements in 2024.
- In 2025, activity eased to about 150,000 operations through October, reflecting a moderation from the 2024 peak.
Note: Figures represent total aircraft operations as reported by the FAA Air Traffic Activity Data System (ATADS). 2025 data covers January–October only.
What types of aircraft operations occur at St. Pete-Clearwater International Airport?
Aircraft activity at St. Pete-Clearwater International Airport reflects a mixed-use profile, combining commercial airline service, general aviation, and a long-standing military presence.
- General aviation has historically accounted for the largest share of operations, though its activity has gradually declined from pre-2015 levels.
- Commercial airline operations expanded steadily over the past decade, rising from about 9000 air carrier movements in 2014 to about 16,000 in 2024.
- Military activity, primarily linked to U.S. Coast Guard operations, remained a consistent component of traffic, averaging 5000-9000 operations per year before tapering slightly in recent years.
- In 2025, total activity declined from the 2024 peak, with reductions visible across all major operation types through October.
| Aircraft Operations by Type at PIE | |||||
|---|---|---|---|---|---|
| Year | Air Carrier | Air Taxi | General Aviation | Military | Total Operations |
| 2014 | 9,015 | 2,687 | 48,651 | 9,158 | 123,559 |
| 2015 | 12,224 | 3,302 | 39,242 | 9,319 | 104,535 |
| 2016 | 13,840 | 3,643 | 41,987 | 8,596 | 113,103 |
| 2017 | 15,527 | 4,437 | 41,463 | 8,642 | 114,582 |
| 2018 | 15,524 | 4,571 | 44,626 | 8,876 | 134,478 |
| 2019 | 15,577 | 5,637 | 48,935 | 7,361 | 143,375 |
| 2020 | 12,308 | 4,933 | 42,820 | 6,828 | 125,553 |
| 2021 | 14,647 | 6,959 | 46,966 | 7,133 | 131,763 |
| 2022 | 15,220 | 8,870 | 50,949 | 6,471 | 146,494 |
| 2023 | 15,480 | 19,979 | 44,717 | 5,935 | 165,665 |
| 2024 | 16,032 | 23,162 | 43,106 | 5,675 | 175,093 |
| 2025* | 16,455 | 22,077 | 41,183 | 4,763 | 150,280 |
Source · Figures represent total aircraft operations by type as reported by the FAA Air Traffic Activity Data System (ATADS). 2025 data reflects January–October only.
Which airlines carry the most passengers at St. Pete-Clearwater International Airport?
St. Pete-Clearwater International Airport continues to be overwhelmingly dominated by Allegiant Air, which carried about 2.71 million passengers between November 2024 and October 2025, accounting for nearly all scheduled airline traffic at the airport.
- Allegiant Air transported more than 99% of all passengers, reinforcing PIE’s role as one of the airline’s most concentrated leisure-focused bases.
- Sun Country Airlines accounted for a very small share, carrying about 13,000 passengers, primarily on limited seasonal service.
- No other scheduled airlines contributed a measurable share of passenger traffic during the period.
| Airline Market Share at PIE | ||
|---|---|---|
| Airline | Passengers (000s) | Market Share |
| Allegiant Air | 2,711 | 99.54% |
| Sun Country | 13 | 0.46% |
| Other | 0 | 0.00% |
Source · Passenger figures are reported in thousands for the November 2024 through October 2025 period, based on major U.S. carrier data.
What are the most popular destinations from St. Pete-Clearwater International Airport?
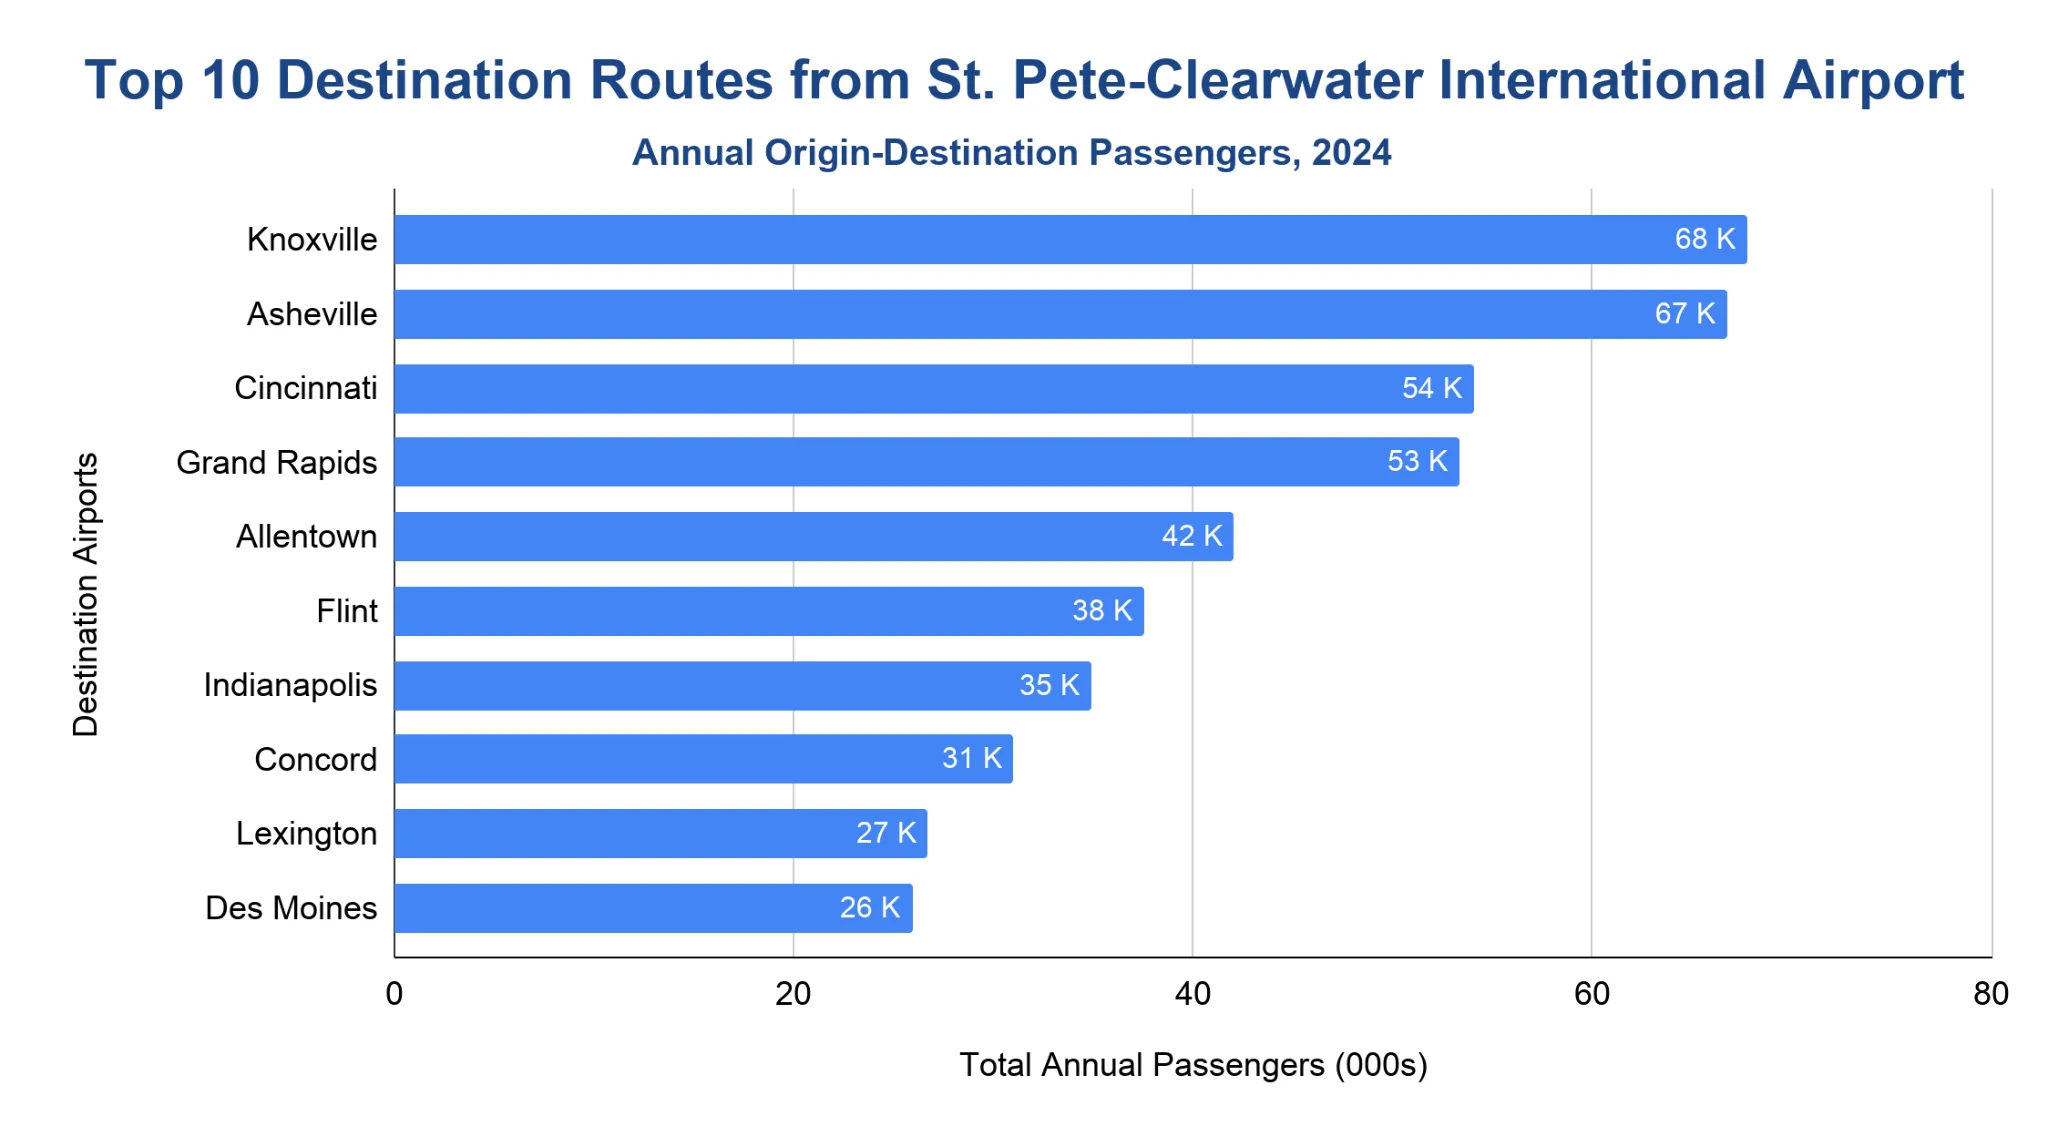
St. Pete-Clearwater International Airport’s route network is heavily oriented toward mid-sized U.S. cities, with traffic spread across a range of domestic markets.
- Knoxville and Asheville ranked as the busiest destinations in 2024, each handling around 65,000-70,000 passengers.
- Several Midwestern markets featured prominently, including Cincinnati, Grand Rapids, Indianapolis, and Des Moines.
- Secondary leisure and regional routes such as Allentown, Flint, Concord, and Lexington rounded out the top ten.
- No single destination dominated traffic, indicating a broadly distributed route mix rather than reliance on one or two trunk routes.
Peak Travel Months at St. Pete-Clearwater International Airport
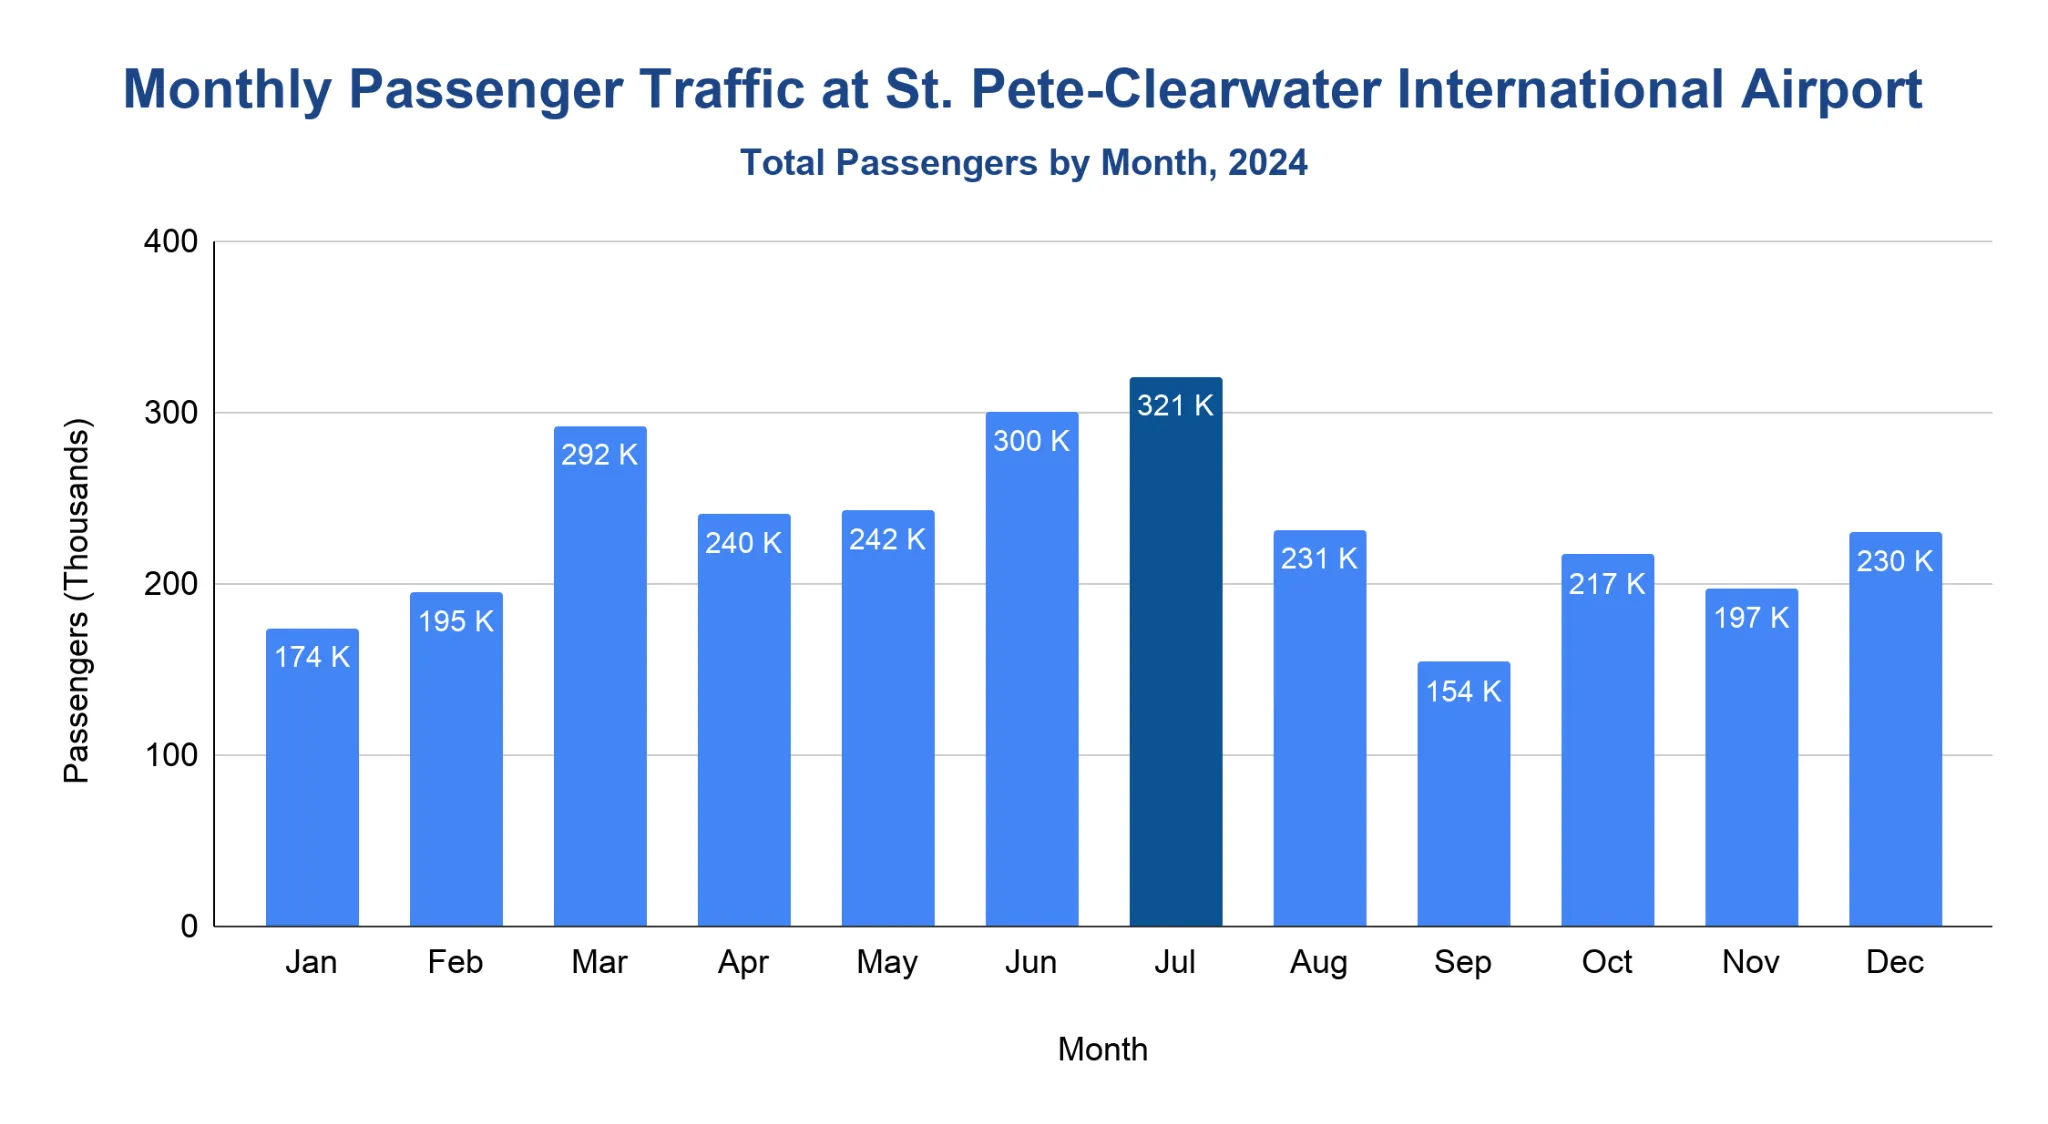
St. Pete-Clearwater International Airport saw its strongest passenger volumes during the summer travel season in 2025, with peak activity concentrated in early and mid-summer months.
- July was the busiest month of the year, handling about 321,000 passengers, setting the annual peak.
- June followed closely with around 300,000 passengers, reflecting strong summer leisure demand.
- March also stood out as a high-traffic month at about 292,000 passengers, driven by spring break travel.
- Passenger volumes dipped in early fall, with September recording the lowest traffic of the year at about 154,000 passengers.
- Traffic rebounded toward year-end, climbing to about 230,000 passengers in December as holiday travel increased.
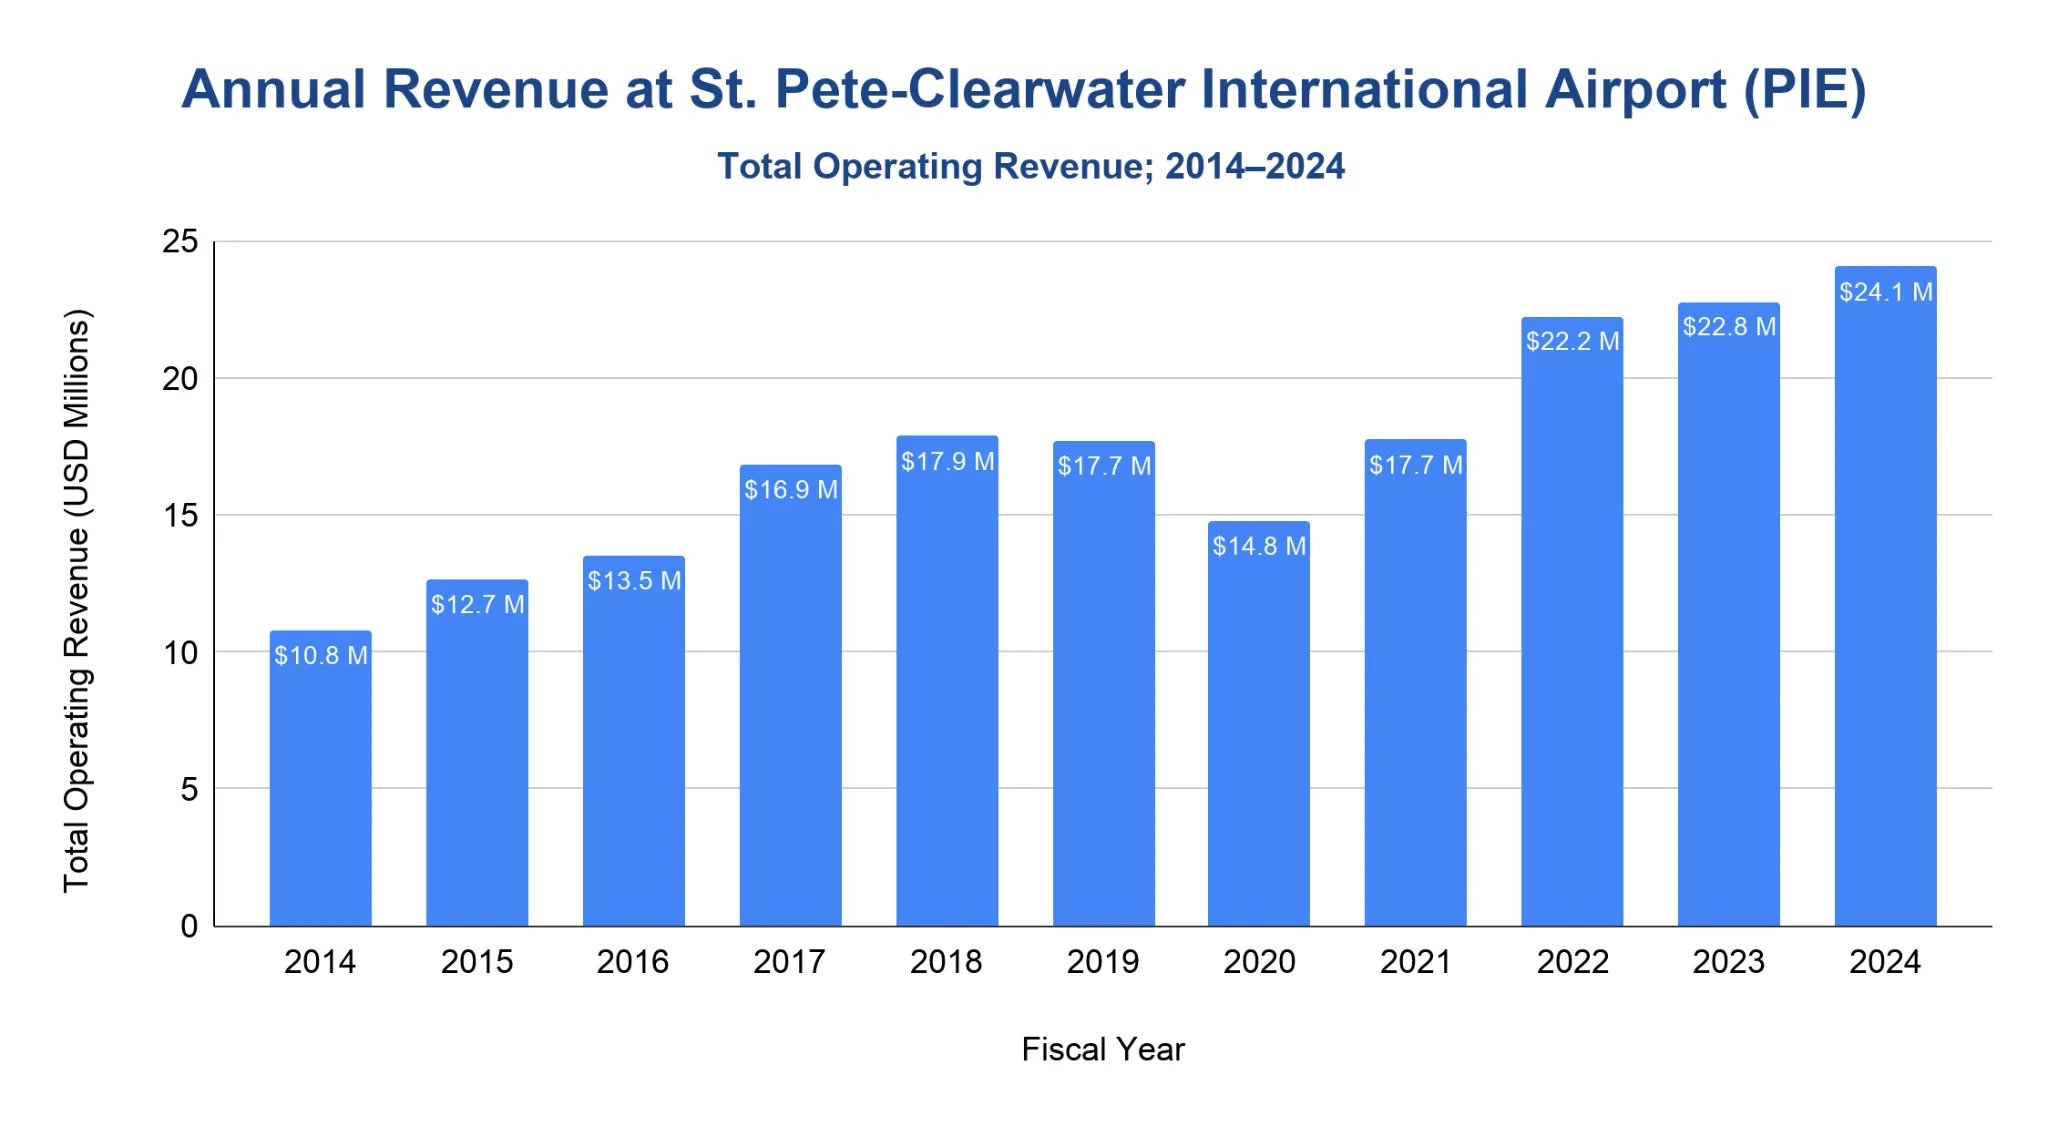
How much revenue does St. Pete-Clearwater International Airport generate each year?
St. Pete-Clearwater International Airport generated about $24.1 million in operating revenue in fiscal year 2024, reflecting strong post-pandemic growth driven by rising passenger volumes and commercial activity.
- Operating revenue increased from about $10.8 million in 2014 to nearly $17.9 million by 2018, supported by expanding airline service and non-aeronautical income.
- Revenue dipped slightly in 2019 and fell more sharply in 2020 as the pandemic reduced air travel demand.
- A strong recovery followed, with operating revenue rebounding to about $17.7 million in 2021 and surging past $22 million in 2022.
- Growth continued through 2023 and 2024, with revenue reaching its highest level to date in FY2024.
- Fiscal year 2025 data has not yet been filed and is therefore not included.
What is the economic impact of St. Pete-Clearwater International Airport?
St. Pete-Clearwater International Airport supports about 20,800 jobs and generates about $3.4 billion in total economic output, reflecting the airport’s role as a major regional economic engine.
- The airport supports about 20,800 jobs tied to airport-related activity.
- Payroll associated with airport impacts totals about $1.0 billion.
- The airport contributes about $1.8 billion in value added to the economy.
- Total economic impact (output) is about $3.4 billion.
| Economic Impact of PIE Airport (2022) | |
|---|---|
| Economic Indicator | Value |
| Jobs Supported | 20,774 |
| Payroll | $1.0B |
| Value Added | $1.8B |
| Economic Impact (Output) | $3.4B |
Source · Values are published by the Florida Department of Transportation (FDOT) Aviation Office as part of the 2022 Statewide Aviation Economic Impact Study (2022 AEIS).
What is St. Pete-Clearwater International Airport's on-time performance?
St. Pete-Clearwater International Airport posted about 80% on-time departures and about 76% on-time arrivals in the most recent reporting period (November 2024 through October 2025), based on major U.S. carriers only.
- On-time performance improved compared with 2024, rising from 77% to 80% for departures and from 73% to 76% for arrivals.
- Average delays remained significant when disruptions occurred, with about 69 minutes for delayed departures and about 106 minutes for delayed arrivals in the latest period.
- Cancellations dropped to about 1.1% in the most recent period, down from 2.6% in 2024.
- The latest period includes 1,433 flights, reflecting partial-year reporting for the November 2024-October 2025 window.
| Airport On-Time Performance at PIE | ||||||
|---|---|---|---|---|---|---|
| Metric | 2020 | 2021 | 2022 | 2023 | 2024 | 2025* |
| On-Time % (Departure) | 75% | 75% | 72% | 81% | 77% | 80% |
| On-Time % (Arrival) | 73% | 67% | 62% | 76% | 73% | 76% |
| Avg Delay (min.) (Departure) | 71.48 | 66.57 | 70.35 | 69.96 | 76.50 | 69.45 |
| Avg Delay (min.) (Arrival) | 79.23 | 71.93 | 71.77 | 81.41 | 101.96 | 106.25 |
| % Cancelled (Total) | 12.41% | 2.11% | 3.45% | 0.38% | 2.63% | 1.05% |
| Number of Flights (Total) | 7,189 | 7,627 | 7,825 | 7,705 | 8,303 | 1,433 |
| Reporting Carriers | 1 | 1 | 1 | 1 | 1 | 1 |
Source · 2025 values reflect the most recent 12-month period available (November 2024 through October 2025) and include major U.S. carriers only. A flight is considered delayed if it arrives or departs 15 minutes or more after the scheduled time; average delay minutes reflect delayed flights only. BTS publishes average delays in decimal-minute format. As such, the values have been kept exactly as reported to avoid altering the underlying data.
Major Expansion Projects at St. Pete-Clearwater International Airport
St. Pete-Clearwater International Airport is advancing a Terminal Improvement Project designed to expand terminal capacity and improve passenger amenities to support continued growth.
- In spring 2024, PIE competitively procured C&S Companies and Gensler & Associates as the project design team.
- Manhattan Construction Company, LLC was also competitively procured as Construction Manager at Risk (CMAR) to assist with design and construction delivery.
- The total project budget is $110 million, funded through FAA and FDOT grants and airport reserve funds.
- Planned improvements include added space for hold rooms, restrooms, concessions, and associated public areas, along with expansion of the outgoing baggage make-up area and other terminal efficiency upgrades.
- Vendor opportunities related to the project are expected to be posted in early 2026.
Note: Project details are based on the official PIE Terminal Improvement Project page (2024).
What is St. Pete-Clearwater International Airport's safety record?
Two fatal general aviation accidents investigated by the National Transportation Safety Board (NTSB) are documented in the available reports for PIE.
- In July 1993, a Beech C23 (N60093) crashed while maneuvering to land after a go-around, resulting in 3 fatalities and 1 serious injury.
- In September 2015, a Piper PA-30 (N21ND) crashed during takeoff, resulting in 1 fatality.
| Safety Record at PIE | |||||
|---|---|---|---|---|---|
| Date | Accident No. | Aircraft | Fatalities | Serious Injuries | NTSB probable cause (short) |
| Jul 25, 1993 | MIA93FA163 | Beech C23 (N60093) | 3 | 1 | Failure to maintain adequate airspeed during go-around → inadvertent stall. |
| Sep 30, 2015 | ERA15FA378 | Piper PA-30 (N21ND) | 1 | 0 | Failure to maintain single-engine minimum controllable airspeed after loss of right engine power during initial climb. |
Source · NTSB Aviation Investigation Final Reports for accidents MIA93FA163 and ERA15FA378.
Related Travel Statistics
- Buffalo Airport (BUF) Statistics
- Burlington Airport (BTV) Statistics
- Eastern Iowa Airport Statistics
- El Paso International Airport (ELP) Statistics
- Fayetteville Regional Airport Statistics
- Hilton Head Island Airport (HHH) Statistics
- Jackson Airport (JAN) Statistics
- JFK Airport Statistics
- Midway International Airport Statistics
- Missoula Montana Airport (MSO) Statistics
- Philadelphia International Airport Statistics
- San Antonio International Airport Statistics
How does St. Pete-Clearwater International Airport rank among U.S. airports?
St. Pete-Clearwater International Airport ranked 95th in the United States by commercial-service enplanements in calendar year 2024, placing it in the small-hub category under FAA classifications.
- In 2024, PIE recorded about 1.23 million enplanements, slightly below its 2023 level of about 1.25 million.
- The FAA classifies PIE as a primary commercial service airport and a small hub, based on its share of total U.S. passenger boardings.
- Rankings are based on enplanements (passenger boardings) rather than total passengers, which include both arrivals and departures.
| PIE Airport Rankings and Metrics (2024) | |
|---|---|
| Metric | Value |
| U.S. Rank (Commercial Service Enplanements) | 95 |
| Hub Category (FAA) | Small Hub (Primary) |
| CY2024 Enplanements | 1,228,048 |
| CY2023 Enplanements | 1,246,323 |
| Percent Change (2024 vs 2023) | -1.47% |
Source · Rankings and enplanement figures are based on the FAA’s commercial-service airport statistics for calendar year 2024.
References
- PIE — Passenger Statistics and Terminal Improvement Project Details (2014–2025) · fly2pie.com
- FAA Passenger Boarding and All-Cargo Data Master · faa.gov
- FAA ASPM — ATADS Aircraft Operations By Year and Type (2014–2025) · aspm.faa.gov
- FAA CATS — total operating revenue data (2014–2025) · cats.airports.faa.gov
- Bureau of Transportation Statistics — LAS Performance Data and Route Information · bts.gov
- Florida DOT — Aviation Economic Impact Study Executive Summary (2018-2019, 2022) · fdot.gov
- NTSB CAROL — Aviation Accident and Incident Database (2016–Present) · data.ntsb.gov

