

 Popular Countries
 24/7 Support
Published Sep 9, 2026
San Antonio International Airport (SAT) is the primary airport serving the seventh-largest city in Texas. It functions as a major air gateway for South-Central Texas, connecting the region to destinations across the United States, Mexico and select international locations through multiple partner airlines.
How many passengers pass through San Antonio International Airport each year?
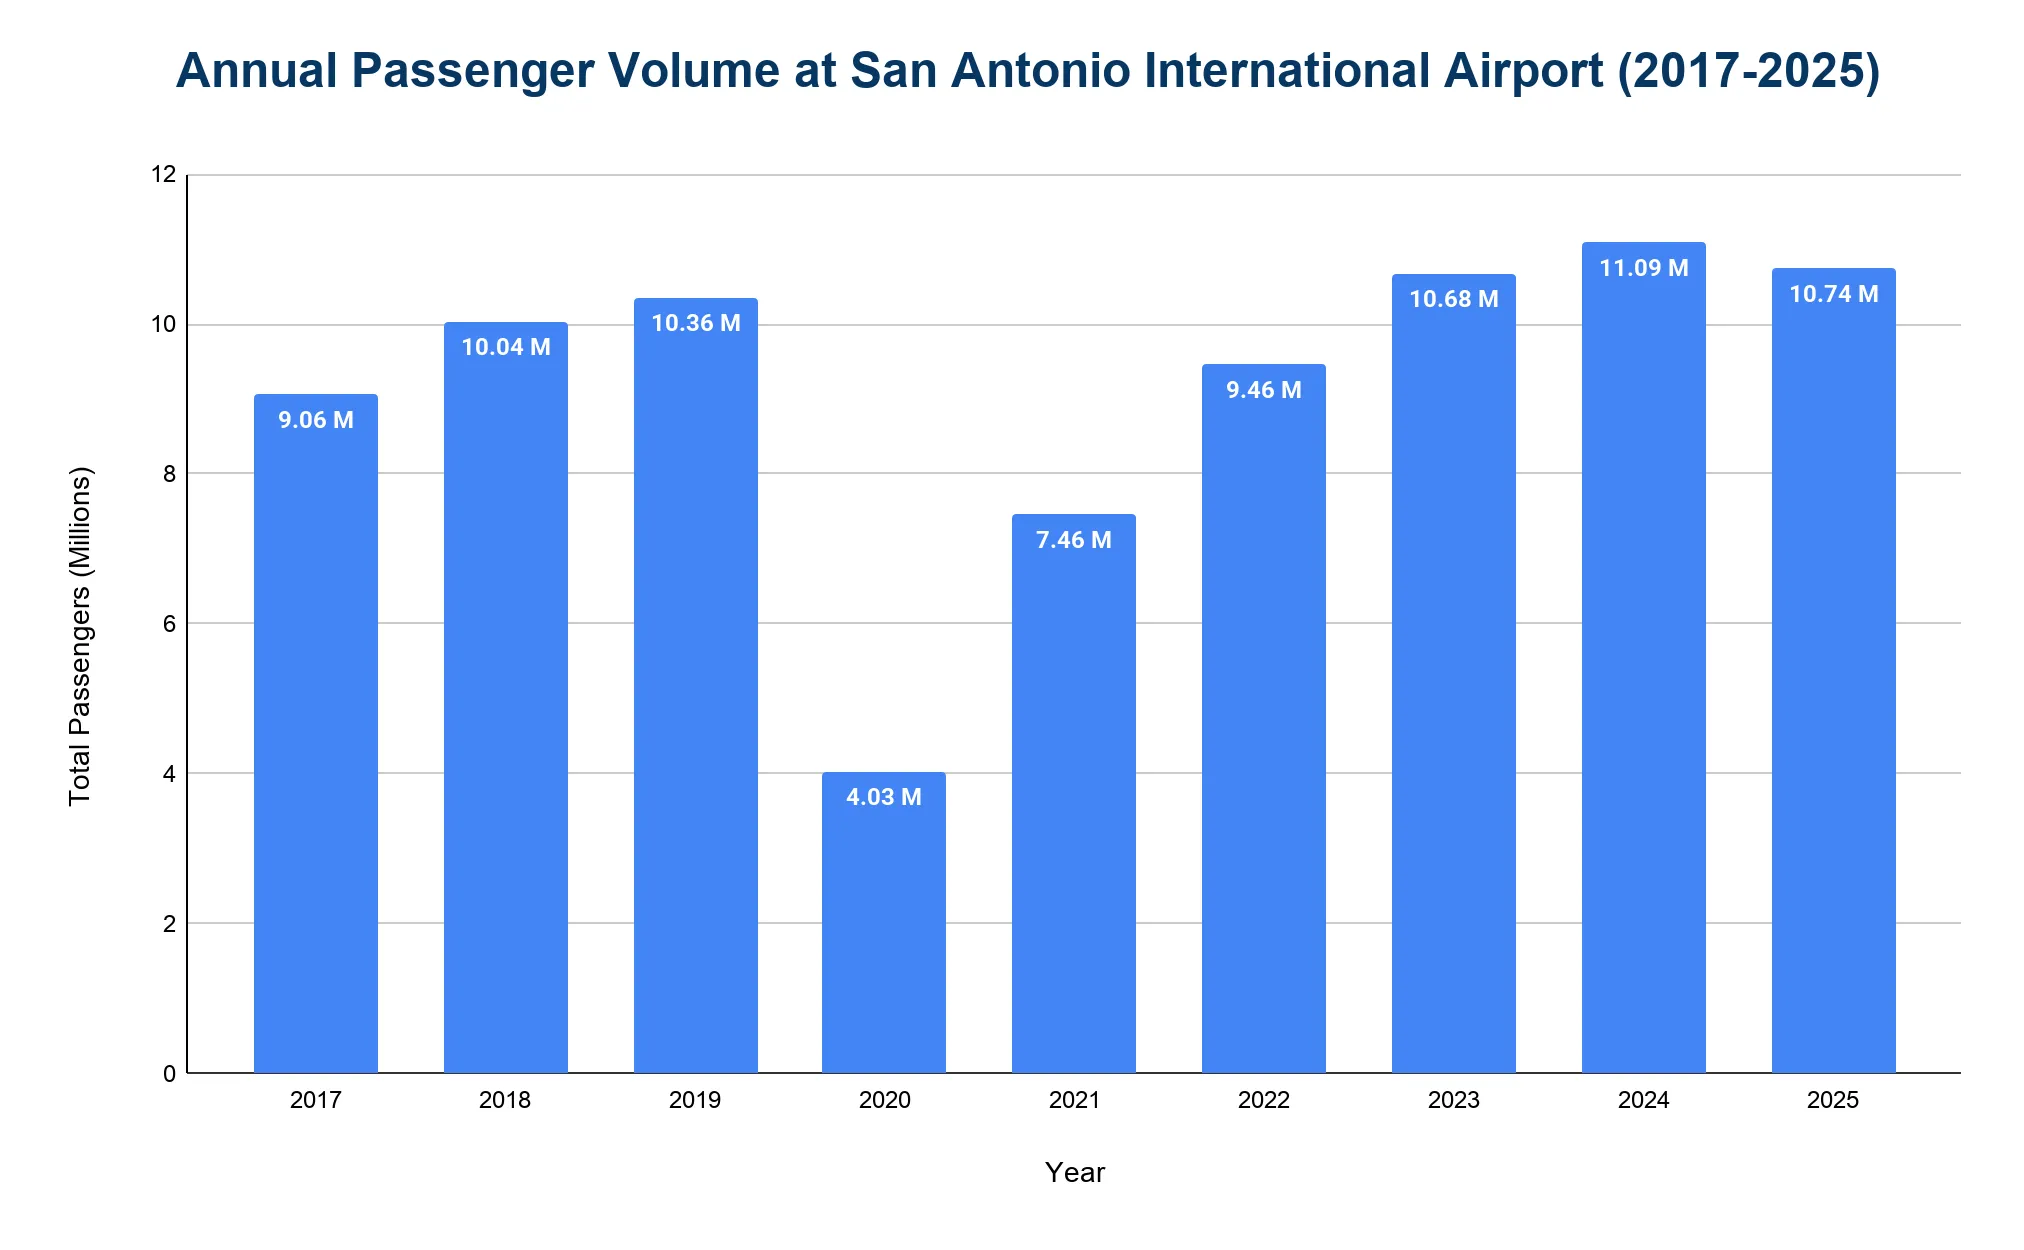
San Antonio International Airport handles over 10 million passengers annually.
- SAT recorded 10.74 million passengers in 2025, a 3.2% decrease from the previous year.
- In 2019, SAT handled 10.36 million passengers before the pandemic.
- Passenger traffic dropped sharply in 2020 to 4.03 million (a 61% decline), then recovered to 7.46 million in 2021.
- Growth resumed in 2022 with 9.46 million passengers, followed by 10.68 million in 2023.
- The airport served 11.09 million passengers in 2024, surpassing its previous record and marking the first year it exceeded 11 million.
What is the total number of aircraft operations at San Antonio International Airport each year?
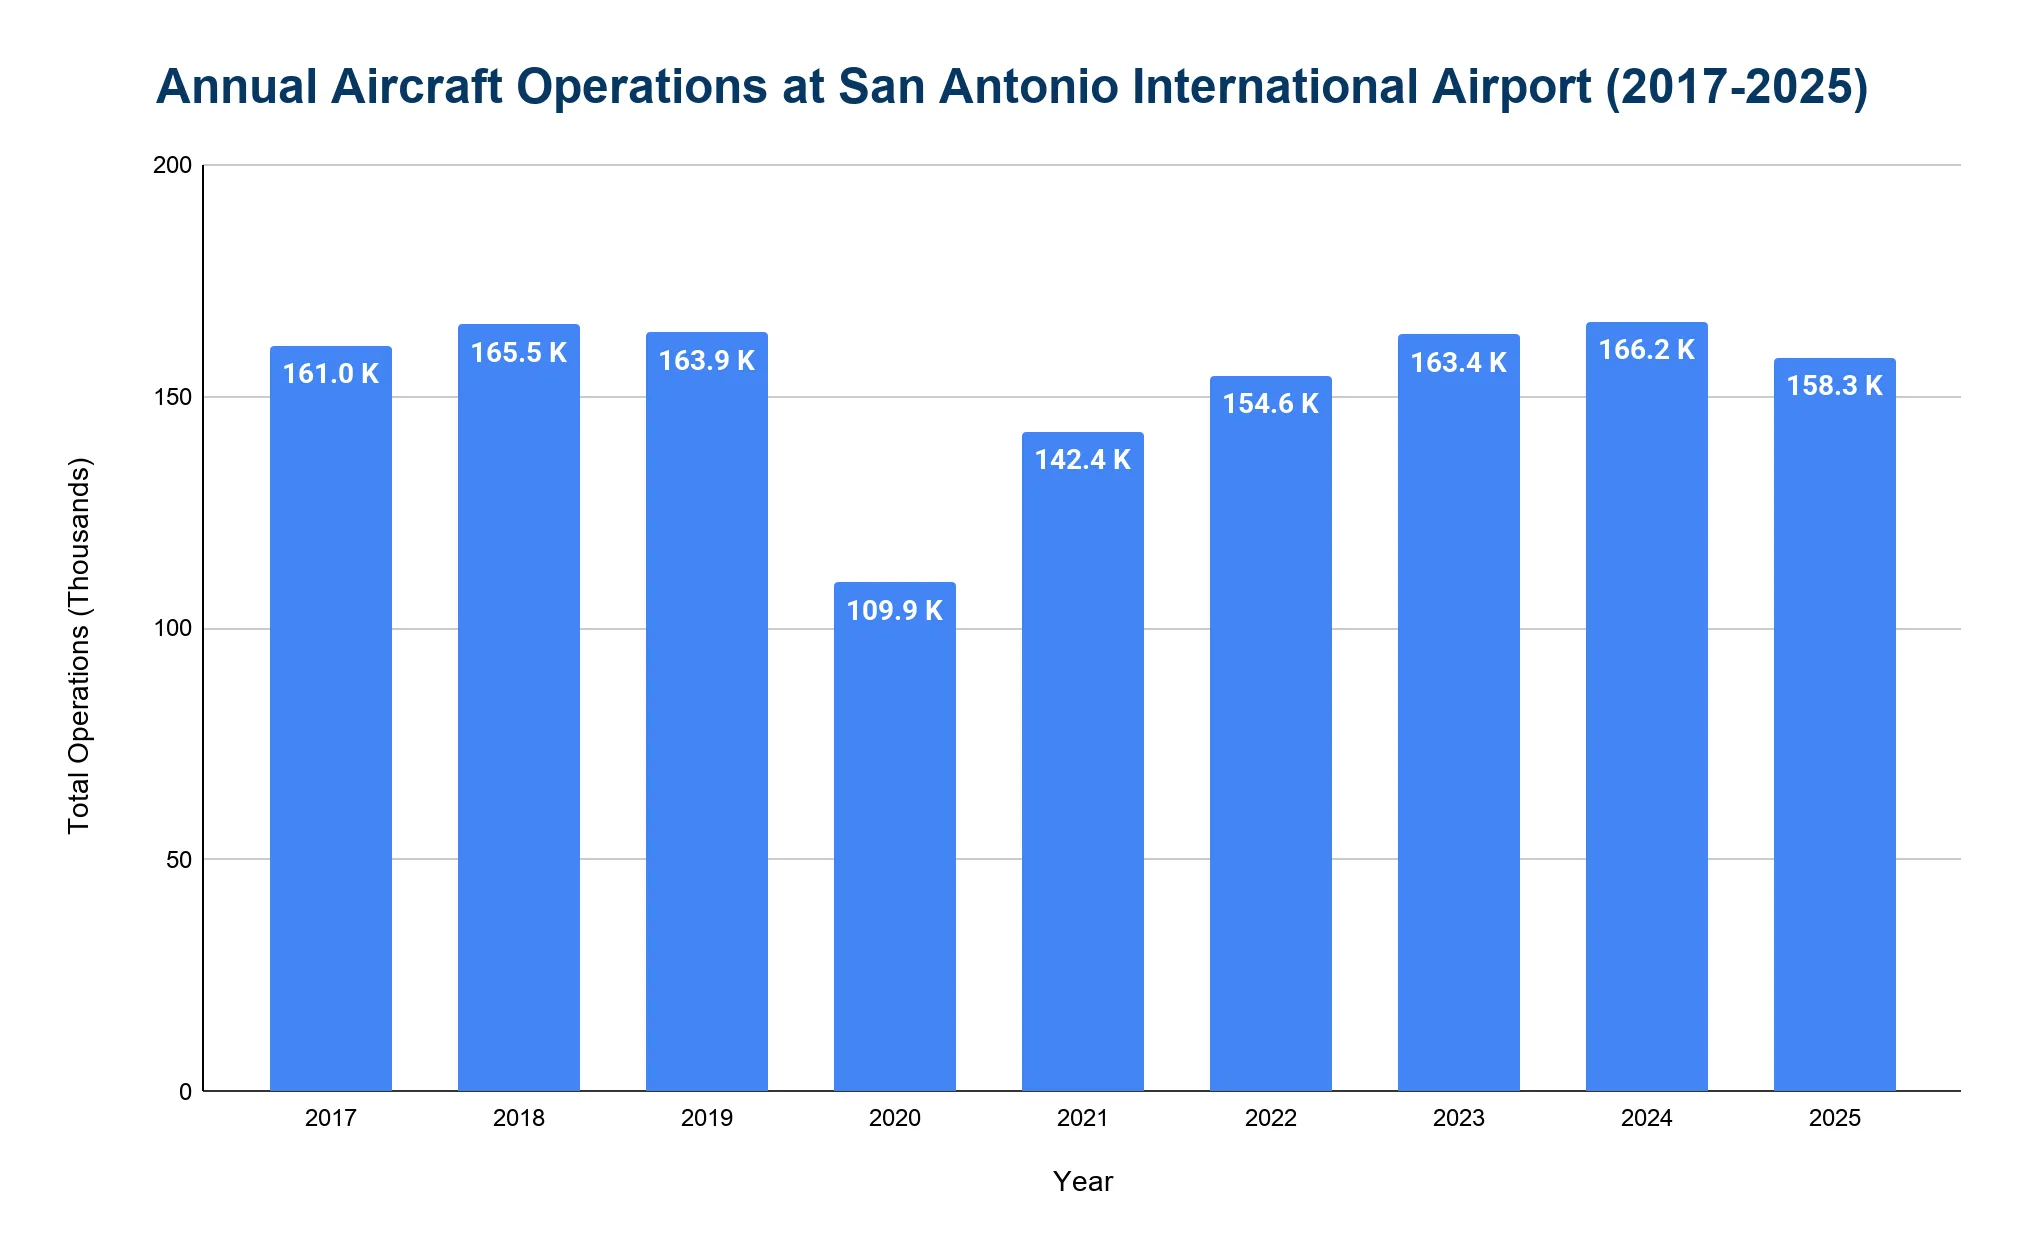
San Antonio International Airport sees over 150,000 annual aircraft operations, including commercial, general aviation and military flights.
- In 2025, there were 158,290 total aircraft movements, a 4.8% decline from 166,246 movements in 2024.
- In 2019, movements reached 163,870.
- Operations dropped to 109,864 in 2020, the lowest during the pandemic.
- Recovery continued with 142,374 in 2021, 154,586 in 2022 and 163,414 in 2023.
Which airlines operate the most flights out of San Antonio International Airport?
Domestic Market
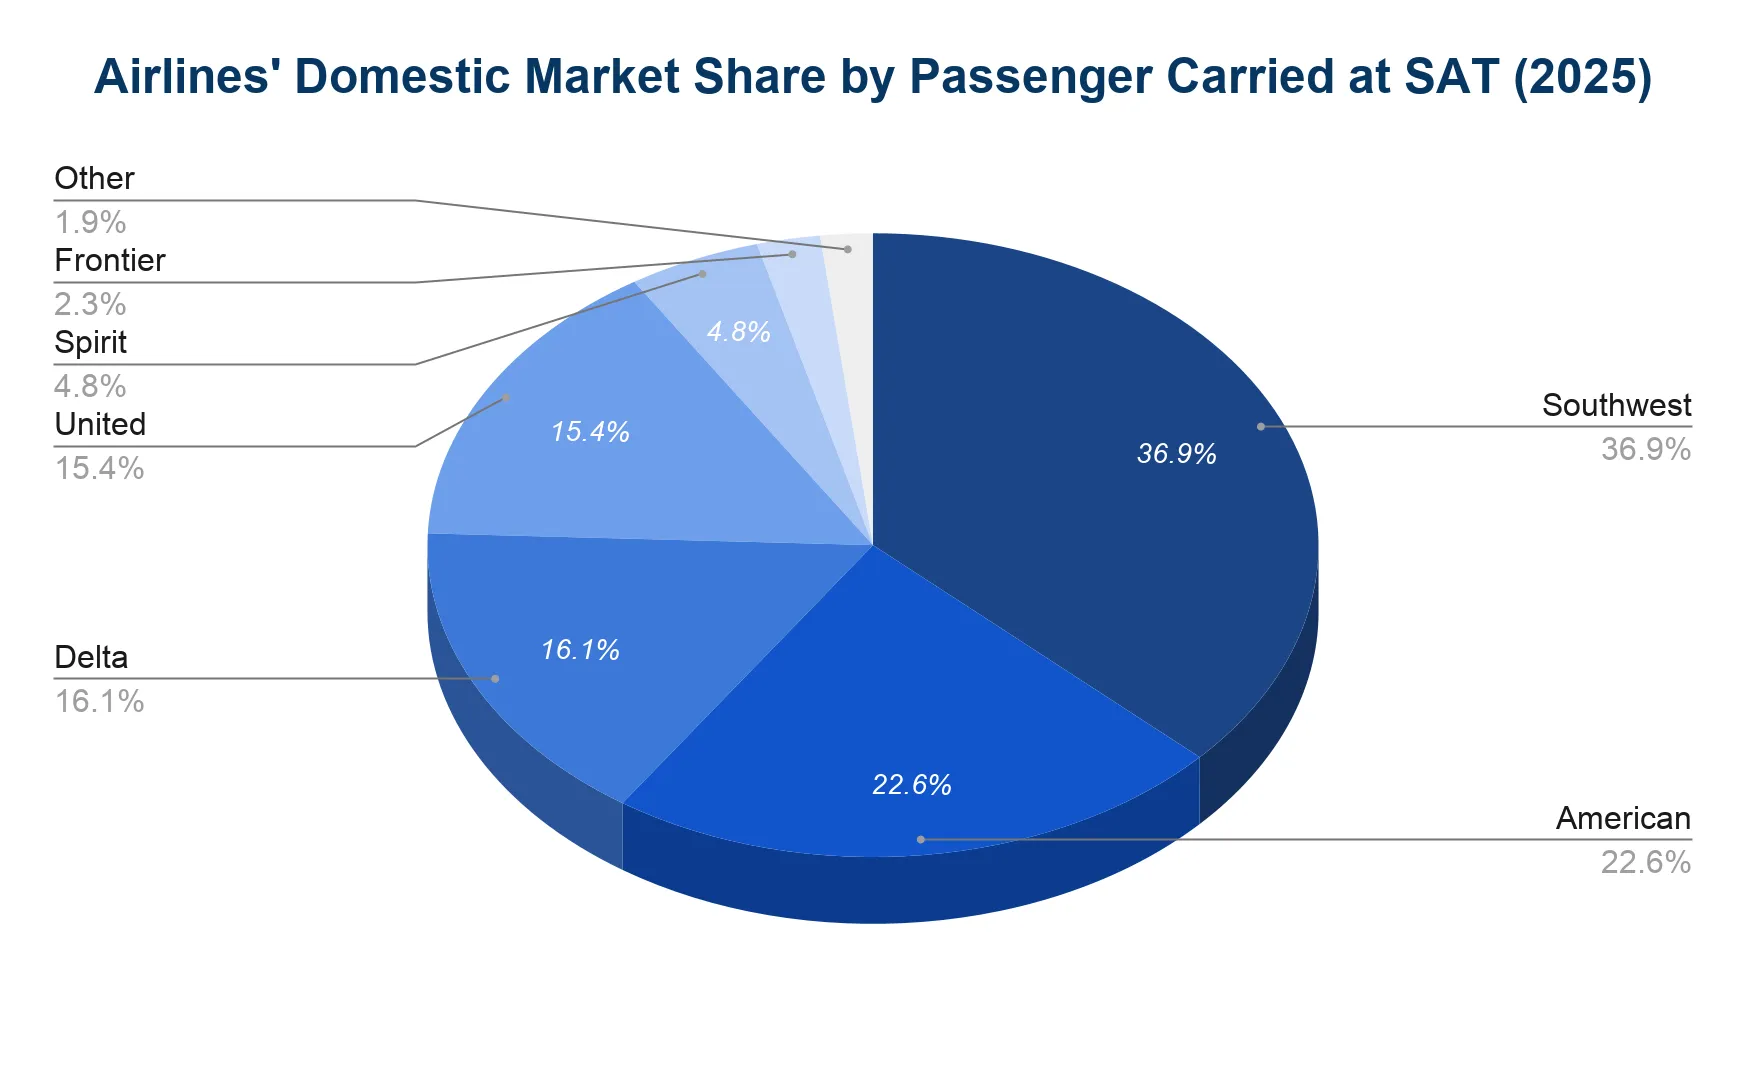
- In 2025, Southwest Airlines led domestic operations with 36.9% market share, making it the dominant carrier for U.S. flights.
- American Airlines held 22.6%, representing the second-largest domestic market share.
- Delta Air Lines accounted for 16.1%, followed by United Airlines with 15.4%.
- Spirit Airlines held 4.8%, representing significant ultra-low-cost carrier presence.
- Frontier Airlines accounted for 2.3%, with other carriers representing 1.9% of domestic traffic.
International Market
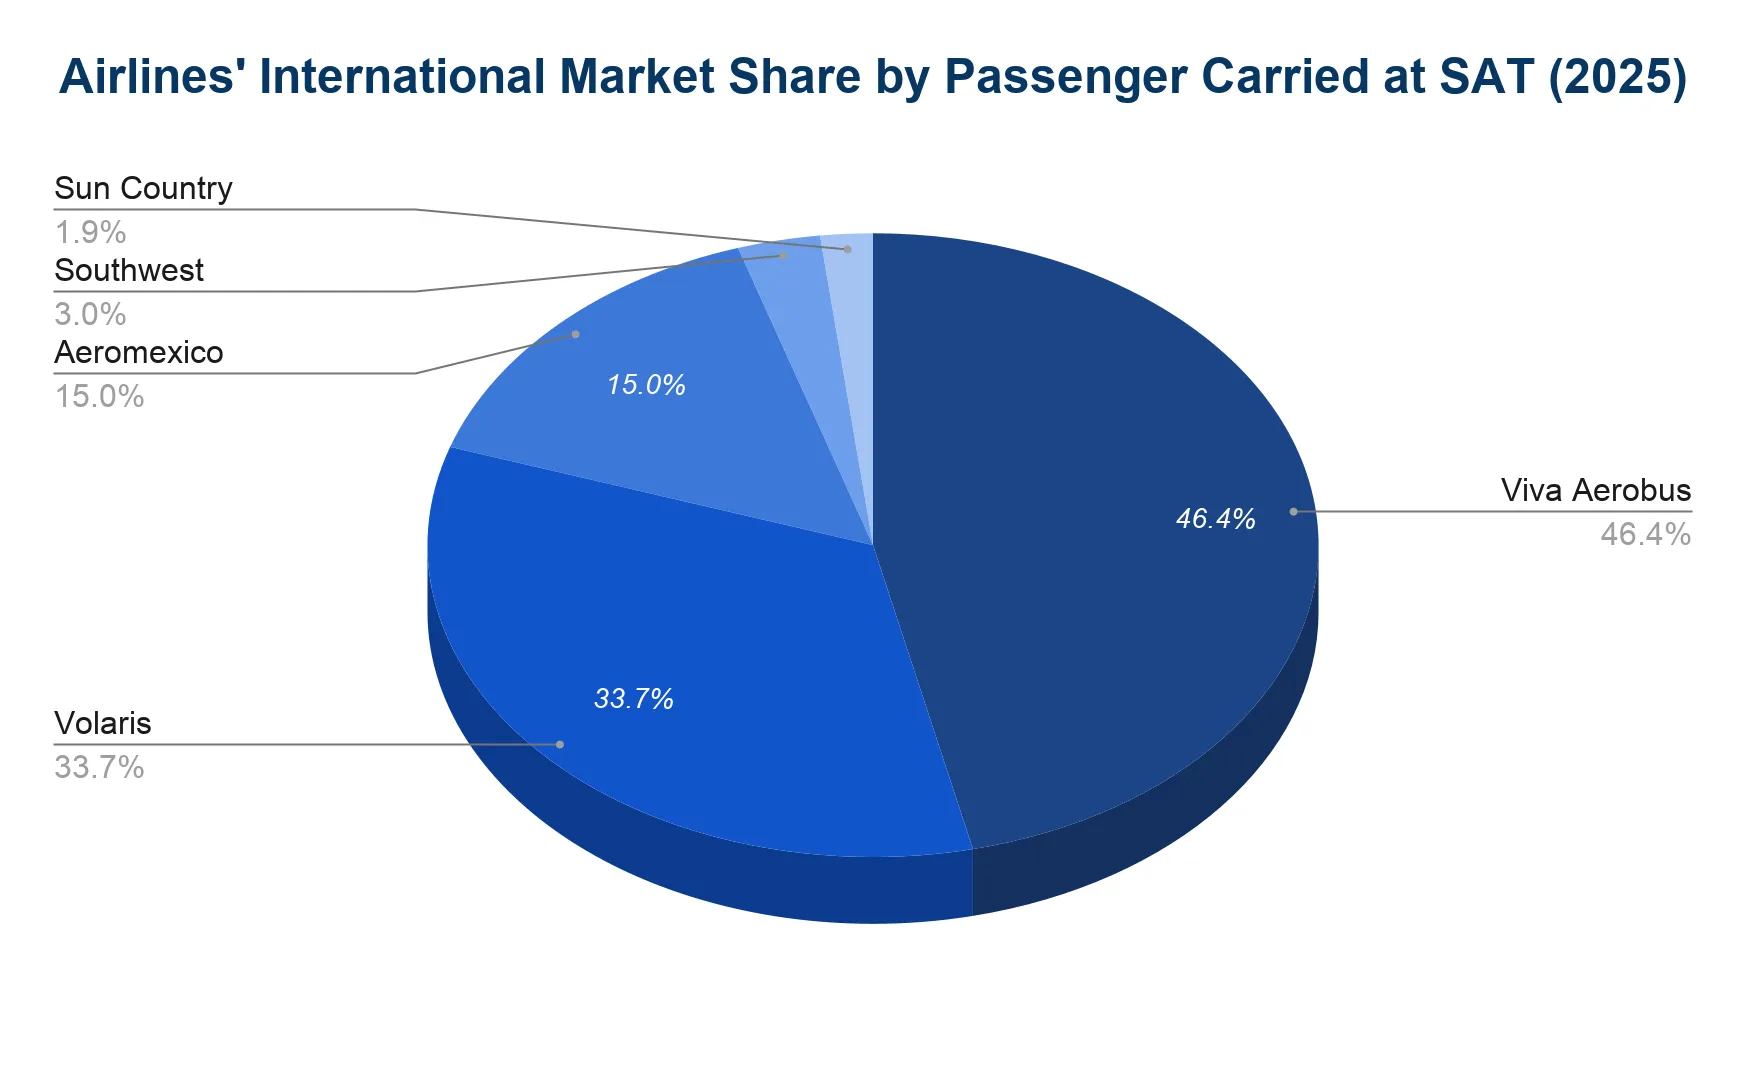
- Viva Aerobus dominated international operations with 46.4% market share, making it the largest international carrier.
- Volaris held 33.7%, establishing Mexican low-cost carriers as the primary international operators.
- Aeromexico accounted for 15%, representing traditional carrier service to Mexico City.
- Southwest Airlines held 3% of international traffic with service to Mexico.
- Sun Country accounted for 1.9% with seasonal leisure flights.
What are the monthly trends in passenger traffic at San Antonio International Airport?
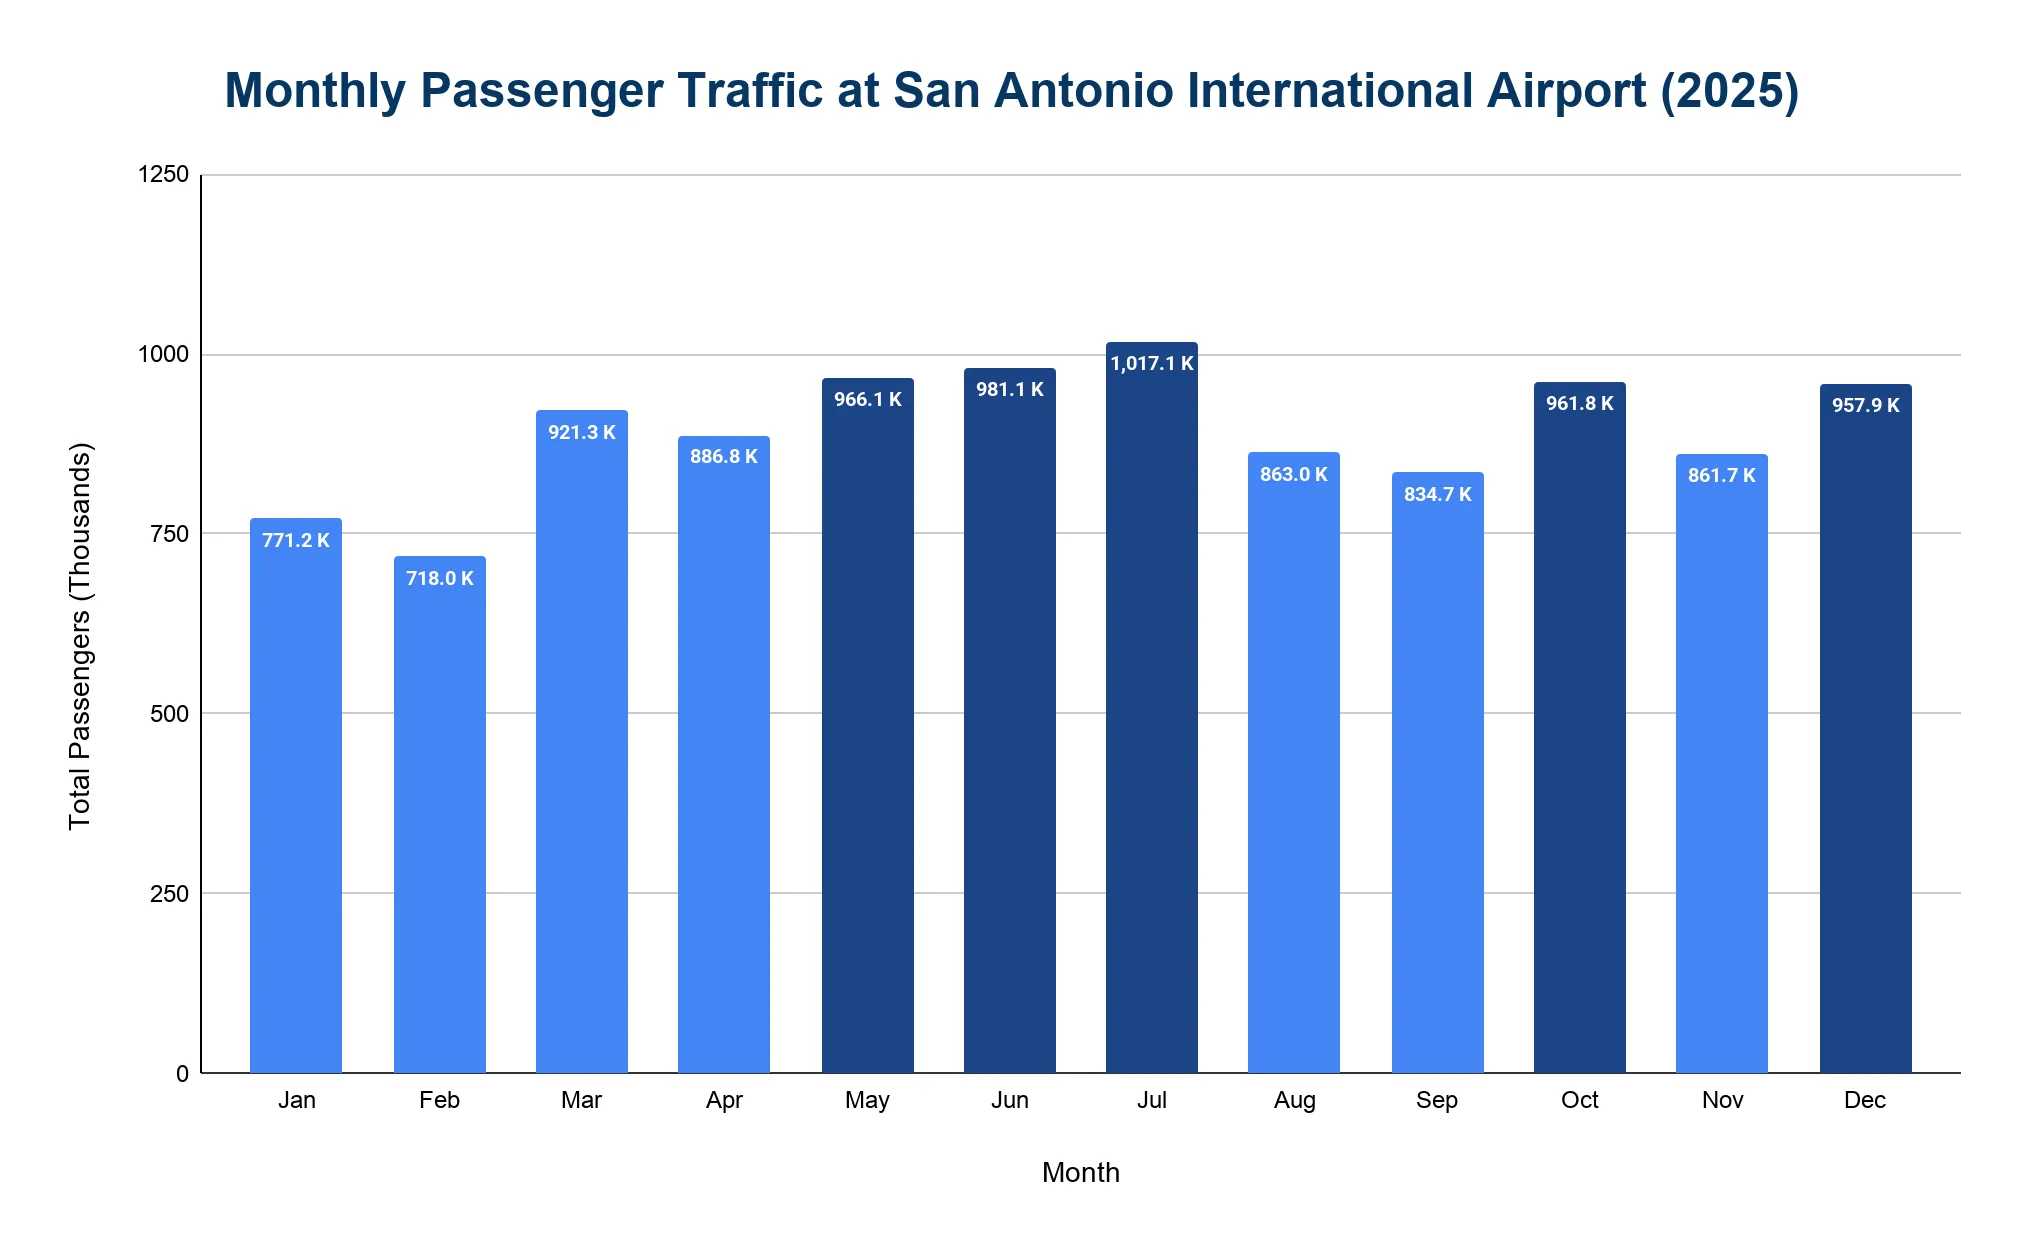
Passenger traffic at SAT follows seasonal patterns, with peak numbers during summer and holidays.
- July 2025 was the busiest month, with 1.02 million passengers.
- June followed with 981,090 passengers, showing strong summer travel demand.
- May reached 966,077 passengers, continuing the spring-to-summer buildup.
- October handled 961,792 passengers, showing a strong fall travel rebound.
- December saw 957,908 passengers, making it one of the busiest months of the year during the holiday travel period.
- The slowest months were February with 718,030 passengers and January with 771,175 passengers, typical of post-holiday and winter travel lulls.
How many routes are there at San Antonio International Airport?
As of 2025, San Antonio International Airport (SAT) featured nonstop service to 48 destinations throughout the U.S. and Mexico.
- International routes included 9 destinations in Mexico (Cancún, Mexico City, Guadalajara, Monterrey, León, Querétaro, Torreón, Morelia, and San Luis Potosí)
- There were 39 domestic routes connecting San Antonio to major coast-to-coast markets.
- Major domestic destinations include Dallas/Fort Worth, Houston, Las Vegas, Atlanta, Denver, Chicago, Phoenix, Los Angeles, Washington D.C., and Orlando.
Which destinations are the most popular from San Antonio International Airport?
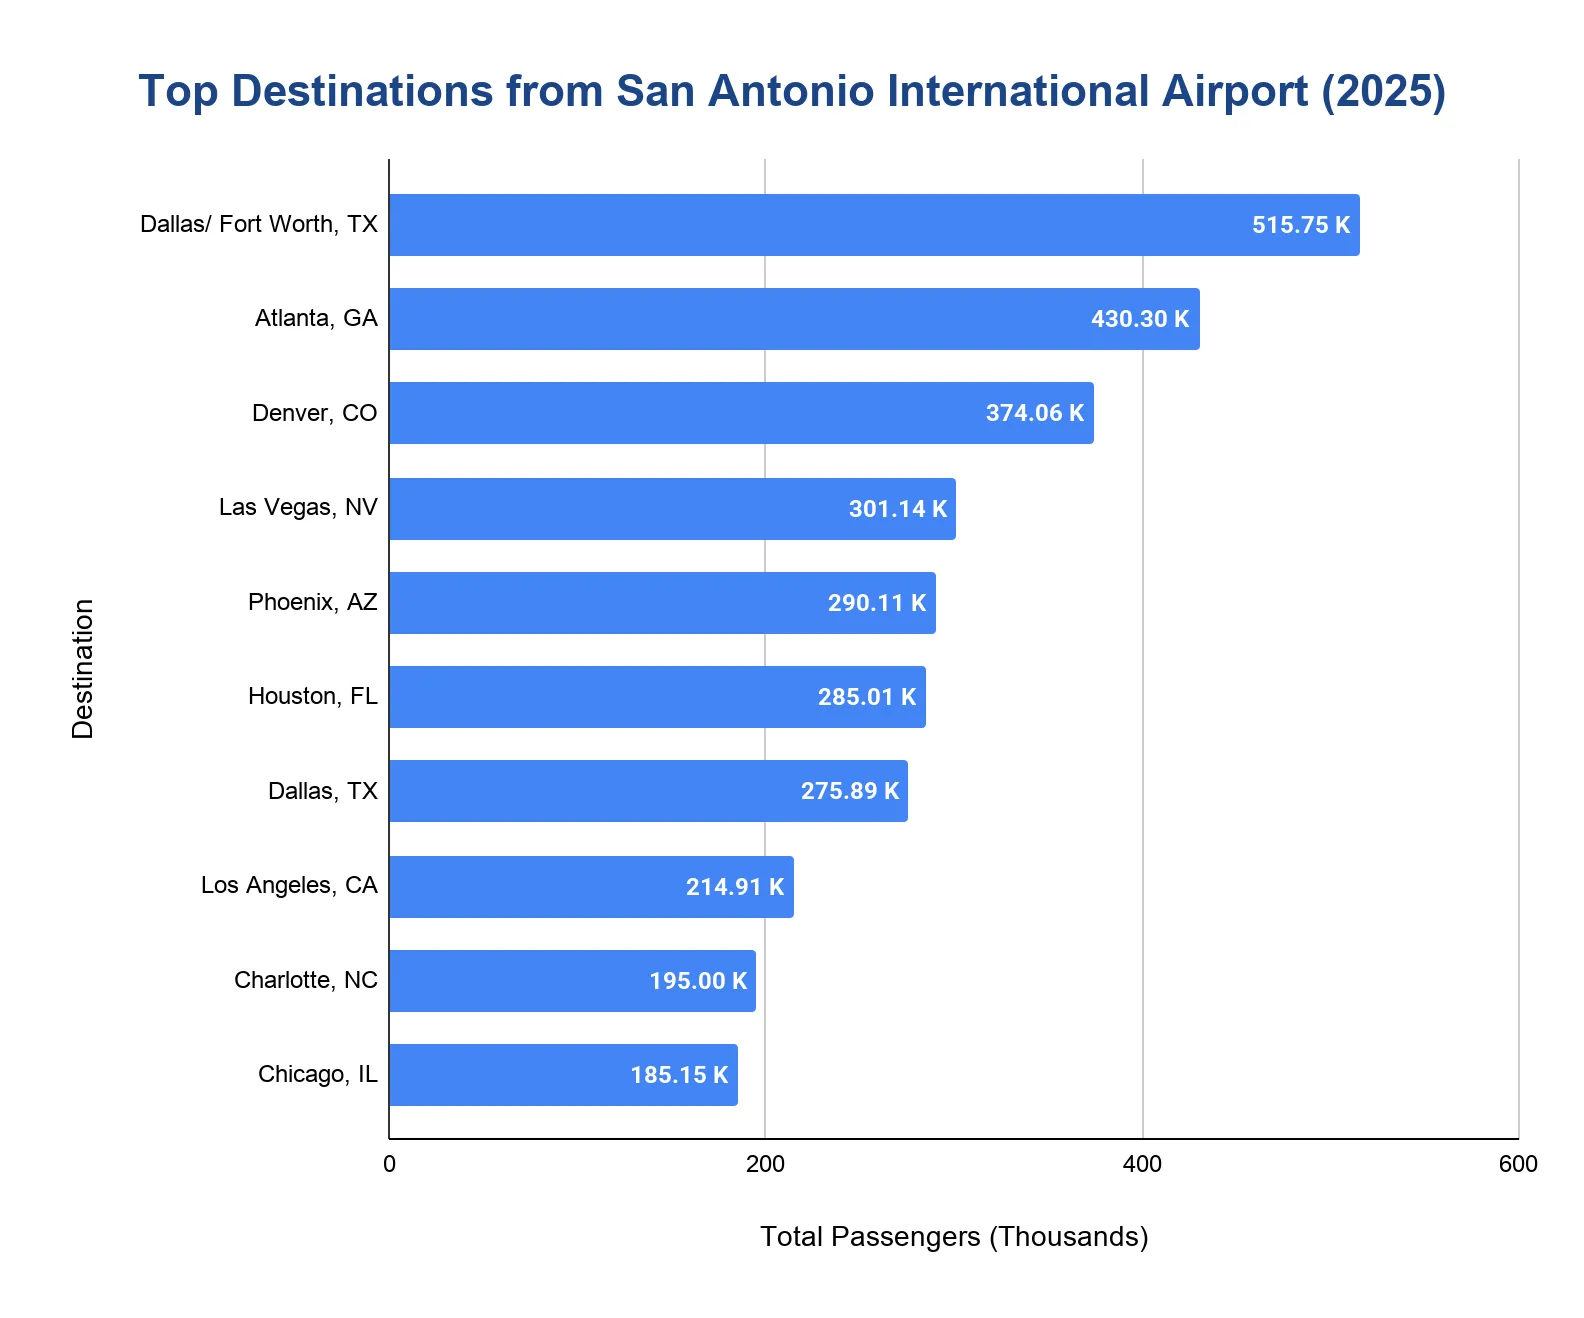
- Dallas/Fort Worth (DFW) carried 515,750 passengers in 2025, making it the busiest destination by combining both American Airlines service to DFW and Southwest service to Love Field.
- Atlanta (ATL) served 430,300 passengers, offering essential connectivity through Delta's major hub and representing the second-busiest domestic route.
- Denver (DEN) carried 374,060 passengers, providing access to the West and mountain destinations as the third-busiest route.
- Las Vegas (LAS) handled 301,140 passengers, a key leisure destination served by multiple carriers.
- Phoenix (PHX) served 290,110 passengers, offering connections to the Southwest and California markets.
How much cargo does San Antonio International Airport handle annually?
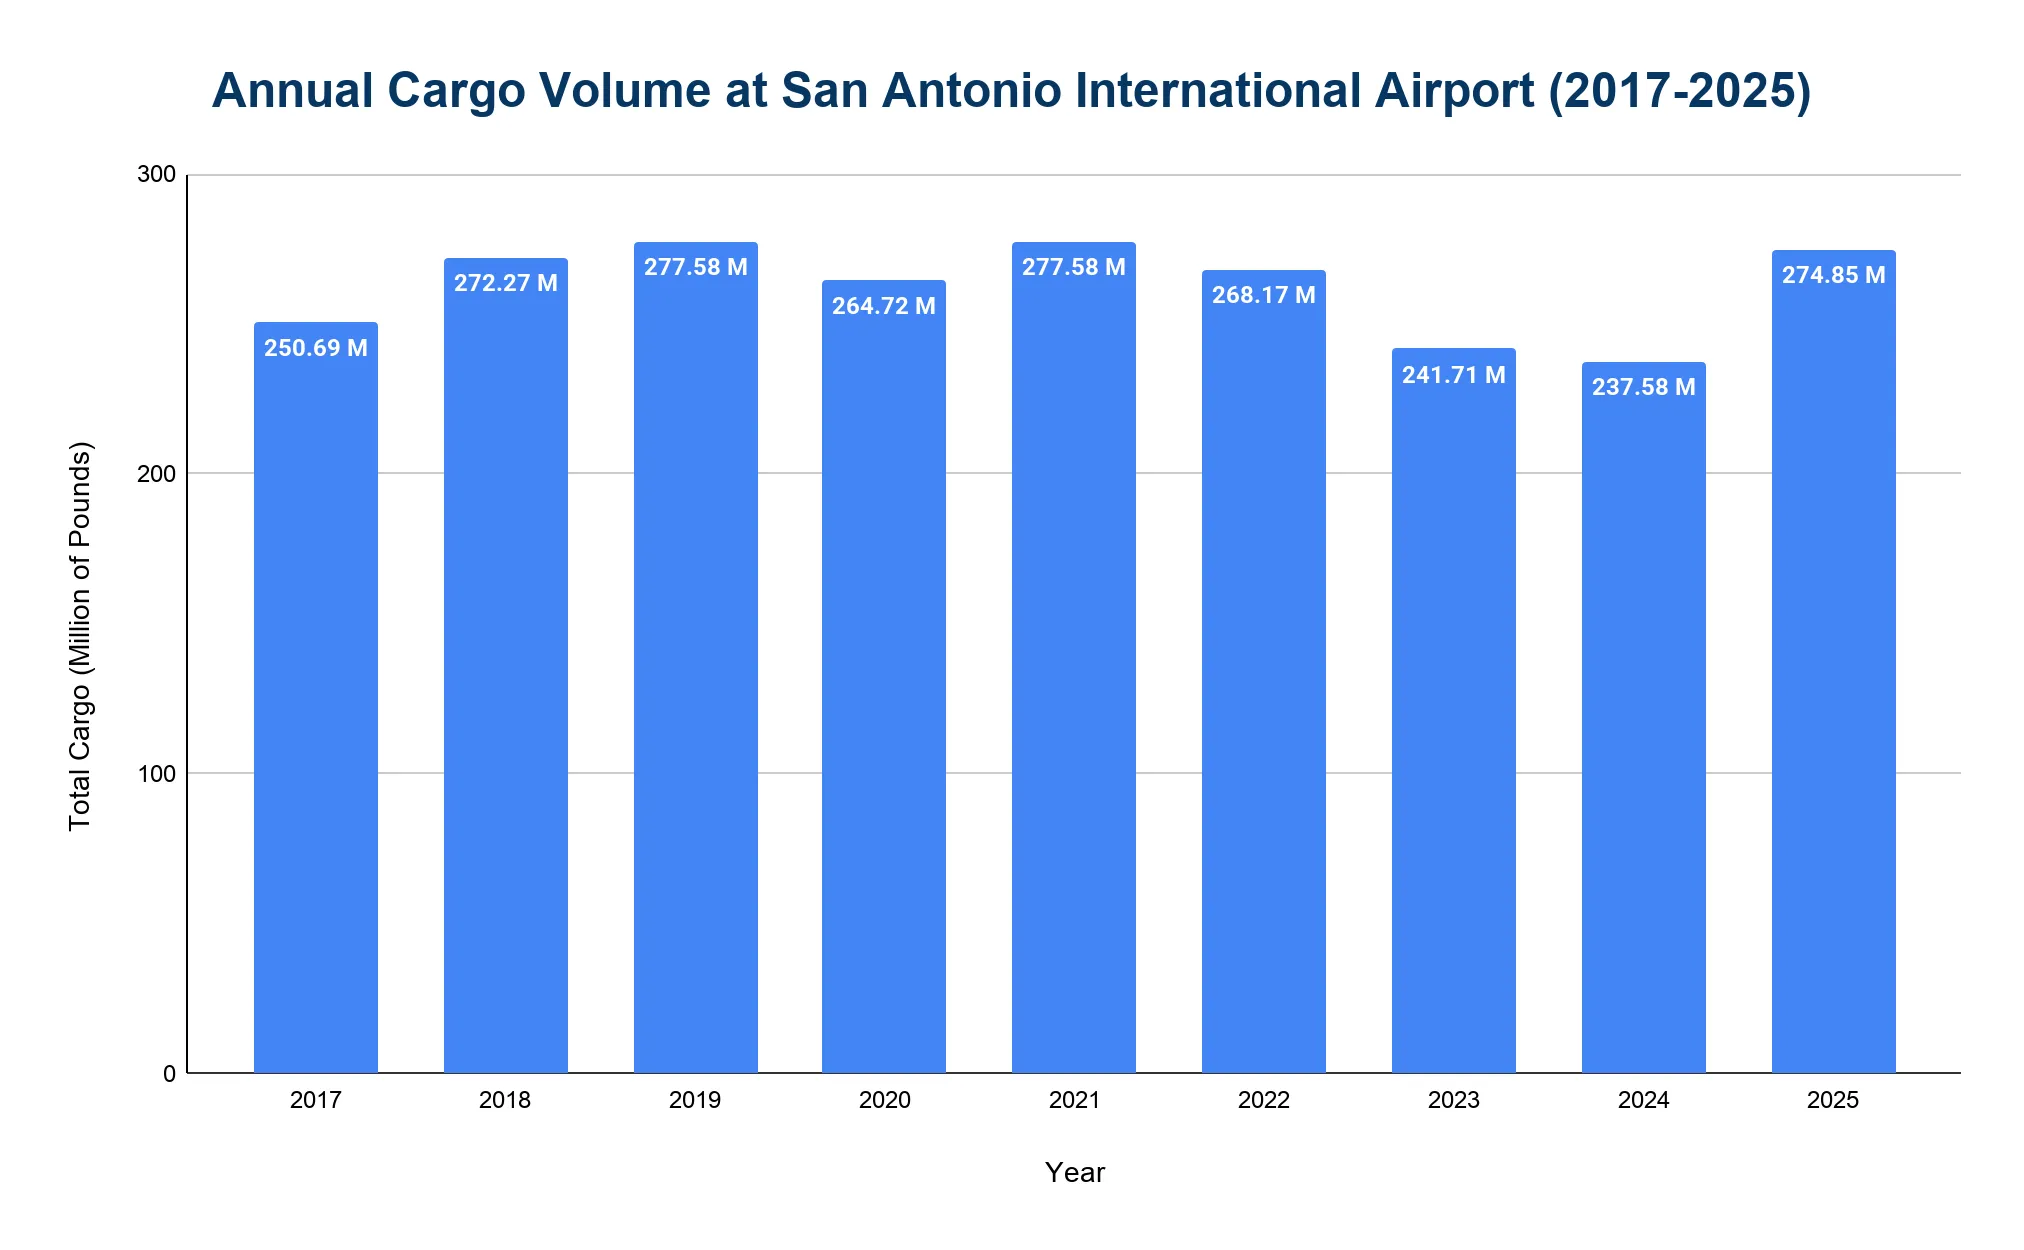
San Antonio International Airport handles significant cargo operations, with approximately 240-280 million pounds of freight and mail per year.
- The airport handled 274.85 million pounds in 2025, representing a 15.7% increase from 237.58 million pounds in 2024.
- In 2019, cargo totaled 277.58 million pounds, before pandemic-era fluctuations.
- Cargo volumes decreased to 264.72 million pounds in 2020, but recovered to 277.58 million pounds in 2021, matching the 2019 level.
- Cargo declined to 268.17 million pounds in 2022 and further decreased to 241.71 million pounds in 2023 as operations normalized and e-commerce patterns shifted.
How many cancellations occur at San Antonio International Airport annually?
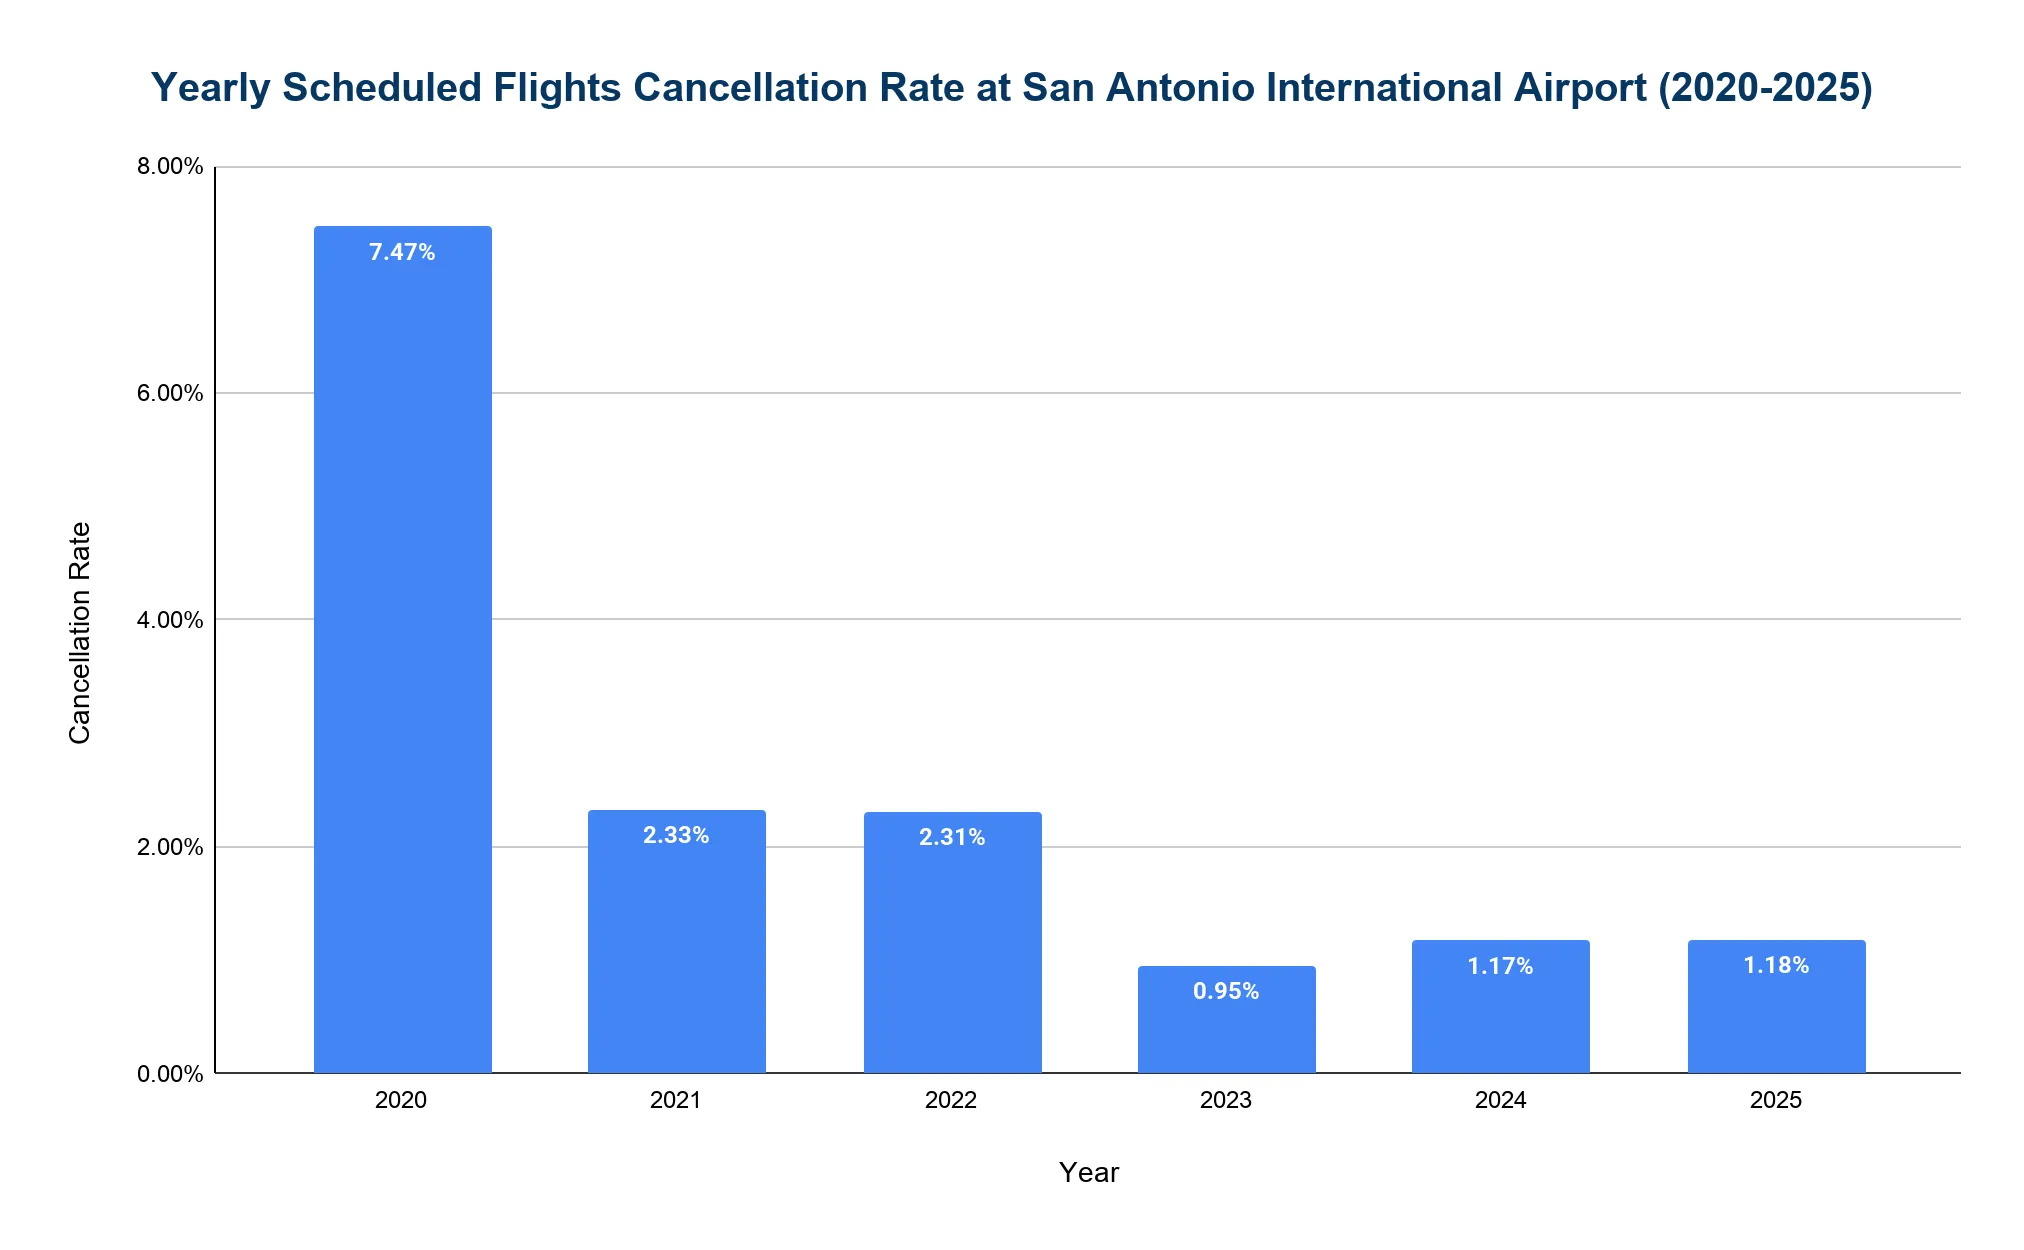
Flight cancellations at SAT have generally remained low, with rates typically between 1-2% in recent years.
- 1.18% of flights were cancelled in 2025, a nearly identical rate to the 1.17% recorded in 2024.
- The highest rate occurred in 2020, during the pandemic, when 7.47% of flights were cancelled due to COVID-19 disruptions and reduced schedules.
- The rate dropped to 2.33% in 2021 as operations began to normalize post-pandemic.
- In 2022, 2.31% of flights were cancelled.
- The cancellation rate improved dramatically to 0.95% in 2023, representing the lowest rate in recent years.
Related Travel Statistics
- St. Pete-Clearwater Airport Statistics
- George Bush Airport (IAH) Statistics
- Grand Rapids Airport (GRR) Statistics
- Piedmont Triad Airport Statistics
- Logan International Airport (BOS) Statistics
- Los Angeles International Airport Statistics
- Minneapolis-Saint Paul Airport Statistics
- Montrose Regional Airport (MTJ) Statistics
- New Orleans Airport (MSY) Statistics
- Pensacola International Airport Statistics
- T.F. Green International Airport Statistics
- Rochester Airport (ROC) Statistics
What are the main causes of flight disruptions at San Antonio International Airport?
- Thunderstorms at major hubs like Dallas/Fort Worth, Houston, Atlanta and Denver that delay inbound or outbound connections
- Summer thunderstorms in South Texas, often causing ground stops from May through September
- Winter weather events, although rare, such as the February 2021 storm that closed the airport for several days
- Air traffic control delays and capacity issues at connecting airports
- Airline-related disruptions including mechanical problems, crew shortages and large-scale failures like the December 2022 Southwest incident
What are the notable incidents at San Antonio International Airport?
- February 2021: A historic winter storm brought snow, ice, and prolonged freezing temperatures to South-Central Texas. SAT’s runways and taxiways were closed for three full days, with limited operations on February 17 and a full reopening on February 19.1
- December 2022: Southwest Airlines’ national holiday operational failure disrupted travel at SAT, with local reports citing numerous Southwest delays and cancellations. DOT later said the airline canceled 16,900 flights nationally during the meltdown.2
- January 2025: Rare winter weather during the week of January 20 caused significant delays and cancellations at SAT, and the airport briefly closed operations. Local reporting listed more than 80 delayed or canceled flights early on January 21.3
References
- San Antonio airport winterization and the 2021 winter storm · sanantonioreport.org ↑
- DOT penalizes Southwest Airlines $140 million for 2022 holiday meltdown · transportation.gov ↑
- January 2025 SAT statistics report · flysanantonio.com ↑
- San Antonio International Airport passenger and cargo statistics and financials · flysanantonio.com
- FAA OPSNET — George Bush Intercontinental Airport Operations Data · aspm.faa.gov
- BTS TranStats — Airport profiles (route information by airport) · transtats.bts.gov

