

 Popular Countries
 24/7 Support

Updated
How many passengers does Harry Reid International Airport serve each year?
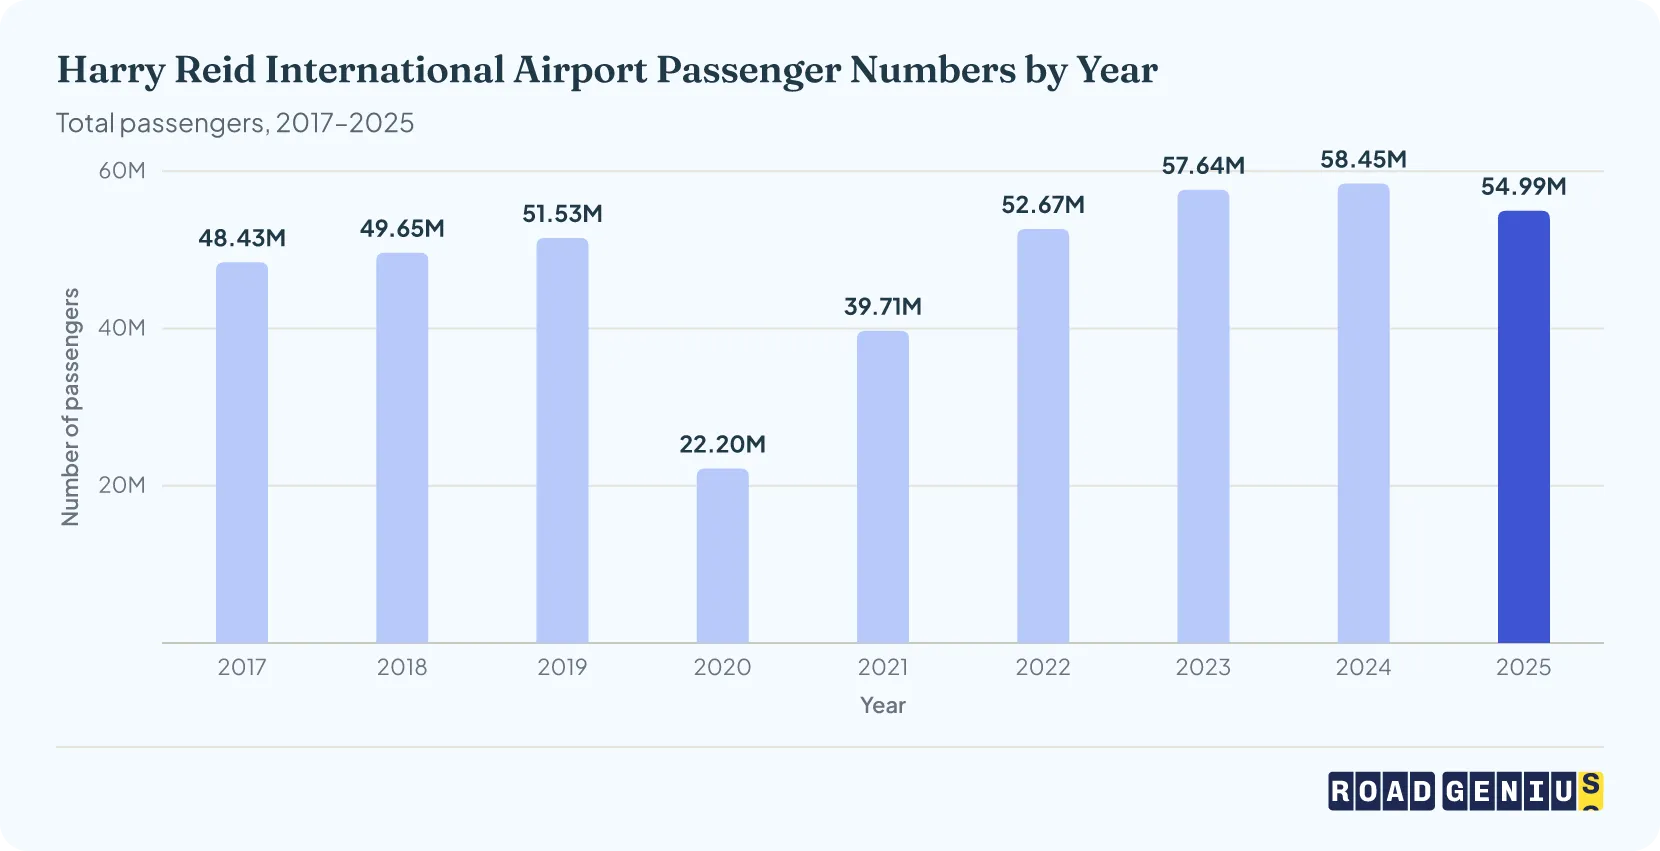
Harry Reid International Airport served close to 55 million passengers in 20252.
- The exact 2025 total was 54.99 million passengers, down about 6% from 58.45 million in 20242. Fewer international visitors (notably from Canada amid U.S. tariffs), airline cuts to domestic flights and a federal government shutdown all weighed on traffic, but the total was still about 6.7% higher than in 2019.
- Before the pandemic, in 2019, the airport handled about 51.53 million passengers3.
- Traffic fell to a pandemic low of 22.20 million passengers in 2020, then recovered to 39.71 million in 20213, 52.67 million in 2022, and reached 57.64 million in 20234.
How many passengers used Harry Reid International Airport in 2025?
- Of the 54.99 million passengers in 2025, about 92.1% were domestic (50.63 million), 6.2% international (3.43 million) and 1.7% other traffic (0.93 million)2.
How many passengers used Harry Reid International Airport in 2024?
Harry Reid International Airport handled 58.45 million passengers in 20242.
- About 92% were domestic travelers (53.78 million), 6.3% international (3.70 million) and 1.7% other (0.97 million)2.
How large is Harry Reid International Airport?
Harry Reid International Airport spans 3,574 acres of land in Clark County, Nevada, as of June 20255.
How many aircraft operations occur at Harry Reid International Airport each year?
Close to 587,000 aircraft operations (takeoffs and landings) took place at Harry Reid International Airport (LAS) in 20252.
Harry Reid International Airport Aircraft Operations by Type (2017–2025)
| Year | Total Operations | Air Carrier | Air Taxi | General Aviation | Military |
|---|---|---|---|---|---|
| 2017 | 542,994 | 362,898 | 135,977 | 42,891 | 1,228 |
| 2018 | 539,857 | 366,704 | 128,828 | 43,128 | 1,197 |
| 2019 | 552,9623 | 376,3593 | 133,8663 | 41,7263 | 1,0113 |
| 2020 | 323,4223 | 225,1713 | 64,3253 | 26,5513 | 7,3753 |
| 2021 | 486,5403 | 293,0353 | 138,4843 | 43,4063 | 11,6153 |
| 2022 | 581,1164 | 370,5524 | 155,6354 | 43,7174 | 11,2124 |
| 2023 | 611,8064 | 412,2744 | 150,5814 | 39,2574 | 9,6944 |
| 2024 | 613,9732 | 413,5952 | 154,6252 | 36,1022 | 9,6512 |
| 2025 | 586,8712 | 401,2262 | 146,0862 | 32,1052 | 7,4542 |
LAS Aircraft Operations in 2025
- Of the 586,871 operations in 2025, air carriers flew about 68.4% (401,226), while general aviation, air taxi and military flights made up the other 31.6% (185,645)2.
LAS Aircraft Operations in 2024
Las Vegas Airport (LAS) handled 613,973 aircraft operations in 20242.
- Air carriers flew about 67.4% of them (413,595), and general aviation, air taxi and military flights the other 32.6% (200,378)2.
How much revenue does Harry Reid International Airport generate each year?
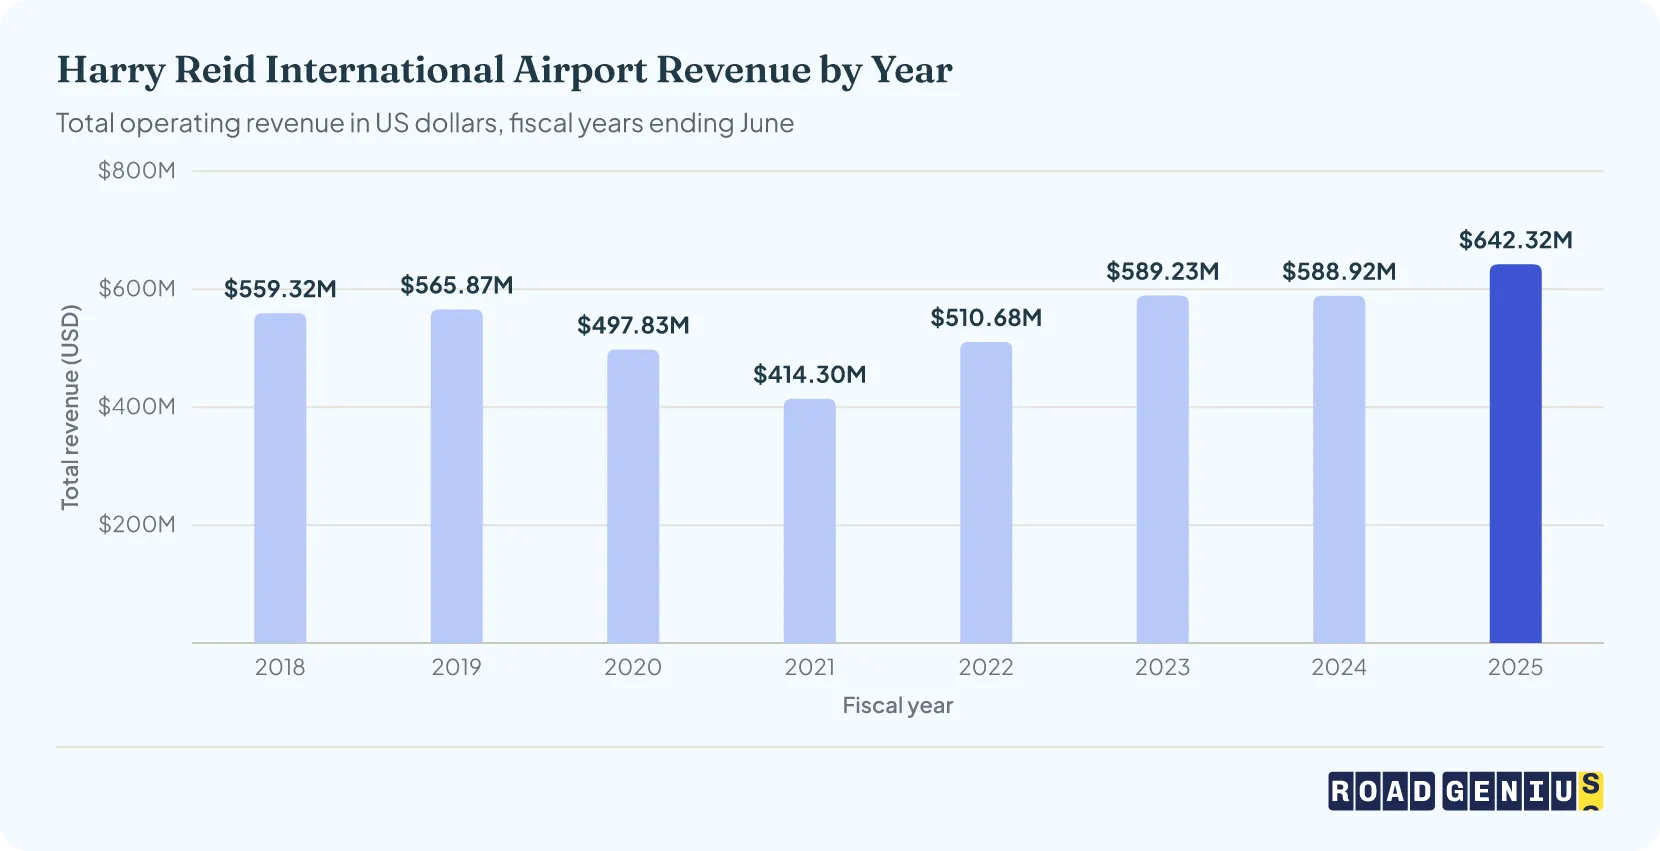
Harry Reid International Airport generated over $640 million in revenue in fiscal year 2025, which ended in June 20255.
- Revenue reached $642.32 million, up 9.1% from fiscal year 2024 and 13.5% above fiscal year 20195.
- Revenue was $565.87 million in fiscal year 2019, then fell to $497.83 million in fiscal year 2020 as the pandemic hit5.
- Revenue slipped again to $414.30 million in fiscal year 2021, then climbed steadily to $510.68 million in fiscal year 2022 and $588.92 million in fiscal year 20245.
Which airlines carry the most passengers at Harry Reid International Airport?
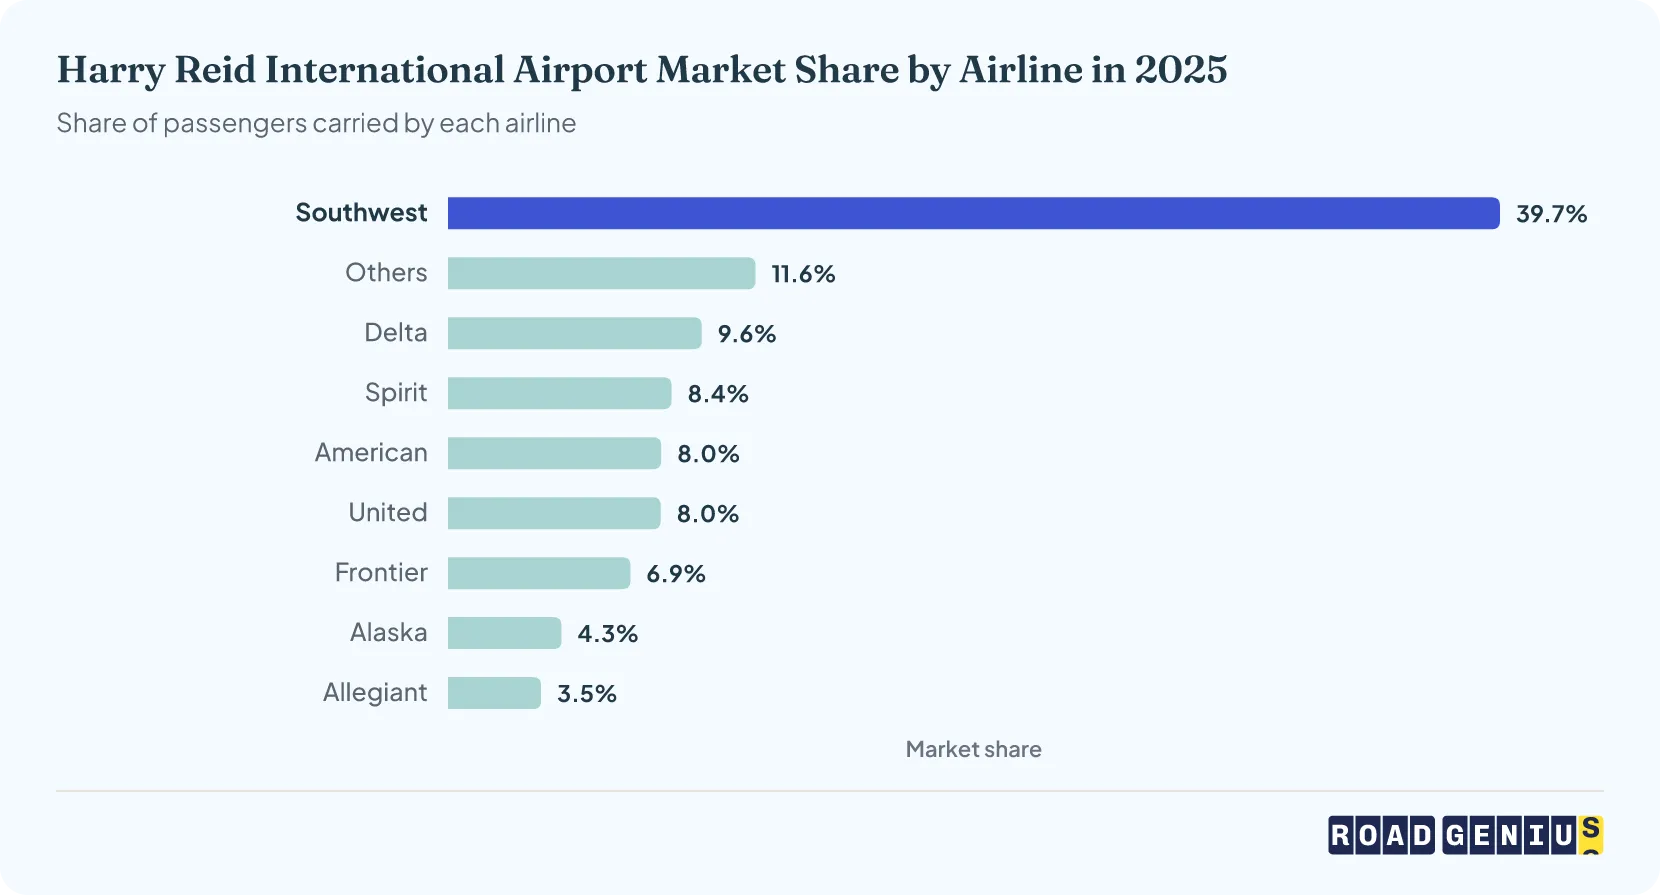
Southwest Airlines carries the most passengers at Harry Reid International Airport, with a 39.7% market share6.
Market Share by Airline at LAS (2025)
- Southwest Airlines: 39.7% (21.81 million passengers)6
- Delta Air Lines: 9.6% (5.26 million passengers)6
- Spirit Airlines: 8.4% (4.64 million passengers)6
- American Airlines: 8% (4.42 million passengers)6
- United Airlines: 8% (4.41 million passengers)6
- Frontier Airlines: 6.9% (3.78 million passengers)6
- Alaska Airlines: 4.3% (2.35 million passengers)6
- Allegiant Air: 3.5% (1.93 million passengers)6
- Other carriers: 11.6% (6.38 million passengers)6
Which airlines use Terminal 1 and Terminal 3 at Las Vegas airport?
Southwest, Delta, American, Allegiant and Sun Country fly from Terminal 1, while United, Alaska, Frontier, JetBlue and every international airline use Terminal 37.
- Terminal 1: Allegiant Air, American Airlines, Delta Air Lines, Southwest Airlines and Sun Country Airlines7.
- Terminal 3: Alaska Airlines, Avelo, Breeze Airways, Contour, Frontier Airlines, Hawaiian Airlines, JetBlue and United Airlines, plus international carriers including Air Canada, WestJet, Porter, Flair, British Airways, Virgin Atlantic, Aer Lingus, KLM, Air France, Condor, Discover, Edelweiss, Korean Air, Aeroméxico, Volaris, VIVA Aerobus, Avianca and Copa Airlines7.
- Getting between terminals: a free shuttle runs between Terminal 1 and Terminal 3 about every 20–30 minutes, and the ride takes about 10 minutes8.
What are the busiest routes at Harry Reid International Airport?
These are the most popular domestic and international routes from Harry Reid International Airport (LAS).
Popular Domestic Routes
- Los Angeles (LAX)
- Denver (DEN)
- Dallas/Fort Worth (DFW)
- Seattle/Tacoma (SEA)
- Phoenix (PHX)
- Atlanta (ATL)
- Chicago (ORD)
- San Francisco (SFO)
- San Diego (SAN)
- Sacramento (SMF)
Popular International Routes
- Toronto (YYZ)
- London Heathrow (LHR)
- Mexico City (MEX)
- Vancouver (YVR)
- Calgary (YYC)
Car and Campervan Rental in Las Vegas
- Car Rental Henderson
- Car Rental Las Vegas
- Car Rental Las Vegas Airport (LAS)
- Campervan Rental Las Vegas
- Car Rental Las Vegas to Denver (One-Way)
- Car Rental Las Vegas to Grand Canyon (One-Way)
- Car Rental Las Vegas to Phoenix (One-Way)
- Car Rental Las Vegas to Salt Lake City (One-Way)
- Car Rental Las Vegas to San Diego (One-Way)
- Car Rental Las Vegas to San Francisco (One-Way)
- Car Rental Los Angeles to Las Vegas (One-Way)
What is the busiest month at Las Vegas airport?
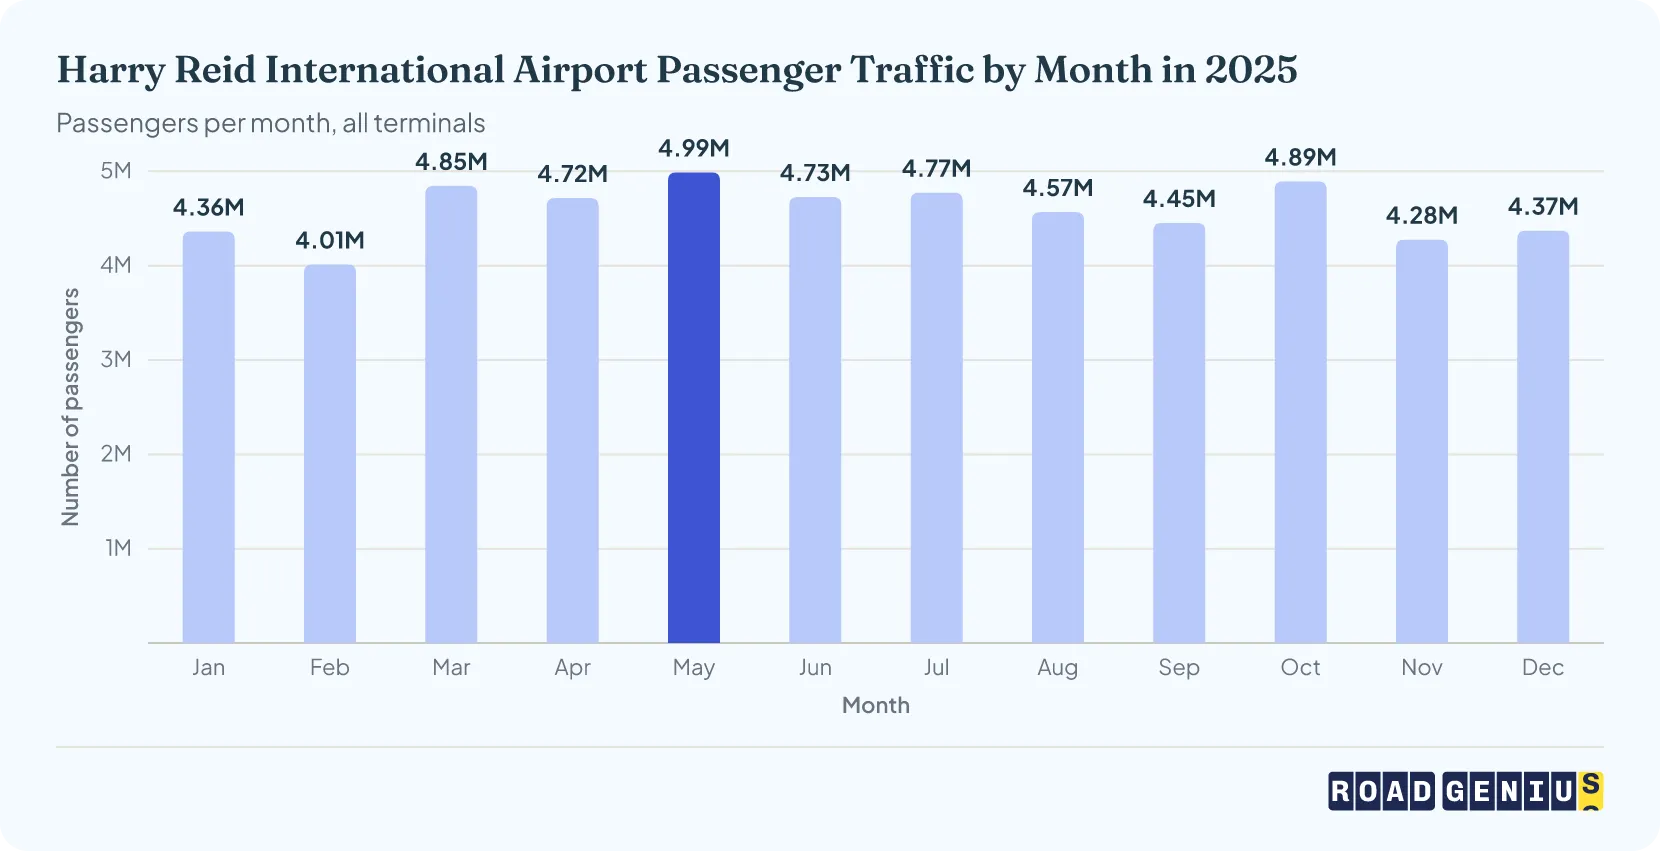
May was the peak month at Las Vegas Airport (LAS) in 20259.
- May drew about 4.99 million passengers, ahead of October (4.89 million) and March (4.85 million)9. July (4.77 million) and June (4.73 million) came next.
- April drew 4.72 million passengers, August 4.57 million, September 4.45 million, December 4.37 million and January 4.36 million. November (4.28 million) and February (4.01 million) were the quietest months9.
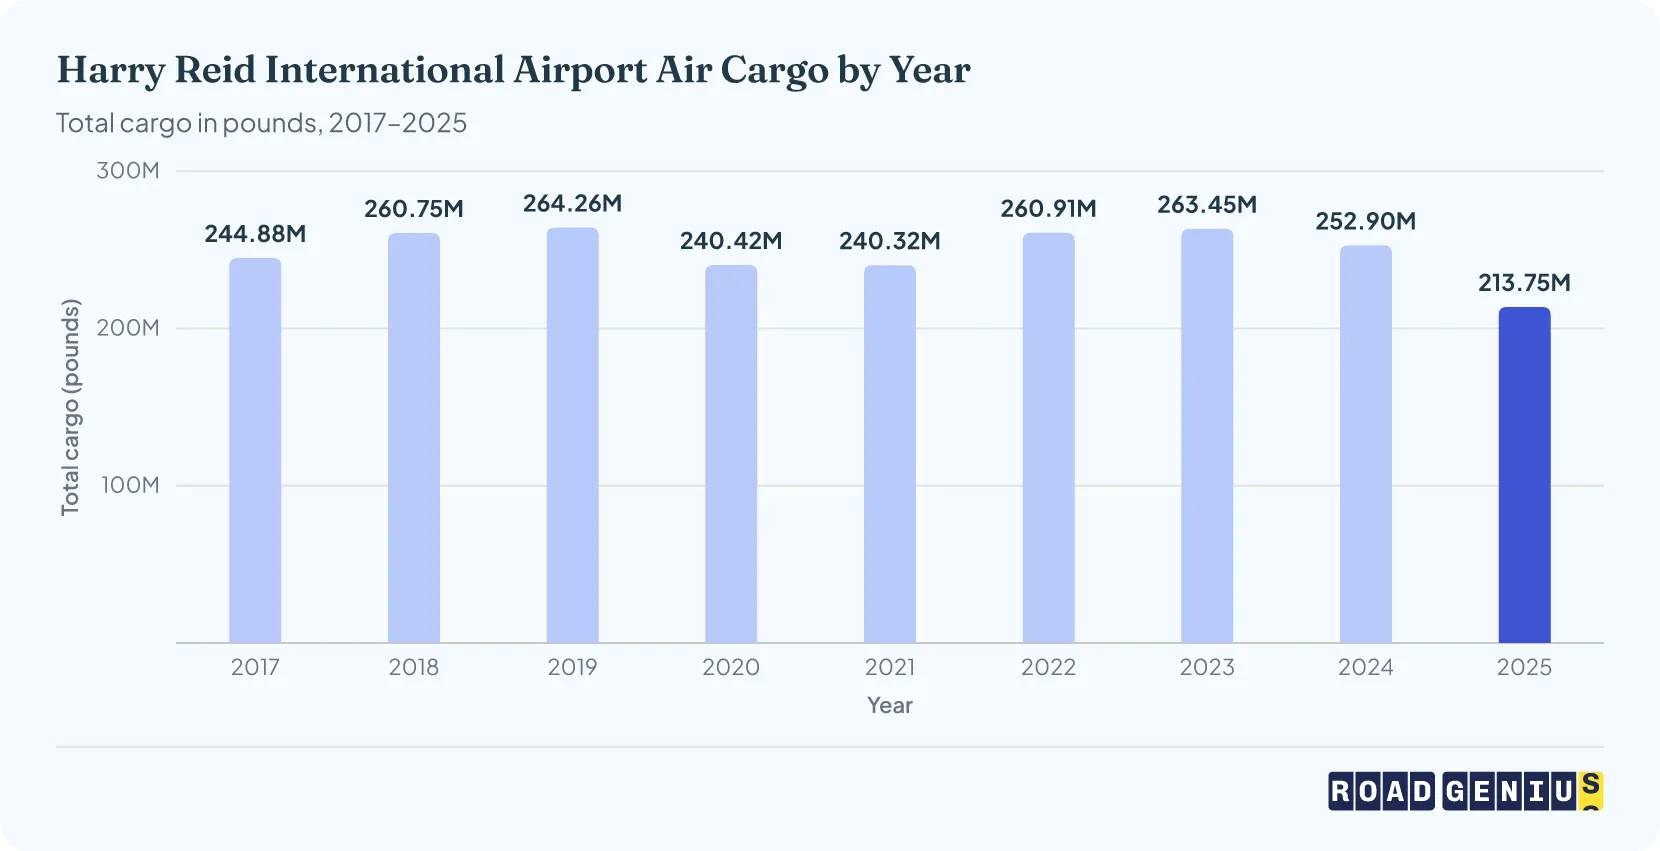
How much cargo moves through Harry Reid International Airport each year?
Harry Reid International Airport handled approximately 214 million pounds of cargo in 20252.
- The 2025 total of 213.75 million pounds was down about 15.5% from 252.90 million pounds in 20242 and about 19% below the pre-pandemic level of 2019.
- Cargo stood at 264.26 million pounds in 2019, fell to 240.42 million pounds in 2020 during the pandemic and held steady at 240.32 million pounds in 20213.
- Volumes then grew to 260.91 million pounds in 2022 and edged up nearly 1% to 263.45 million pounds in 20234.
How reliable is Harry Reid International Airport?
About 78.4% of arrivals and 76.2% of departures at Harry Reid Airport (LAS) were on time in 2025, calculated from the U.S. Department of Transportation's 12 monthly on-time reports for the year10.
- Best month: April, with 80.5% of arrivals on time11.
- Worst months: June (74.7%)12 and July (73.7%)13.
- A flight counts as on time when it arrives or departs within 15 minutes of schedule10.
How does Harry Reid International Airport rank against other airports?
Las Vegas Airport was the 8th busiest airport in the United States by passenger traffic in 202514.
Las Vegas Travel and Airport Statistics
- Las Vegas Tourism Statistics
- Nevada Tourism Statistics
- Grand Canyon Tourism Statistics
- Reno-Tahoe International Airport (RNO) Statistics
- Los Angeles International Airport (LAX) Statistics
- Phoenix Sky Harbor International Airport (PHX) Statistics
- Hollywood Burbank Airport (BUR) Statistics
- Salt Lake City International Airport (SLC) Statistics
- Denver International Airport (DEN) Statistics
- San Francisco International Airport (SFO) Statistics
- Seattle-Tacoma International Airport (SEA) Statistics
- Dallas Fort Worth International Airport (DFW) Statistics
What is Harry Reid International Airport's economic impact?
References
- McCarran officially renamed Harry Reid International Airport (Las Vegas Review-Journal) · Las Vegas Review-Journal ↑
- Harry Reid International Airport Monthly Airport Traffic Report — December 2025 (Clark County Department of Aviation) · assets.ctfassets.net ↑ b c d e f g h i j k l m n o p q r s t u v w
- Harry Reid International Airport Monthly Airport Traffic Report — December 2021 (Clark County Department of Aviation) · assets.ctfassets.net ↑ b c d e f g h i j k l m n o p q r s t
- Harry Reid International Airport Monthly Airport Traffic Report — December 2023 (Clark County Department of Aviation) · assets.ctfassets.net ↑ b c d e f g h i j k l m
- Clark County Department of Aviation Annual Comprehensive Financial Report for the Fiscal Years Ended June 30, 2025 and 2024 · assets.ctfassets.net ↑ b c d e f g h i j
- Harry Reid International Airport Detailed Passenger Report — December 2025 (Clark County Department of Aviation) · assets.ctfassets.net ↑ b c d e f g h i j
- Harry Reid International Airport — Airlines (nonstop carriers and terminals) · harryreidairport.com ↑ b c
- Harry Reid International Airport — All options to and from LAS (ground transportation) · harryreidairport.com ↑
- LVCVA Summary of Monthly Tourism Indicators for Las Vegas, NV — Year-End Summary for 2025 (revised) · lvcva.com ↑ b c
- U.S. DOT Air Travel Consumer Report, February 2026 (December 2025 flight data) · transportation.gov ↑ b
- U.S. DOT Air Travel Consumer Report, June 2025 (April 2025 flight data) · transportation.gov ↑
- U.S. DOT Air Travel Consumer Report, August 2025 (June 2025 flight data) · transportation.gov ↑
- U.S. DOT Air Travel Consumer Report, September 2025 (July 2025 flight data) · transportation.gov ↑
- FAA — Final CY2025 Enplanements at Commercial Service Airports · faa.gov ↑
- Busiest airports in the world — passenger traffic, aircraft movements and cargo rankings (ACI World) · aci.aero ↑
- FAA — Qualifying Cargo Airports, Rank Order and Percent Change from 2024 (CY2025) · faa.gov ↑
- The Economic Contribution of the Clark County Airports (Oxford Economics, August 2019) · assets.ctfassets.net ↑ b
- Harry Reid International Airport Official Statistics and Press Releases · harryreidairport.com
- Bureau of Transportation Statistics — LAS Performance Data and Route Information · bts.gov
- U.S. DOT Air Travel Consumer Report, March 2025 (January 2025 flight data) · transportation.gov
- U.S. DOT Air Travel Consumer Report, April 2025 (February 2025 flight data) · transportation.gov
- U.S. DOT Air Travel Consumer Report, May 2025 (March 2025 flight data) · transportation.gov
- U.S. DOT Air Travel Consumer Report, July 2025 (May 2025 flight data) · transportation.gov
- U.S. DOT Air Travel Consumer Report, October 2025 (August 2025 flight data) · transportation.gov
- U.S. DOT Air Travel Consumer Report, November 2025 (September 2025 flight data) · transportation.gov
- U.S. DOT Air Travel Consumer Report, December 2025 (October 2025 flight data) · transportation.gov
- U.S. DOT Air Travel Consumer Report, January 2026 (November 2025 flight data) · transportation.gov
