

 Popular Countries
 24/7 Support
Updated
John F. Kennedy International Airport (JFK) in Queens is New York City’s primary international entry point and one of the busiest airports worldwide, connecting North America to destinations across six continents.
How many passengers use John F. Kennedy International Airport each year?
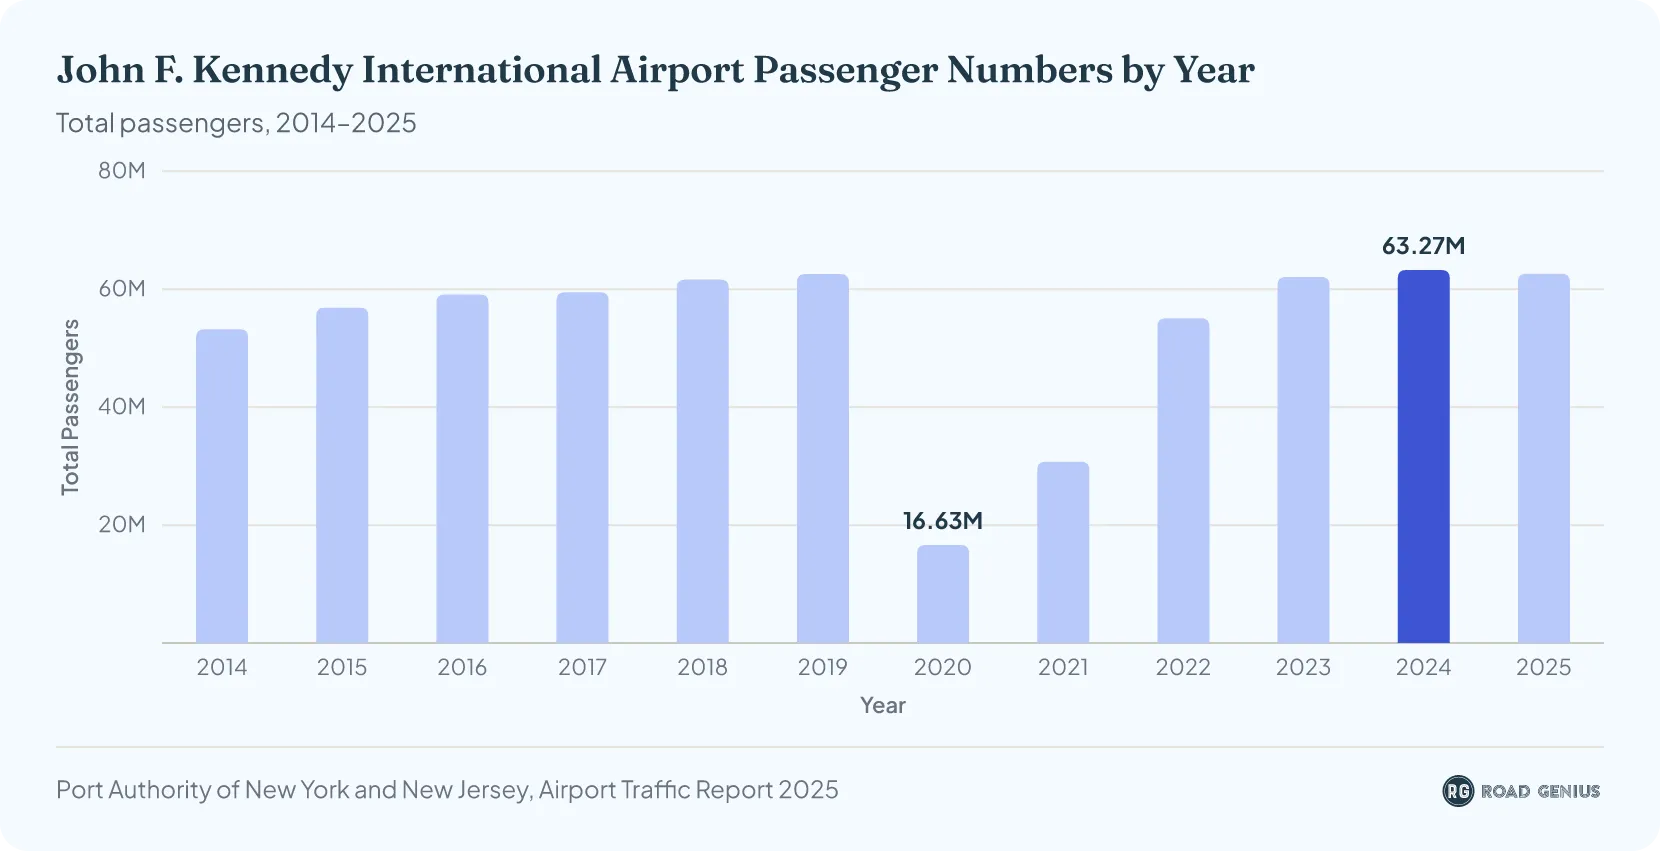
Over 62 million passengers are processed through John F. Kennedy International (JFK) Airport each year.
- Before the pandemic, JFK Airport processed approximately 62.57 million passengers annually in 2019.1
- Annual processing dropped to a pandemic low of 16.63 million passengers in 2020, then recovered to 30.76 million in 2021, 55.08 million in 2022, 62.08 million in 2023, and a record 63.27 million in 2024.1
- In 2025, JFK Airport processed 62.63 million passengers1, down 1% from 2024 but still above 2019.
How many passengers have used John F. Kennedy International Airport in 2026 so far?
John F. Kennedy International Airport handled 40.07 million passengers from January to August 2026, down 5.6% from 42.44 million in the same months of 2025.2
- International passengers accounted for approximately 55.0% (22.06 million passengers), while domestic passengers comprised 45.0% (18.01 million passengers) of year-to-date traffic.2
| JFK Airport passengers by month, 2026 vs 2025 | |||
|---|---|---|---|
| Month | 2026 passengers | 2025 passengers | Change |
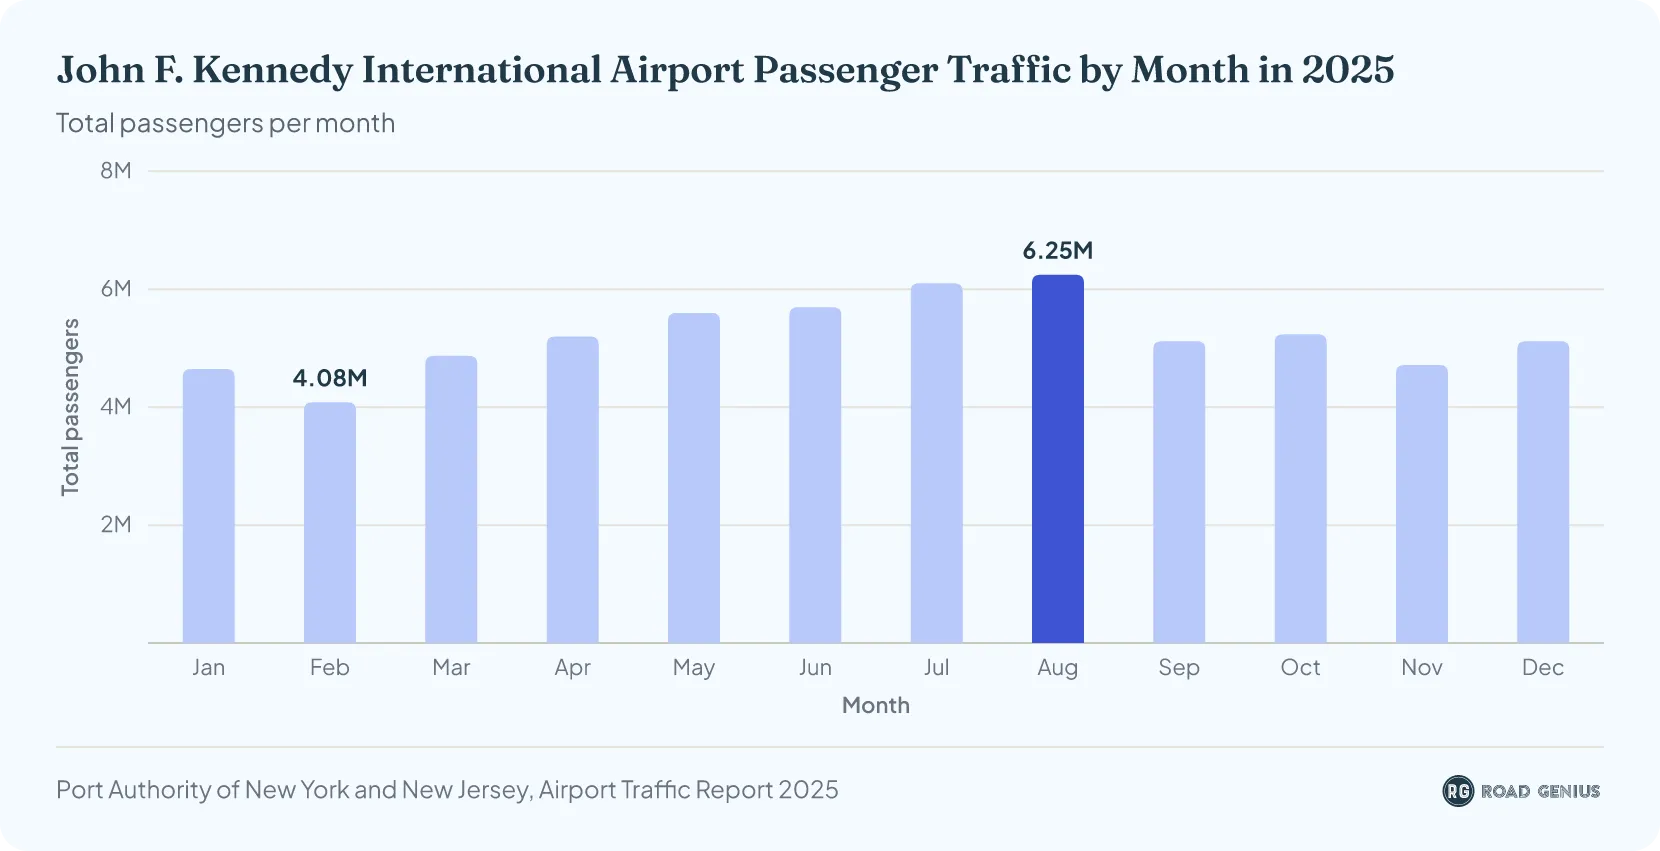
| January | 4,457,868 | 4,647,940 | −4.1% |
| February | 3,869,139 | 4,082,211 | −5.2% |
| March | 4,770,610 | 4,870,951 | −2.1% |
| April | 4,921,007 | 5,197,968 | −5.3% |
| May | 5,175,573 | 5,599,325 | −7.6% |
| June | 5,420,108 | 5,694,544 | −4.8% |
| July | 5,661,285 | 6,101,967 | −7.2% |
| August | 5,793,317 | 6,246,468 | −7.3% |
| January–August | 40,068,907 | 42,441,374 | −5.6% |
Source · Port Authority of New York and New Jersey, Airport Traffic Data (revenue passengers), data through August 2026.
How many passengers used John F. Kennedy International Airport in 2025?
John F. Kennedy International Airport handled 62.63 million passengers in 2025.1
- International passengers accounted for approximately 55.1% (34.53 million passengers), while domestic passengers comprised 44.9% (28.10 million passengers) of total airport traffic.1
How many passengers used John F. Kennedy International Airport in 2024?
John F. Kennedy International Airport processed 63.27 million passengers in 2024.1
- International passengers accounted for approximately 55.7% (35.26 million passengers), while domestic passengers comprised 44.3% (28.01 million passengers) of total airport traffic.1
How large is John F. Kennedy International Airport?
John F. Kennedy International Airport spans approximately 4,930 acres of land in Queens, New York.1
How many aircraft operations occur at John F. Kennedy International Airport each year?
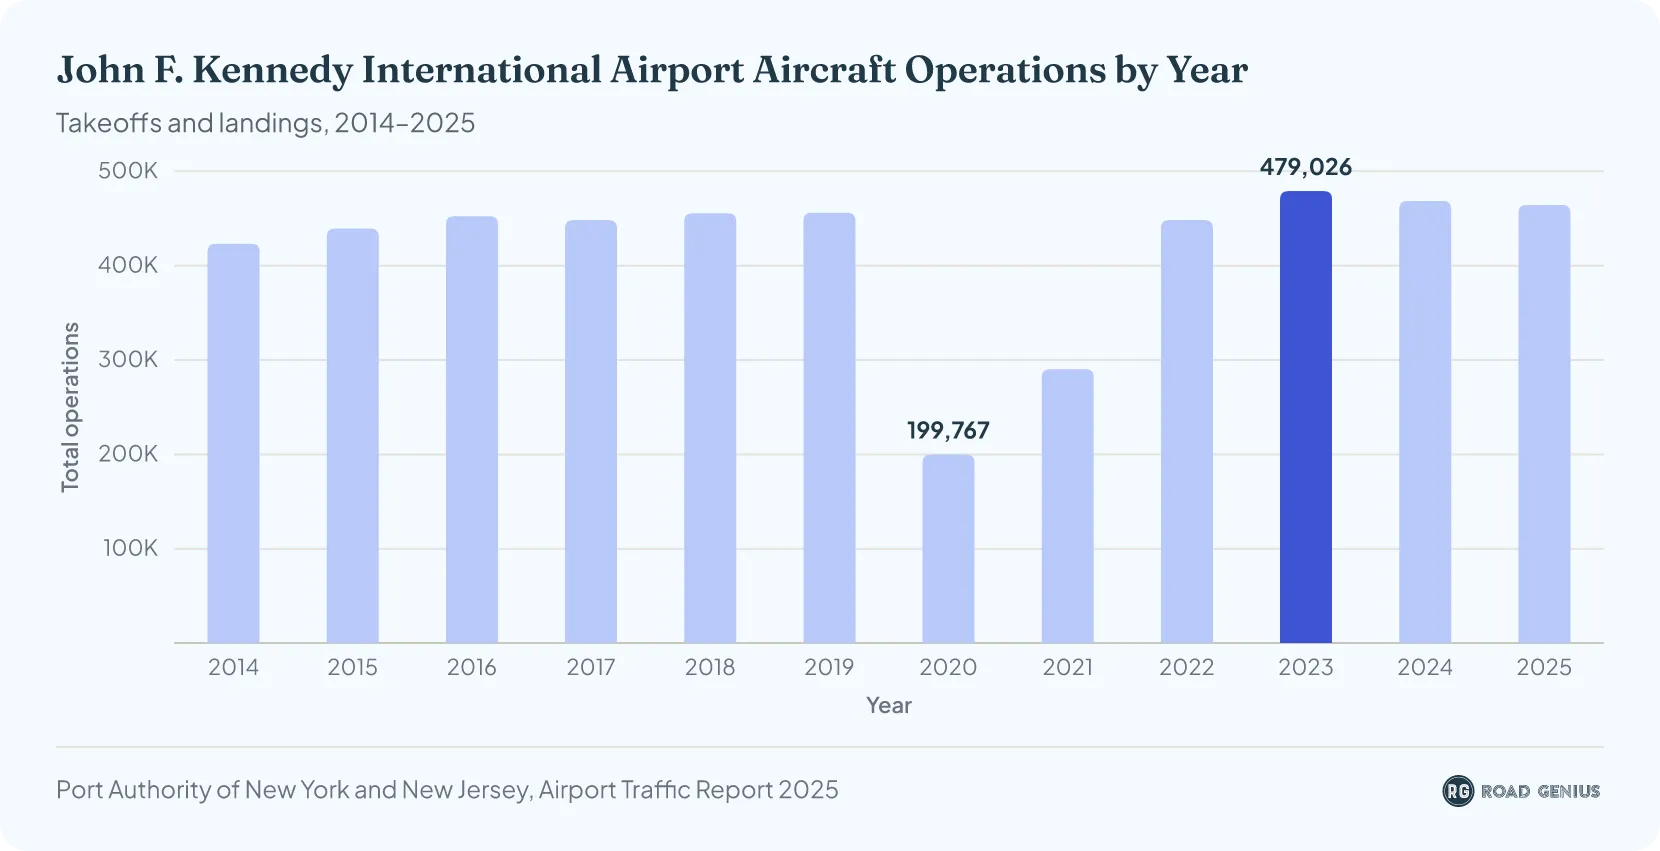
Over 464,000 aircraft operations (including takeoffs and landings) occur at John F. Kennedy International (JFK) Airport each year.
- Before the pandemic, JFK Airport handled approximately 456,179 operations in 2019 across all categories.1
- Airport operations fell to 199,767 operations in 2020 (down 56% due to COVID-19), then gradually recovered to 290,355 in 2021, 448,341 in 2022 (achieving 98% of pre-pandemic levels), 479,026 in 2023, and 468,570 in 2024.1
- The airport handled 464,281 operations in 20251, down approximately 1% from 2024.
Aircraft Operations in 2025
John F. Kennedy International (JFK) Airport handled 464,281 aircraft operations in 2025.1
- Domestic operations accounted for approximately 59.6% (276,704 operations), while international operations comprised 40.4% (187,577 operations) of total airport activity.1
Aircraft Operations in 2024
John F. Kennedy International (JFK) Airport processed 468,570 aircraft operations in 2024.1
- Domestic operations accounted for approximately 58.9% (276,088 operations), while international operations comprised 41.1% (192,482 operations) of total airport activity, with total operations reaching 103% of pre-pandemic (2019) levels.1
How much revenue does John F. Kennedy International Airport generate each year?
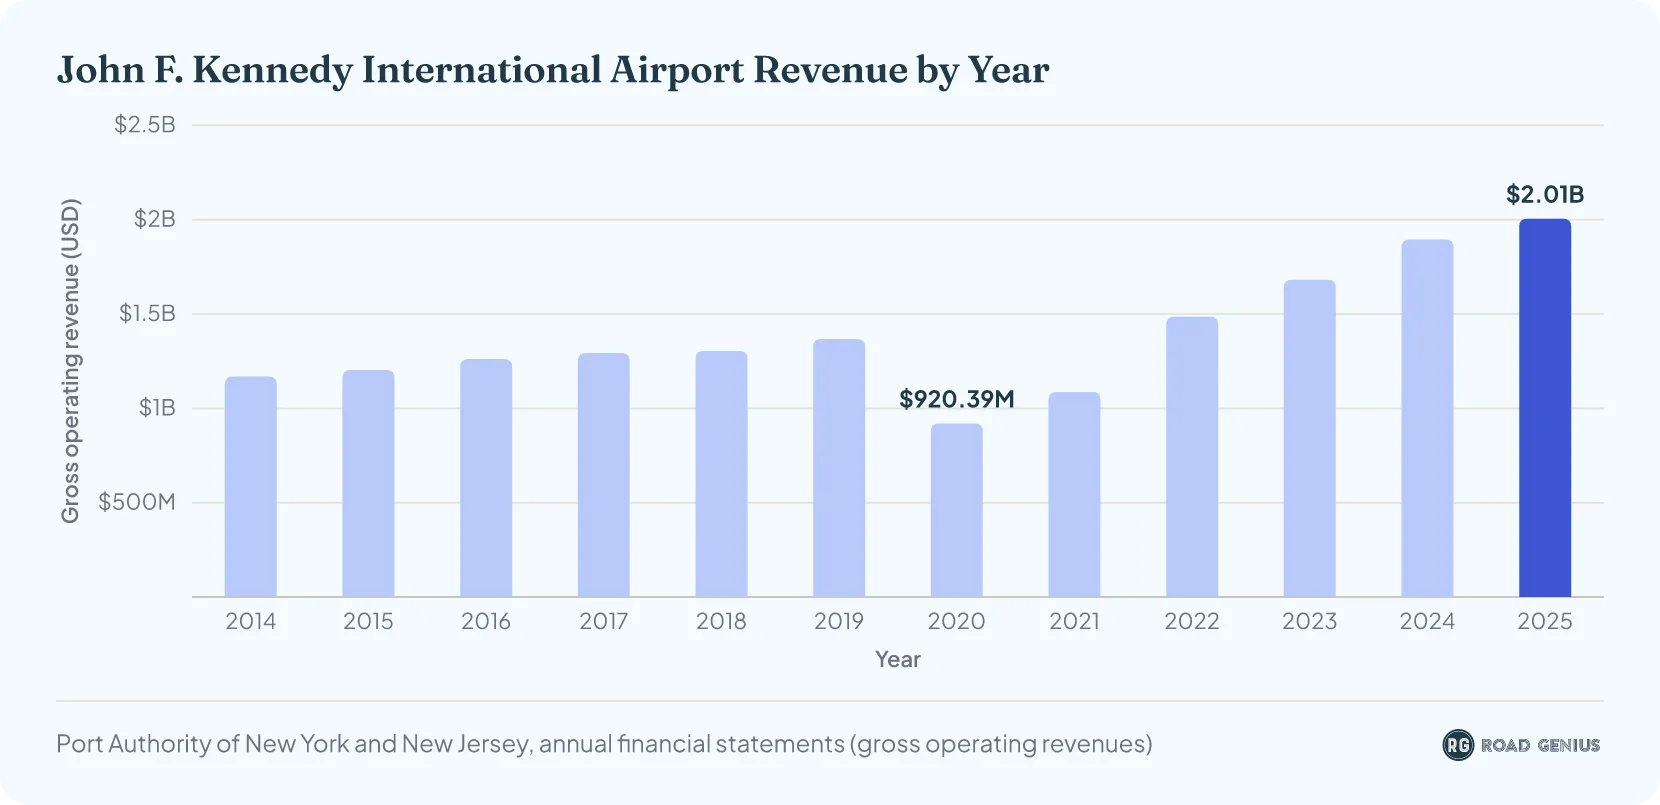
John F. Kennedy International (JFK) Airport generated $2.01 billion in gross operating revenue in 2025, according to the Port Authority of New York and New Jersey.4
- The airport generated $1.37 billion in revenue in 20195, but dropped to $920 million in 2020 due to the pandemic.6
- Recovery progressed steadily from $1.09 billion in 20217 to $1.49 billion in 20228, reaching $1.68 billion in 2023.9
- Revenue rose to $1.90 billion in 202410 and $2.01 billion in 2025, up 5.8% from 2024 and 47% higher than pre-pandemic 2019 levels.4
JFK International Airport Revenue in 2025
JFK Airport generated $2.01 billion in gross operating revenue in 2025.4
- This represents a 5.8% increase from 2024 and is 47% higher than pre-pandemic 2019 levels.
JFK International Airport Revenue in 2024
JFK Airport generated $1.90 billion in gross operating revenue in 2024.10
- This represents a 12.7% increase from 2023 and is 39% higher than pre-pandemic 2019 levels.
Which terminals are busiest at John F. Kennedy International Airport?
Terminal 4 is JFK's busiest terminal with 26.26 million passengers in 2025.1
John F. Kennedy International Airport Terminals by Passenger Volume (2025)
Which airlines carry the most passengers at John F. Kennedy International Airport?
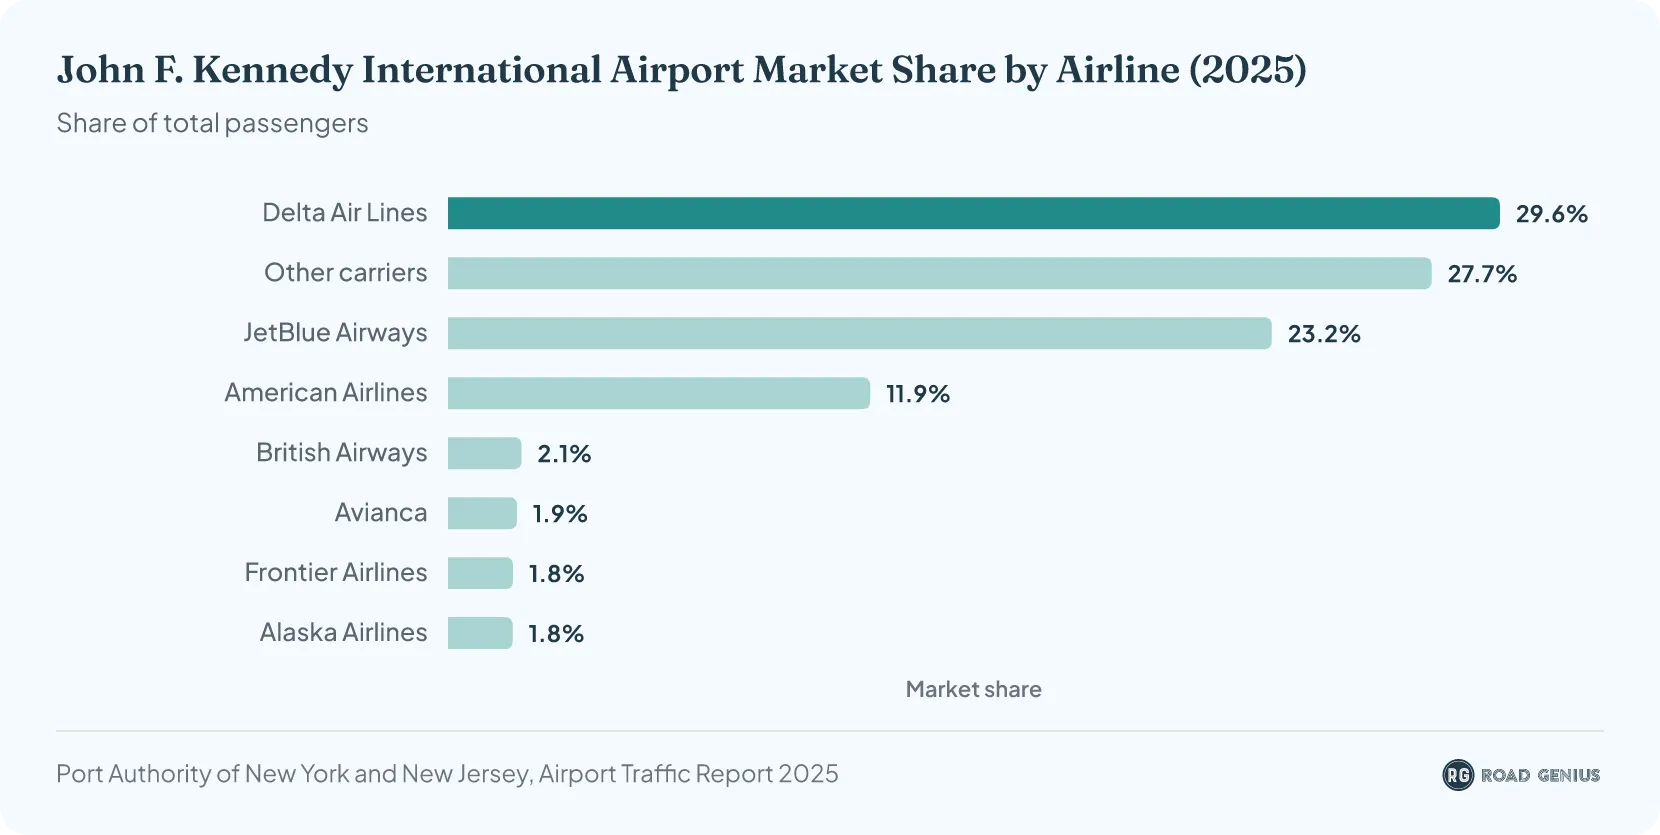
Delta Air Lines carries the most passengers at John F. Kennedy International Airport with 29.6% market share.1
Market Share by Airline at JFK (2025)
Where do John F. Kennedy International Airport's international passengers fly?
Transatlantic flights carried 19.32 million of John F. Kennedy International (JFK) Airport's 34.53 million international passengers in 2025, or 55.9%.1
- Caribbean and Bermuda flights carried 6.11 million passengers (17.7%), followed by Central and South America with 3.90 million (11.3%).1
- Transpacific flights carried 3.02 million passengers, Mexico 1.61 million and Canada 562,912.1
- From January to August 2026, transatlantic traffic fell 10.2% from the same months of 2025, while Central and South America (up 4.1%) and transpacific routes (up 3.3%) grew.2
- 41.1% of passengers departing JFK in 2025 were foreign nationals, compared with 29.0% at Newark and 17.6% at LaGuardia.1
JFK International Passengers by World Region
| Region | 2025 passengers | Share of 2025 | Jan–Aug 2026 passengers | Change vs Jan–Aug 2025 |
|---|---|---|---|---|
| Transatlantic | 19,316,194 | 55.9% | 11,733,736 | −10.2% |
| Caribbean and Bermuda | 6,112,317 | 17.7% | 4,156,542 | −5.9% |
| Central and South America | 3,901,315 | 11.3% | 2,743,856 | +4.1% |
| Transpacific | 3,024,046 | 8.8% | 2,112,352 | +3.3% |
| Mexico | 1,611,263 | 4.7% | 1,028,379 | −11.7% |
| Canada | 562,912 | 1.6% | 281,097 | −26.9% |
| All international | 34,528,047 | 100% | 22,055,962 | −7.0% |
Source · Port Authority of New York and New Jersey, Airport Traffic Data (revenue passengers), data through August 2026.
What are the busiest routes at John F. Kennedy International Airport?
Based on passenger numbers, the busiest domestic route from John F. Kennedy International (JFK) Airport is to Los Angeles (LAX), and the busiest international route is to London Heathrow (LHR).
Top Domestic Routes by Passengers (2024)
- JFK - Los Angeles (LAX)
- JFK - San Francisco (SFO)
- JFK - Miami (MIA)
- JFK - Orlando (MCO)
- JFK - San Juan (SJU)
Top International Routes by Passengers (12 Months to September 2025)
Scheduled passengers flying in both directions from October 2024 to September 2025:11
- JFK – London Heathrow (LHR): 3.19 million passengers
- JFK – Paris Charles de Gaulle (CDG): 1.76 million passengers
- JFK – Santiago de los Caballeros (STI): 1.06 million passengers
- JFK – Rome Fiumicino (FCO): 1.04 million passengers
- JFK – Santo Domingo (SDQ): 968,187 passengers11
Car Rental and Road Trips from JFK Airport
- Car Rental John F. Kennedy International Airport (JFK)
- Queens, NY
- New York
- Manhattan, NY
- Brooklyn, NY
- Campervan Rental New York
- New York to Boston
- New York to Washington, DC
- New York to Philadelphia
- New York to Niagara Falls
- New York Visitor Numbers
When is the peak month at John F. Kennedy International Airport?
How much cargo moves through John F. Kennedy International Airport each year?
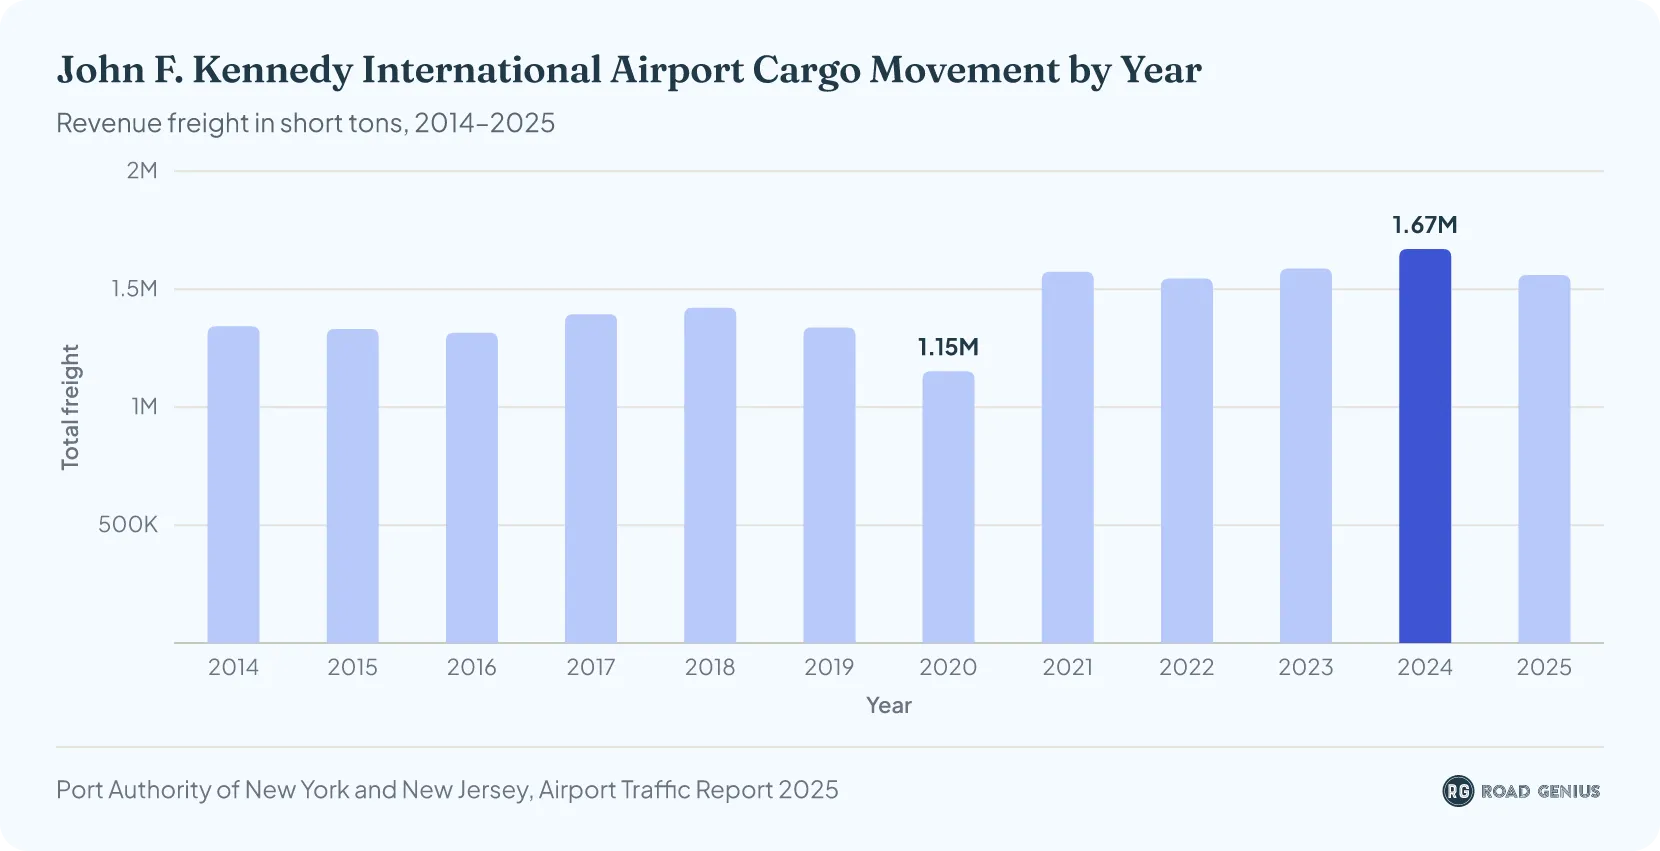
John F. Kennedy International (JFK) Airport handles approximately 1.6 million short tons of cargo each year.
- JFK Airport handled 1.34 million short tons in 2019, then dropped to 1.15 million short tons in 2020 due to the pandemic, before recovering to 1.57 million short tons in 2021.1
- Volume stabilized at 1.55 million short tons in 2022 before rising to 1.59 million short tons in 2023 and a record 1.67 million short tons in 2024.1
- In 2025, the airport processed 1.56 million short tons of cargo1, down about 7% from 2024 but approximately 17% higher than pre-pandemic 2019 levels.
How often are flights on time at John F. Kennedy International Airport?
About 75.4% of domestic flights by reporting US airlines arrived on time at John F. Kennedy International (JFK) Airport in 2025,12 and 77.3% departed on time, based on the US Department of Transportation's monthly figures.13
- That is slightly below the national rate of 76.4% on-time arrivals in 2025.13
- September was the most punctual month, with 84.1% of flights arriving on time.14
- July was the worst, with only 62.4% arriving on time15, followed by June (66.9%)16 and December (68.9%).13
- A flight counts as on time when it arrives or departs less than 15 minutes after its scheduled time.13
| JFK On-Time Performance by Month (2025) | |||
|---|---|---|---|
| Month | On-time arrivals | On-time departures | Arriving flights reported |
| January | 80.7% | 81.4% | 8,325 |
| February | 77.9% | 79.2% | 7,853 |
| March | 77.3% | 80.9% | 8,733 |
| April | 81.3% | 84.7% | 8,627 |
| May | 72.7% | 79.1% | 9,016 |
| June | 66.9% | 71.8% | 8,841 |
| July | 62.4% | 65.1% | 9,257 |
| August | 78.1% | 78.0% | 9,112 |
| September | 84.1% | 84.0% | 8,568 |
| October | 79.4% | 80.2% | 8,889 |
| November | 77.6% | 77.9% | 8,620 |
| December | 68.9% | 67.2% | 8,852 |
| Full year | 75.4% | 77.3% | 104,693 |
Source · US Department of Transportation, Air Travel Consumer Reports (Table 5), domestic flights of reporting airlines. Full-year arrival rate from the Bureau of Transportation Statistics' annual airport on-time ranking (Table 4); full-year departure rate weighted by each month's reported flights.
How does John F. Kennedy International Airport rank globally?
John F. Kennedy International (JFK) Airport ranks as the 6th busiest airport in the United States17 and 19th busiest globally by passenger traffic in 2024.18
How does JFK compare with LaGuardia and Newark airports?
John F. Kennedy International (JFK) Airport handled 62.63 million passengers in 2025, more than Newark Liberty (47.00 million) and LaGuardia (32.79 million).4
- JFK carried 43.9% of the 142.71 million passengers who used the Port Authority's airports in 2025.4
- JFK handled 34.53 million international passengers, two-thirds of the region's total, compared with 15.38 million at Newark and 1.64 million at LaGuardia.4
- JFK moved 1.56 million tons of cargo in 2025, more than twice Newark's 679,097 tons.4
- From January to August 2026, passenger traffic fell 5.6% at JFK and 3.7% at LaGuardia, while Newark's rose 0.3%.2
| New York Airports Compared (2025) | |||||
|---|---|---|---|---|---|
| Airport | Total passengers | Domestic passengers | International passengers | Plane movements | Cargo (tons) |
| John F. Kennedy International (JFK) | 62,629,455 | 28,101,408 | 34,528,047 | 464,281 | 1,560,138 |
| Newark Liberty International (EWR) | 47,000,085 | 31,615,808 | 15,384,277 | 390,476 | 679,097 |
| LaGuardia (LGA) | 32,791,050 | 31,155,133 | 1,635,917 | 354,645 | 5,468 |
Source · Port Authority of New York and New Jersey, 2025 Annual Report (Schedule G, facility traffic). 2025 figures are partly estimated and subject to revision.
How do passengers get to and from John F. Kennedy International Airport?
Ridesharing is the most common way to reach John F. Kennedy International (JFK) Airport, used by 21.9% of departing passengers in 2025, just ahead of being dropped off by car (21.5%).1
- Taxis and limos brought 16.2% of departing passengers and rail or subway 15.9%, while 3.0% arrived by rental car.1
- AirTrain JFK carried 25.78 million passengers in 2025, up 3.5% from 2024 and 23% more than in 2019.1
- 1.65 million cars paid to park at JFK in 2025, down 7.2% from 2024 and less than half the 3.34 million in 2019.1
- Taxi dispatchers loaded 1.97 million passengers at JFK in 2025, up 4.5% from 2024.1
| How Departing Passengers Reach New York Airports (2025) | |||
|---|---|---|---|
| How they arrived | JFK | LaGuardia | Newark |
| Ridesharing (e.g. Uber) | 21.9% | 41.4% | 29.2% |
| Dropped off by car | 21.5% | 13.5% | 26.0% |
| Taxi or limo | 16.2% | 15.0% | 8.8% |
| Rail or subway | 15.9% | 4.8% | 5.0% |
| Own or company car | 13.9% | 10.0% | 16.1% |
| Bus, shuttle or coach | 4.1% | 9.8% | 6.5% |
| Rental car | 3.0% | 3.5% | 5.0% |
| Other | 3.4% | 2.1% | 3.5% |
Source · Port Authority of New York and New Jersey, 2025 Airport Traffic Report (profile of departing passengers, ACI ASQ survey).
What is John F. Kennedy International Airport's economic impact?
References
- Port Authority of NY & NJ — 2025 Annual Airport Traffic Report · panynj.gov ↑ b c d e f g h i j k l m n o p q r s t u v w x y z a2 b2 c2 d2 e2 f2 g2 h2 i2 j2 k2 l2 m2 n2 o2 p2 q2 r2 s2 t2 u2 v2 w2 x2
- Port Authority of NY & NJ — Airport Traffic Data (monthly passenger and flight data, CSV) · panynj.gov ↑ b c d
- FAA Aeronautical Information Publication (AIP), Part 3 AD 2.0 — New York (KJFK) · faa.gov ↑
- Port Authority of New York and New Jersey — 2025 Annual Report (Schedule E, Information on Port Authority Operations) · panynj.gov ↑ b c d e f g
- Port Authority of New York and New Jersey — 2019 Financial Statements (Schedule E, Information on Port Authority Operations) · panynj.gov ↑
- Port Authority of New York and New Jersey — 2020 Annual Report (Schedule E, Information on Port Authority Operations) · panynj.gov ↑
- Port Authority of New York and New Jersey — 2021 Annual Report (Schedule E, Information on Port Authority Operations) · panynj.gov ↑
- Port Authority of New York and New Jersey — 2022 Annual Report (Schedule E, Information on Port Authority Operations) · panynj.gov ↑
- Port Authority of New York and New Jersey — 2023 Annual Report (Schedule E, Information on Port Authority Operations) · panynj.gov ↑
- Port Authority of New York and New Jersey — 2024 Annual Report (Schedule E, Information on Port Authority Operations) · panynj.gov ↑ b
- U.S. International Air Passenger and Freight Statistics Report, September 2025 (year ended September 2025) · transportation.gov ↑ b
- BTS — Table 4: Ranking of Major Airport On-Time Arrival Performance, Year-to-date December 2003–December 2025 · bts.gov ↑
- U.S. DOT Air Travel Consumer Report, February 2026 (December 2025 flight data) · transportation.gov ↑ b c d
- U.S. DOT Air Travel Consumer Report, November 2025 (September 2025 flight data) · transportation.gov ↑
- U.S. DOT Air Travel Consumer Report, September 2025 (July 2025 flight data) · transportation.gov ↑
- U.S. DOT Air Travel Consumer Report, August 2025 (June 2025 flight data) · transportation.gov ↑
- FAA — Commercial Service Enplanements and Hub Classification, CY2024 · faa.gov ↑
- ACI — World’s Busiest Airports Revealed in Final Global Rankings · aci.aero ↑ b
- Multiple Airport Statistics: Different Airports from multiple countries — BGR#how-much-cargo-moves-through-bangor-0b603a · faa.gov ↑
- John F. Kennedy International Airport Official Statistics · panynj.gov
- BTS TranStats — Airport profiles (route information by airport) · transtats.bts.gov

