

 Popular Countries
 24/7 Support
Published Sep 9, 2026
Billings Logan International Airport sits about 2 miles northwest of downtown Billings, Montana, atop the Rims, a 500-foot cliff overlooking the city. Opened in 1928, it is the main commercial airport for the region.
How many passengers use Billings Logan International Airport each year?
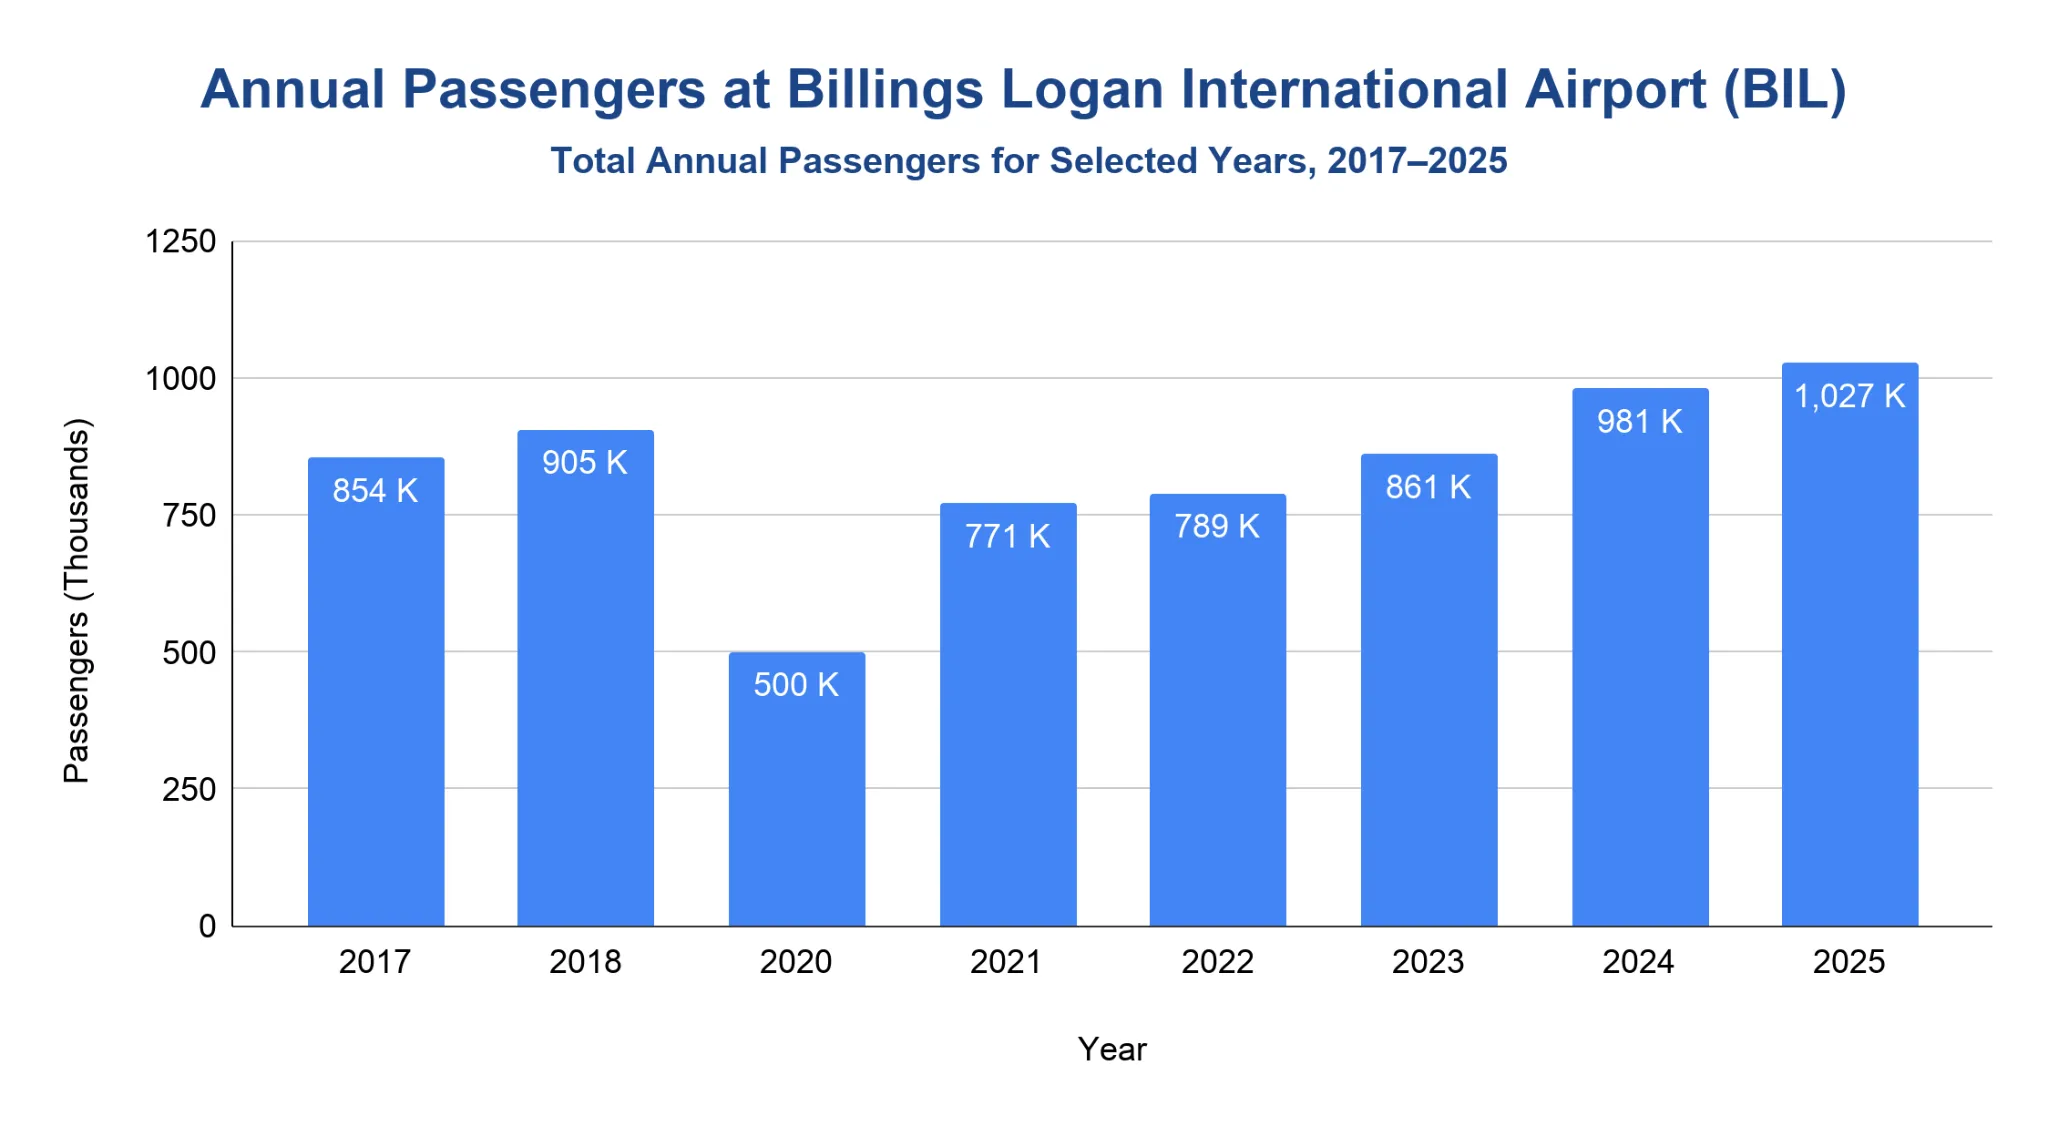
Billings Logan International Airport handled 1.03 million passengers in 2025.
- Total passenger traffic rose from 980,676 in 2024 to 1,026,611 in 2025.
- The airport served 904,873 passengers in 2018 and 853,559 in 2017 before falling to 499,945 in 2020.
- Passenger totals recovered to 771,359 in 2021, 788,684 in 2022, 860,739 in 2023, 980,676 in 2024, and 1,026,611 in 2025.
- As of February 2026, the airport had recorded 136,867 total passengers.
Note: Total passengers equal enplanements plus deplanements. Exact total-passenger values for 2014–2016 and 2019 are currently missing from the archived airport statistics.
Domestic and International Flight Operations at Billings Logan International Airport
BIL’s passenger traffic was entirely domestic in the latest BTS data.
- BTS shows that from 2016 through 2025, Billings Logan International Airport recorded no international passengers.
- That means the airport operated as a domestic passenger airport throughout the period.
- No approved official source reviewed for this article showed recurring international passenger service at BIL during those years.
Note: This section is based on BTS passenger data, so the claim applies to passengers*, not every aircraft movement or charter operation.*
How many aircraft operations take place at Billings Logan International Airport each year?
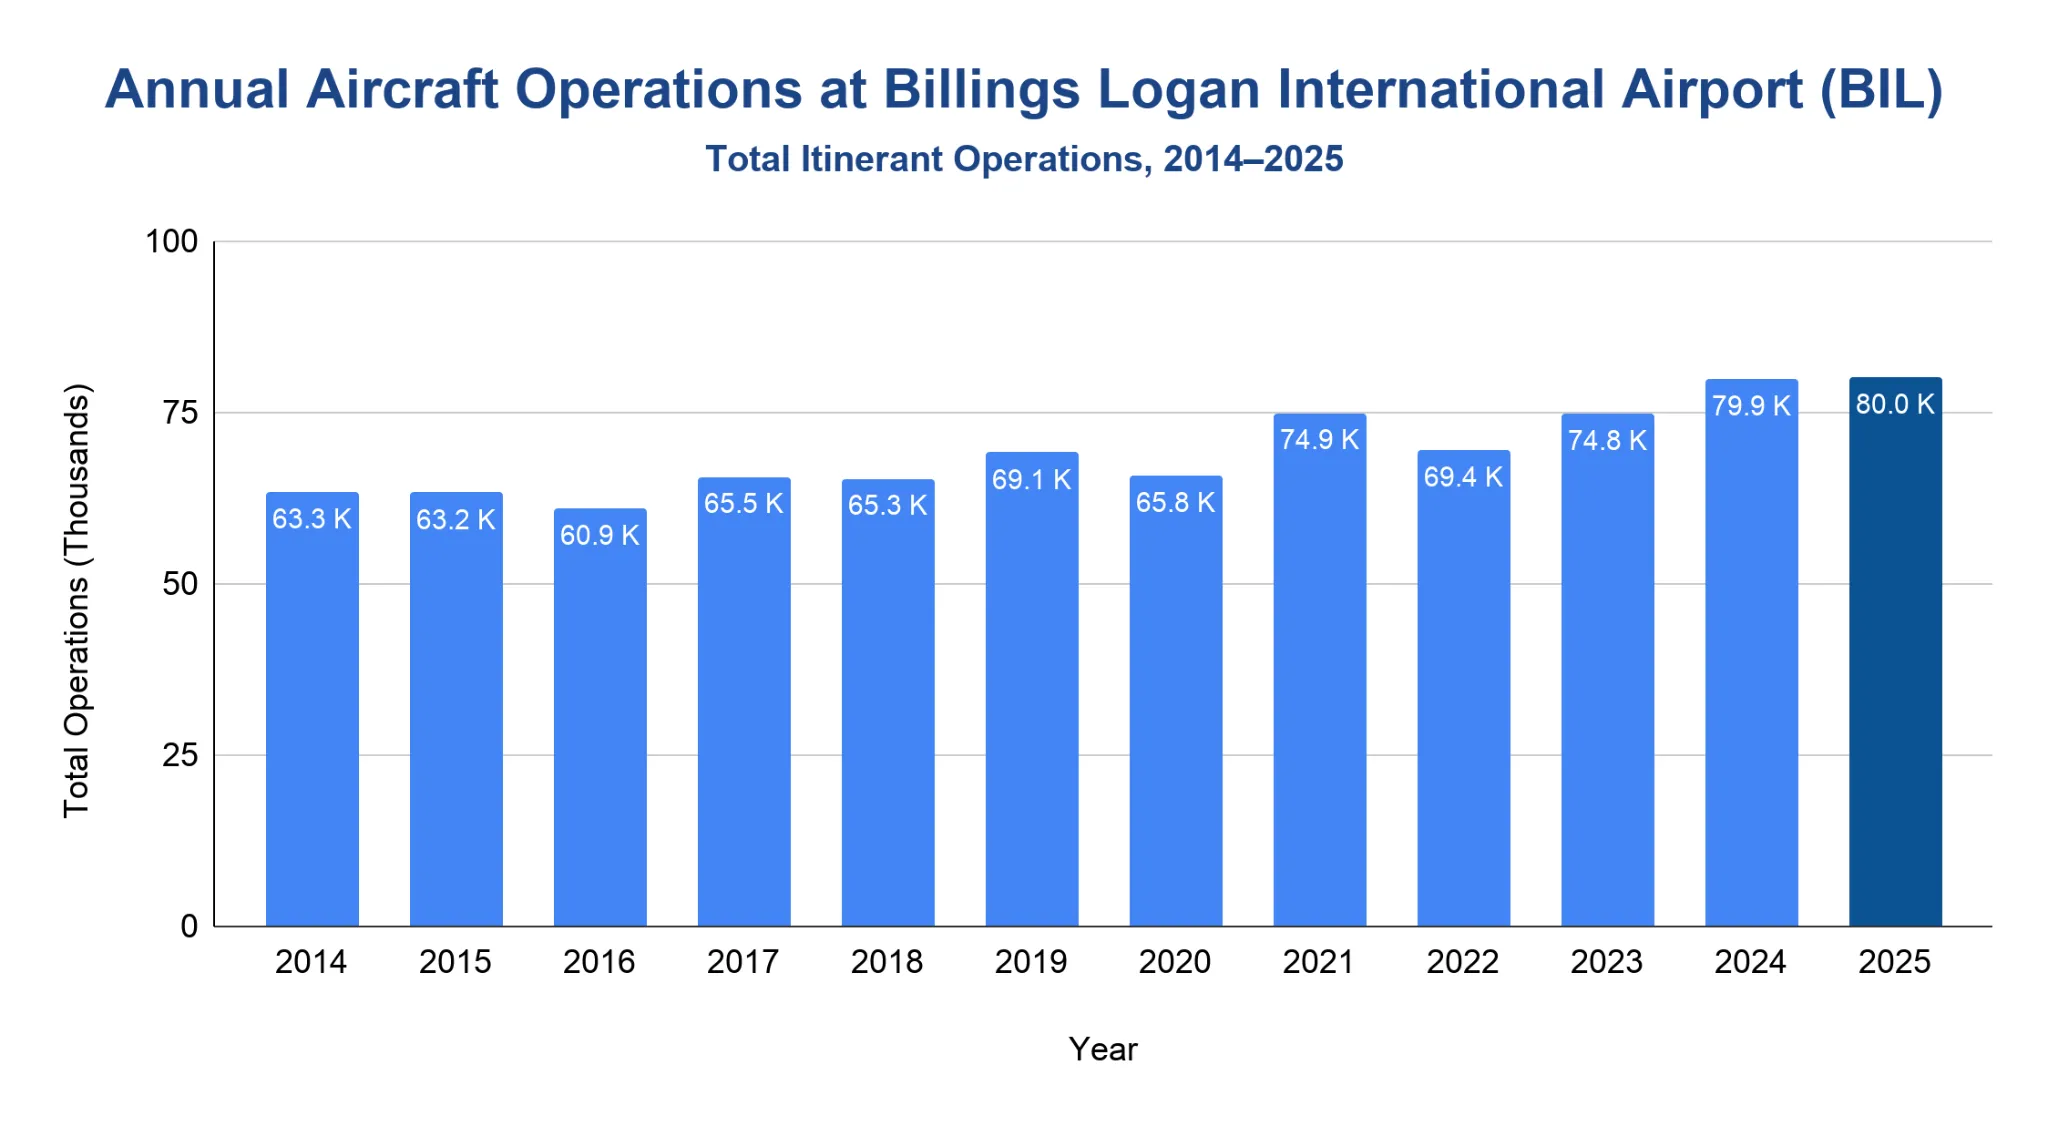
Billings Logan International Airport recorded 80,049 itinerant aircraft operations in 2025.
- OPSNET shows BIL’s itinerant operations rising slightly from 79,861 in 2024 to 80,049 in 2025.
- Activity stood at 69,101 operations in 2019, dipped to 65,776 in 2020, and then recovered to 74,903 in 2021 before reaching a new high in 2025.
- General aviation was the largest segment in 2025 with 35,655 operations, followed by air taxi at 28,650, air carrier at 13,838, and military at 1,906.
- Compared with 2014, total itinerant operations were up 26.4% by 2025.
| Year | Air carrier | Air taxi | General aviation | Military | Total |
|---|---|---|---|---|---|
| 2014 | 10,728 | 27,758 | 24,322 | 515 | 63,323 |
| 2015 | 10,036 | 26,516 | 26,303 | 385 | 63,240 |
| 2016 | 10,295 | 25,854 | 24,075 | 681 | 60,905 |
| 2017 | 10,908 | 26,540 | 26,997 | 1,093 | 65,538 |
| 2018 | 11,682 | 26,314 | 25,946 | 1,331 | 65,273 |
| 2019 | 12,248 | 28,965 | 26,462 | 1,426 | 69,101 |
| 2020 | 11,435 | 28,400 | 24,439 | 1,502 | 65,776 |
| 2021 | 13,622 | 29,909 | 30,049 | 1,323 | 74,903 |
| 2022 | 11,609 | 26,191 | 30,724 | 919 | 69,443 |
| 2023 | 12,182 | 29,794 | 31,343 | 1,523 | 74,842 |
| 2024 | 13,420 | 29,135 | 34,884 | 2,422 | 79,861 |
| 2025 | 13,838 | 28,650 | 35,655 | 1,906 | 80,049 |
Source · Note: This section uses the Federal Aviation Administration (FAA) Operations Network (OPSNET) Airport Operations Standard Report for itinerant operations only, so the figures do not include local civil tower operations.
Leading Airlines at Billings Logan International Airport
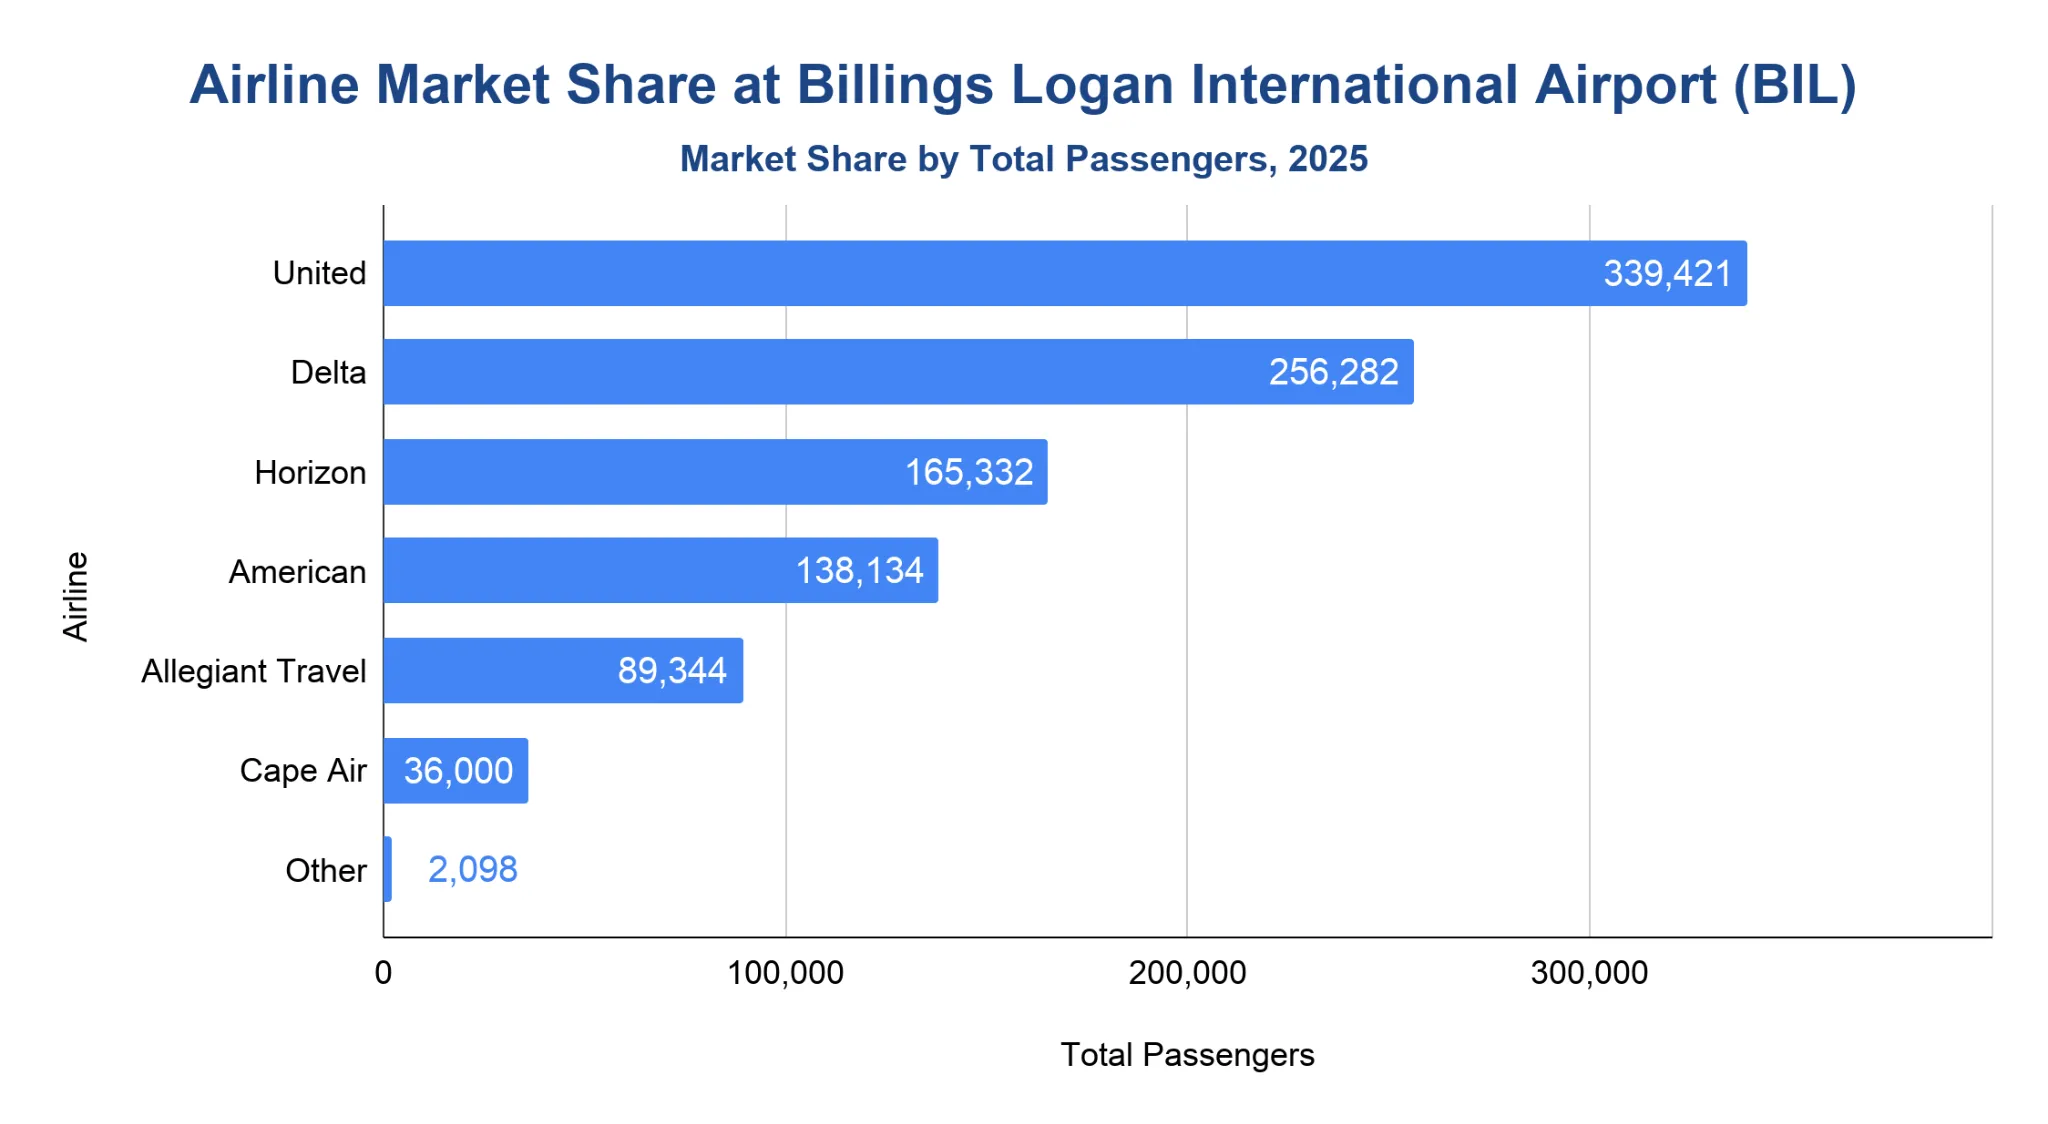
United carried 339,421 total passengers at BIL in 2025.
- Delta followed with 256,282 total passengers, while Horizon reached 165,332 and American 138,134.
- Allegiant handled 89,344 total passengers and Cape Air 36,000.
- United accounted for 33.1% of total passengers in 2025, ahead of Delta at 25.0%, Horizon at 16.1%, and American at 13.5%.
- As of February 2026, United remained the leading carrier with 44,047 total passengers, followed by Delta at 36,606 and Horizon at 20,399.
Note: Total passengers equal each airline’s enplanements plus deplanements from the airport’s Operations Reports.
What are the most popular routes from Billings Logan International Airport?
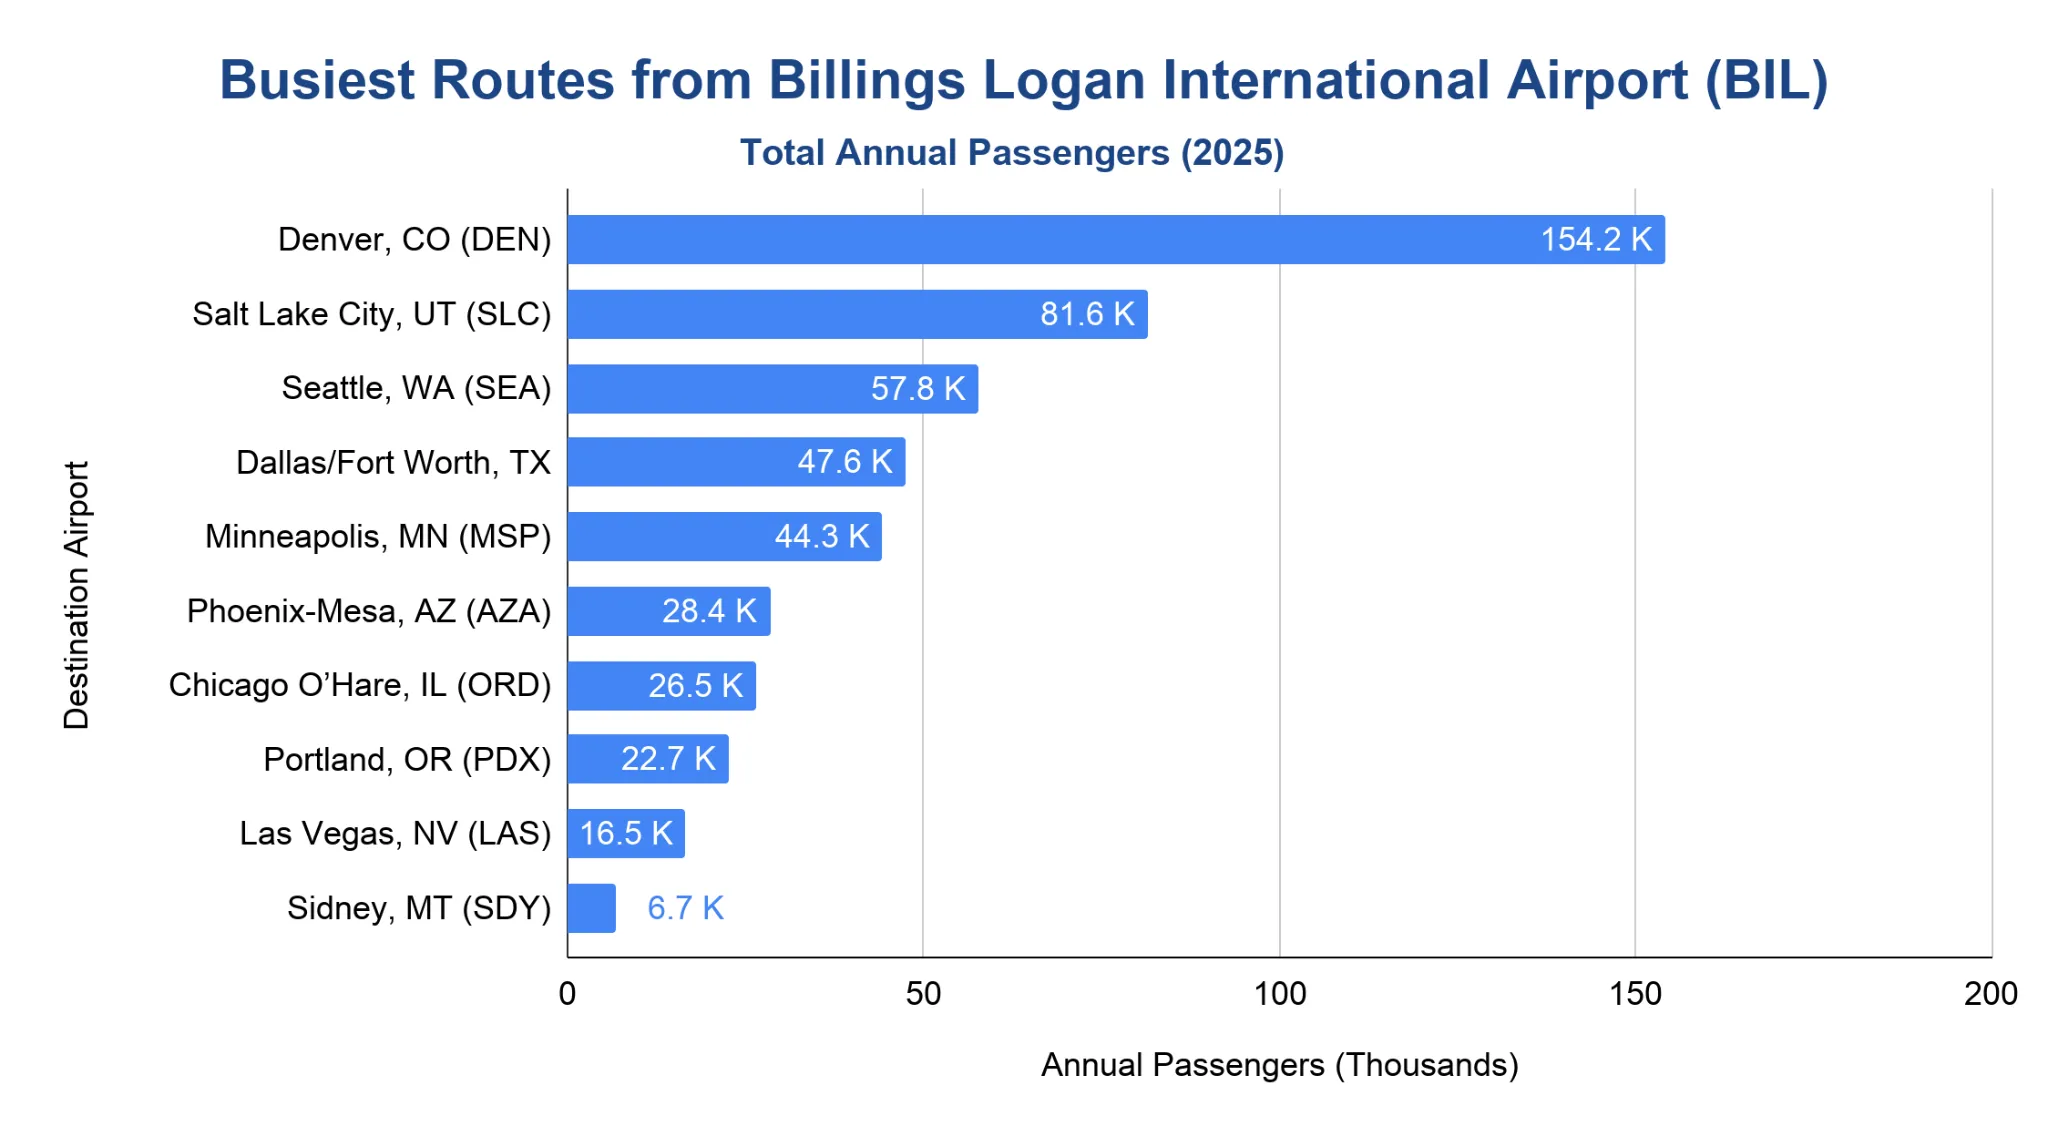
Denver was BIL’s busiest U.S. destination in 2025 with 154,190 passengers.
- Salt Lake City ranked second with 81,600 passengers, followed by Seattle at 57,750 and Dallas/Fort Worth at 47,550.
- Minneapolis handled 44,260 passengers, while Phoenix-Mesa reached 28,430 and Chicago O’Hare 26,510.
- Portland recorded 22,670 passengers and Las Vegas 16,480, with Sidney, Montana rounding out the top 10 at 6,700.
- Denver alone accounted for about 31.7% of the passengers across BIL’s top 10 U.S. destination airports.
Note: This section uses BTS T-100 Domestic Market (U.S. Carriers) passenger data, so it covers U.S.-only destination airports and scheduled-service market passengers.
Peak Travel Months at Billings Logan International Airport
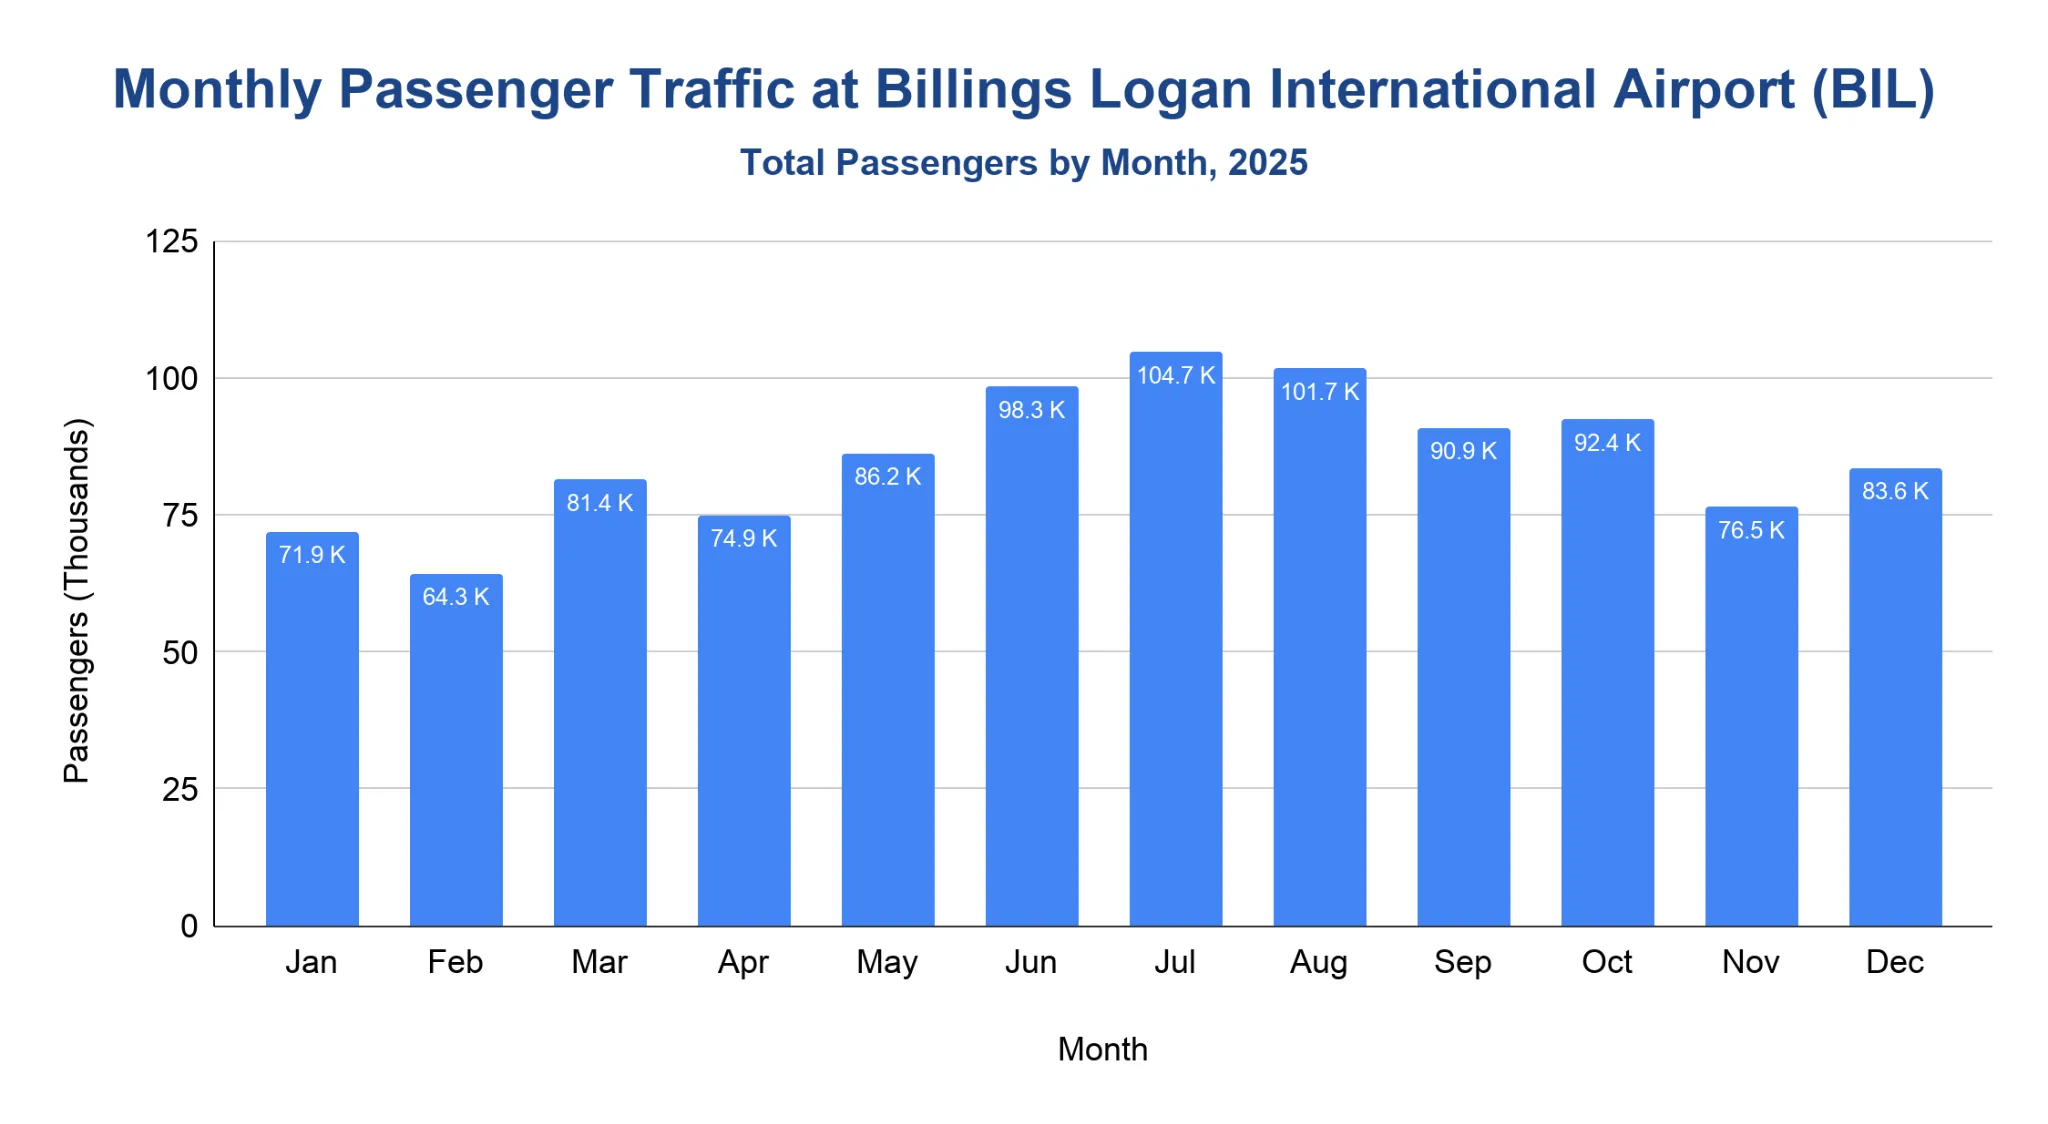
July 2025 was the busiest month of the year with 104,696 total passengers.
- Summer was the strongest travel period, with 98,302 passengers in June, 104,696 in July, and 101,657 in August.
- Those three months combined for 304,655 passengers, or 29.7% of the airport’s 2025 annual total.
- February was the quietest month at 64,282 passengers.
- Traffic stayed elevated into early autumn, with 90,869 passengers in September and 92,416 in October.
- December closed the year at 83,552 passengers.
Note: Monthly totals equal enplanements plus deplanements from the airport’s monthly Operations Reports.
How much cargo passes through Billings Logan International Airport each year?
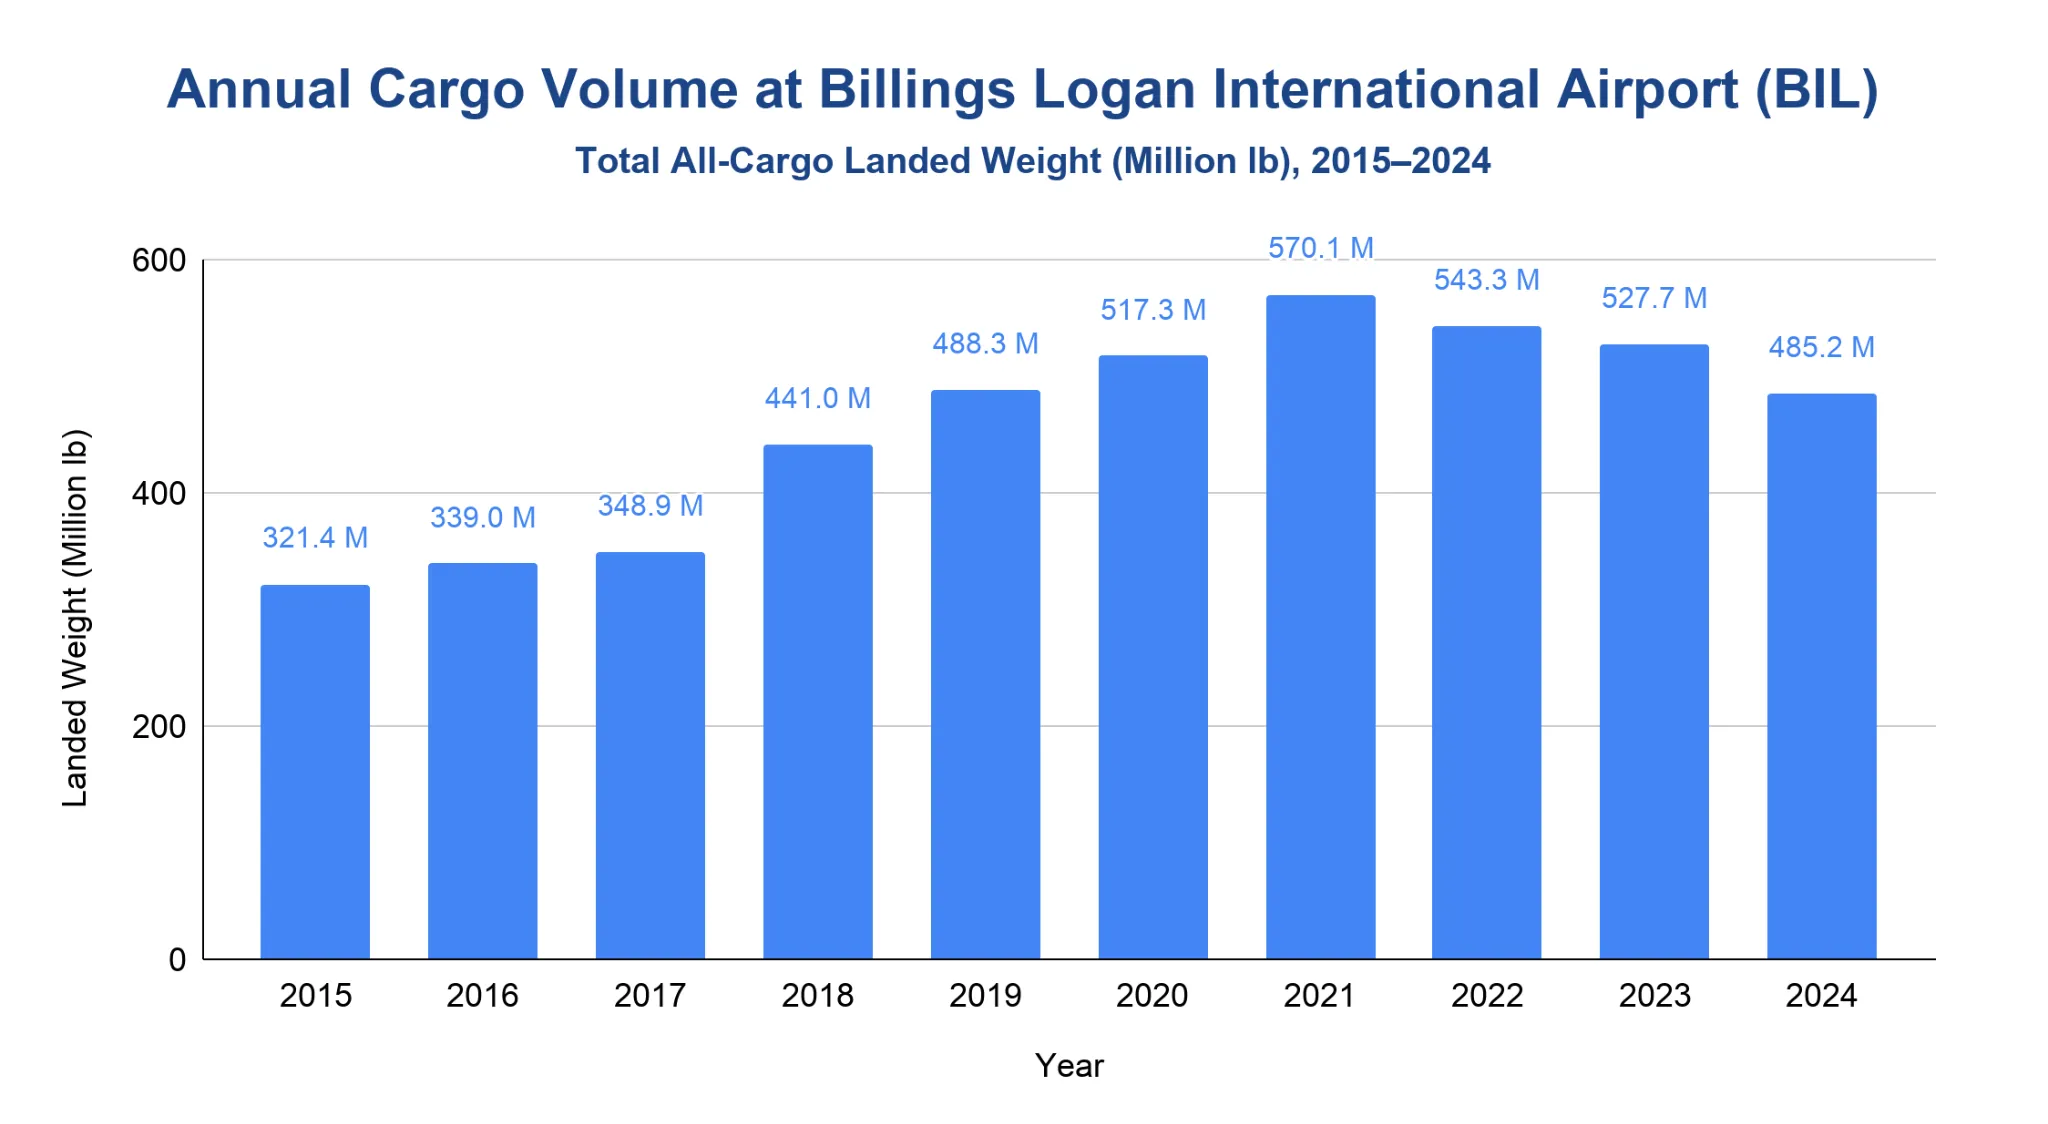
Billings Logan International Airport recorded 485.18 million lb of FAA all-cargo landed weight in 2024.
- The FAA series rose from 321.41 million lb in 2015 to 485.18 million lb in 2024.
- Landed weight peaked at 570.06 million lb in 2021 before easing to 543.27 million lb in 2022, 527.66 million lb in 2023, and 485.18 million lb in 2024.
- The 2024 total was 8.0% lower than 2023.
- Preliminary FAA all-cargo data for 2025 was not yet available at the time of review.
Note: This section uses the FAA’s all-cargo landed-weight series. In the FAA historical files used here, BIL’s 2014 landed weight is shown as 0.
How much revenue does Billings Logan International Airport generate?
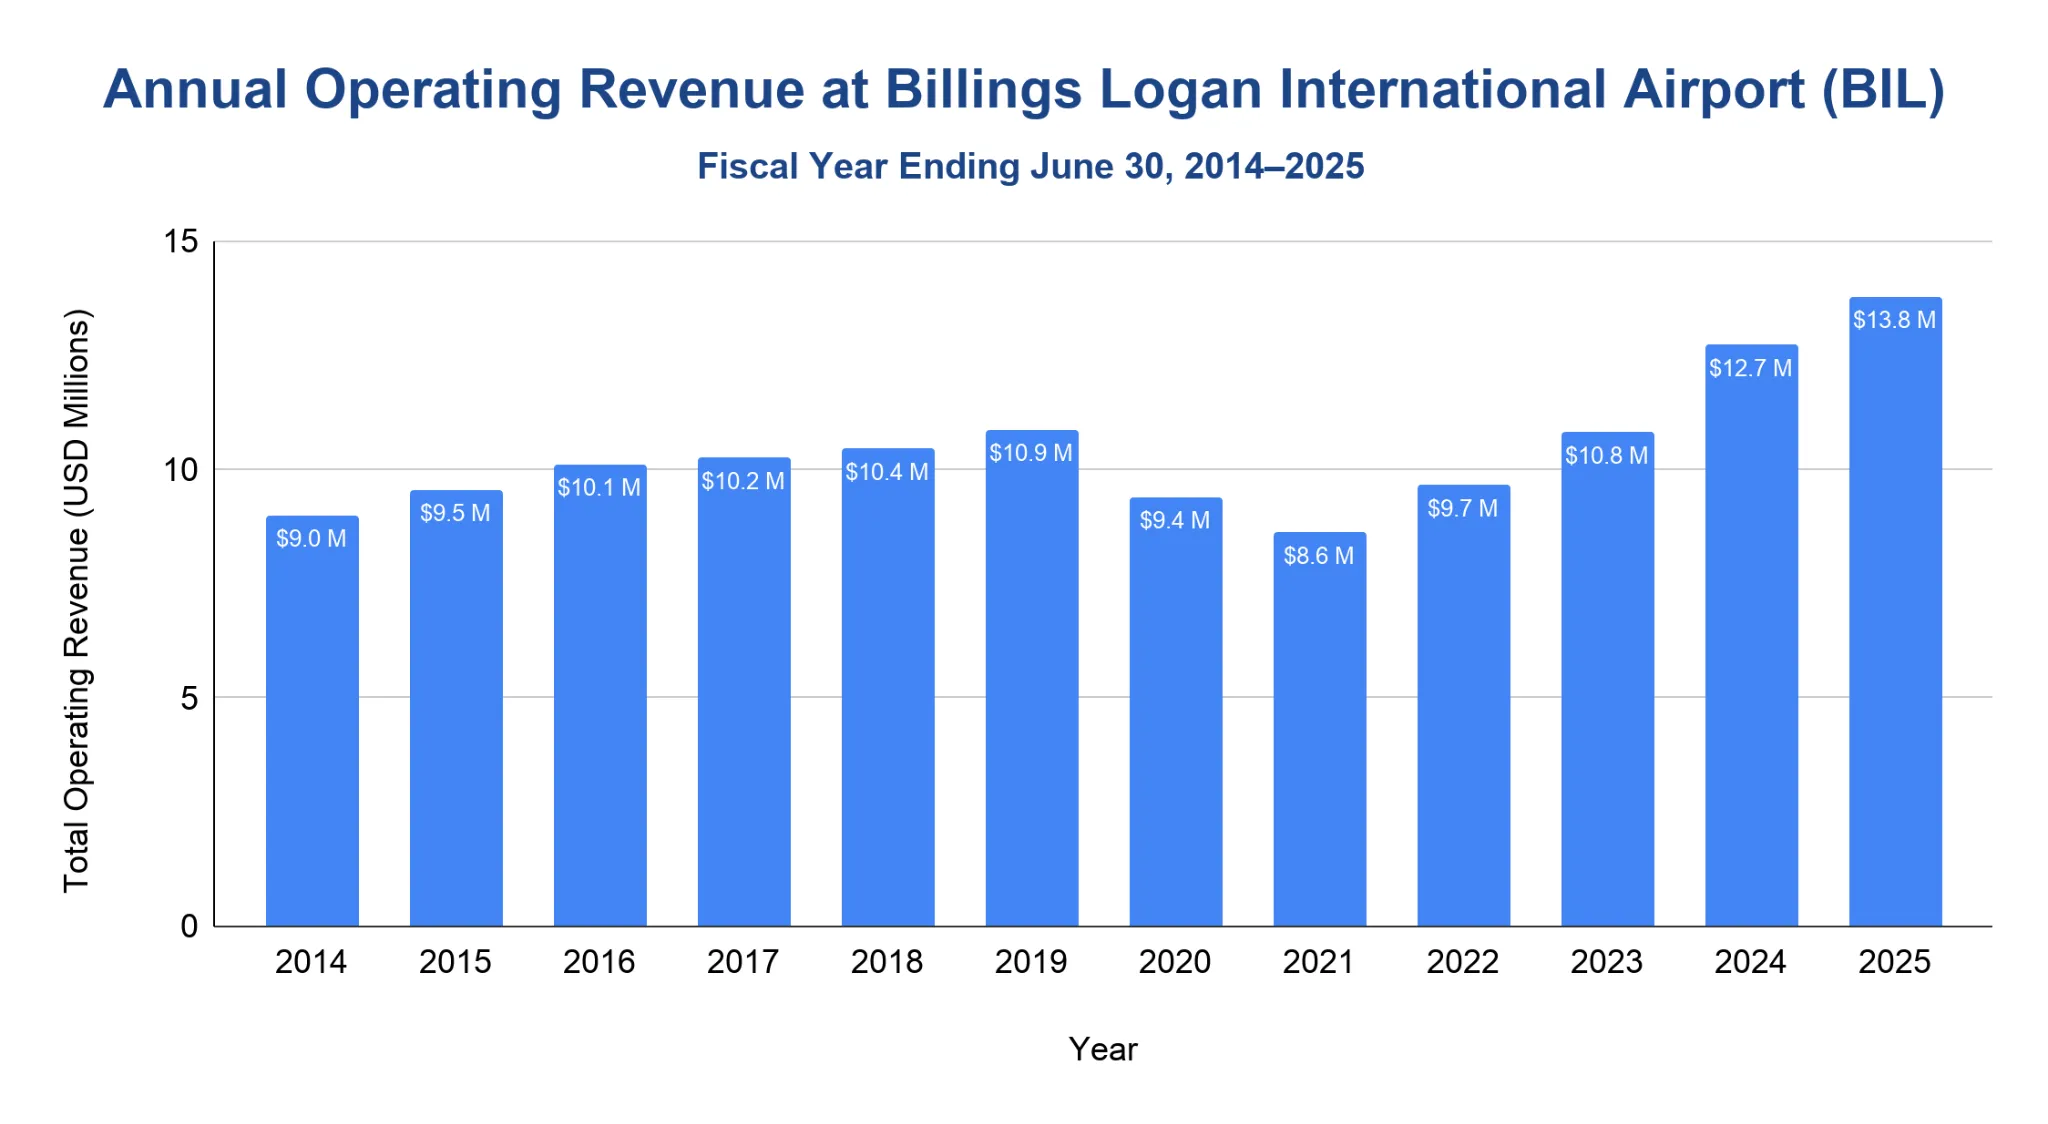
BIL generated $13.78 million in total operating revenue in fiscal 2025.
- Total operating revenue rose from $12.72 million in fiscal 2024 to $13.78 million in fiscal 2025.
- Revenue increased steadily from $9.00 million in fiscal 2014 to $10.86 million in fiscal 2019 before falling to $9.38 million in fiscal 2020 and $8.61 million in fiscal 2021.
- The airport returned to growth in fiscal 2022 with $9.65 million, then climbed to $10.81 million in fiscal 2023, $12.72 million in fiscal 2024, and $13.78 million in fiscal 2025.
- The fiscal 2025 total was 8.3% higher than fiscal 2024 and 27.0% above the pre-pandemic fiscal 2019 level.
Note: This section uses the FAA CATS metric Total Operating Revenue for fiscal years ending on June 30.
On-Time Performance at Billings Logan International Airport
BIL posted 85% on-time departures and 80% on-time arrivals in 2025.
- On-time departure performance held fairly steady from 88% in 2020 to 85% in 2025, while on-time arrivals moved from 86% to 80% over the same period.
- Cancellation rates improved sharply after 2020, falling from 3.67% to 0.87% in 2025.
- BTS reported 4,841 flights for BIL in 2025, up from 3,481 in 2023 and 4,149 in 2024.
- Average delay for delayed departures rose to 101.44 minutes in 2025, while average delay for delayed arrivals was 59.91 minutes.
| Metric | 2020 | 2021 | 2022 | 2023 | 2024 | 2025 |
|---|---|---|---|---|---|---|
| On-time departures | 88% | 87% | 85% | 86% | 86% | 85% |
| On-time arrivals | 86% | 84% | 80% | 81% | 81% | 80% |
| Avg departure delay (min.) | 86.72 | 89.98 | 85.62 | 94.52 | 88.25 | 101.44 |
| Avg arrival delay (min.) | 52.02 | 58.21 | 59.83 | 65.73 | 61.40 | 59.91 |
| Cancellation rate | 3.67% | 1.50% | 1.08% | 1.26% | 0.77% | 0.87% |
| Number of flights | 3,409 | 5,467 | 4,160 | 3,481 | 4,149 | 4,841 |
Source · Note: Source is BTS on-time performance data for major U.S. carriers. A delay is 15 minutes or more. Average delays apply only to delayed flights. BTS publishes average delays in decimal-minute format. As such, the values have been kept exactly as reported to avoid altering the underlying data.
- Bozeman Airport (BZN) Statistics
- Colorado Springs Airport Statistics
- Dallas Fort Worth Airport Statistics
- Flint Bishop International Airport Statistics
- Fresno Yosemite International Airport Statistics
- George Bush Airport (IAH) Statistics
- Harrisburg Airport (MDT) Statistics
- JFK Airport Statistics
- Los Angeles International Airport Statistics
- Missoula Montana Airport (MSO) Statistics
- Orlando Airport (MCO) Statistics
- Seattle-Tacoma International Airport Statistics
How does Billings Logan International Airport rank nationwide?
FAA recorded 475,334 enplanements at BIL in 2024, classifying the airport as a non-hub primary airport.
- Within Montana, BIL ranked 4th behind Bozeman at 1,321,790, Missoula at 511,553, and Kalispell at 503,816 enplanements.
- FAA’s 2019 file placed BIL 136th nationwide with 468,888 enplanements, when the airport was classified as a small hub primary airport.
- The airport’s official overview says BIL supports about 3,265 jobs and approximately $408.76 million in annual economic impact.
Note: FAA rankings and hub classifications are based on enplanements, not total passengers.
References
- Billings Airport Overview · flybillings.com
- Billings Airport Master Plan · flybillings.com
- Billings Airport Statistics Archive (2006–2026) · flybillings.com
- Bureau of Transportation Statistics Airport Summary Database (2016–2025) · transtats.bts.gov
- Bureau of Transportation Statistics Airport Data Elements Guide · transtats.bts.gov
- FAA OPSNET Airport Operations Standard Report (2014–2025) · aspm.faa.gov
- FAA Certification Activity Tracking System (CATS) Reports (FY 2014–FY 2025) · cats.airports.faa.gov
- FAA Passenger Boarding and All-Cargo Data Master · faa.gov
- FAA Passenger Boarding and All-Cargo Previous Years Data (2014–2024) · faa.gov

