

 Popular Countries
 24/7 Support
Published Sep 9, 2026
Appleton International Airport (ATW) serves as Wisconsin's third-busiest airport and the primary air gateway for the Fox Cities region of northeast Wisconsin. It connects Appleton, Green Bay, and the surrounding communities to destinations across the United States through multiple partner airlines.
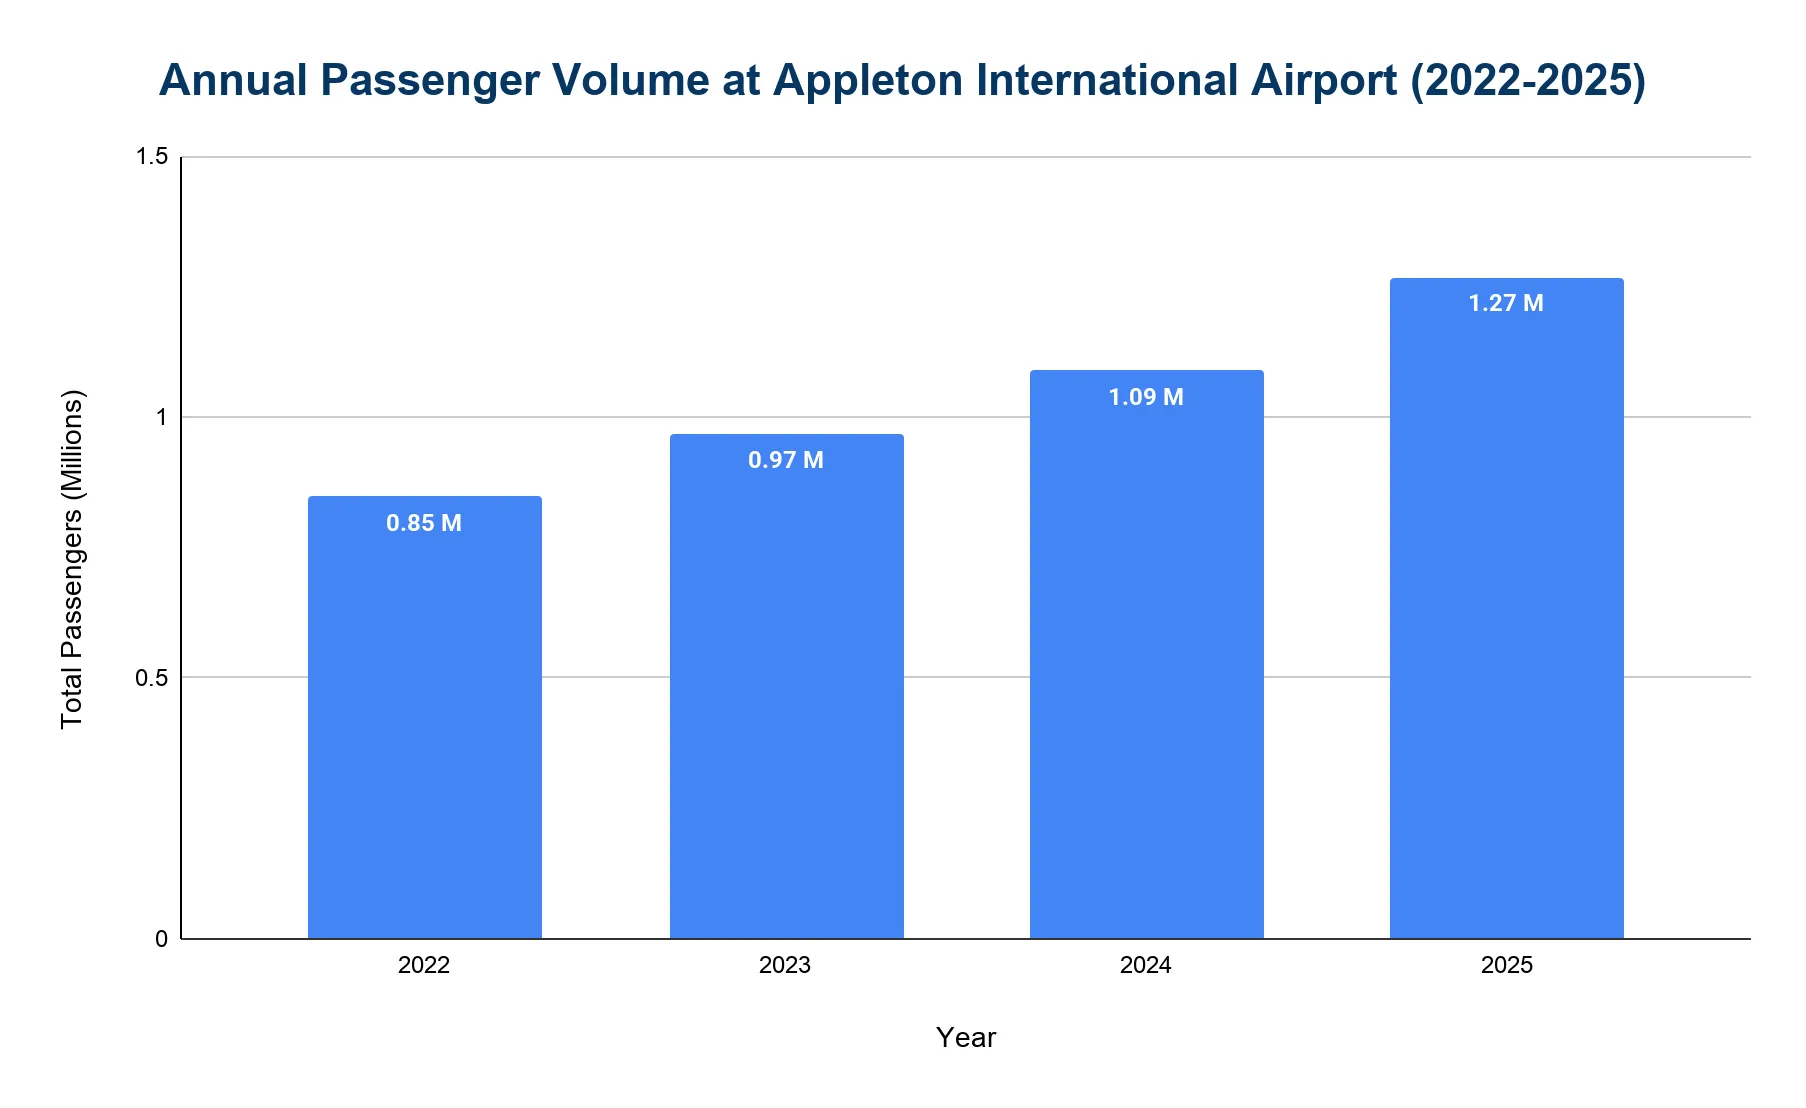
How many passengers pass through Appleton International Airport each year?
Appleton International Airport handles over 1 million passengers annually.
What is the total number of aircraft operations at Appleton International Airport each year?
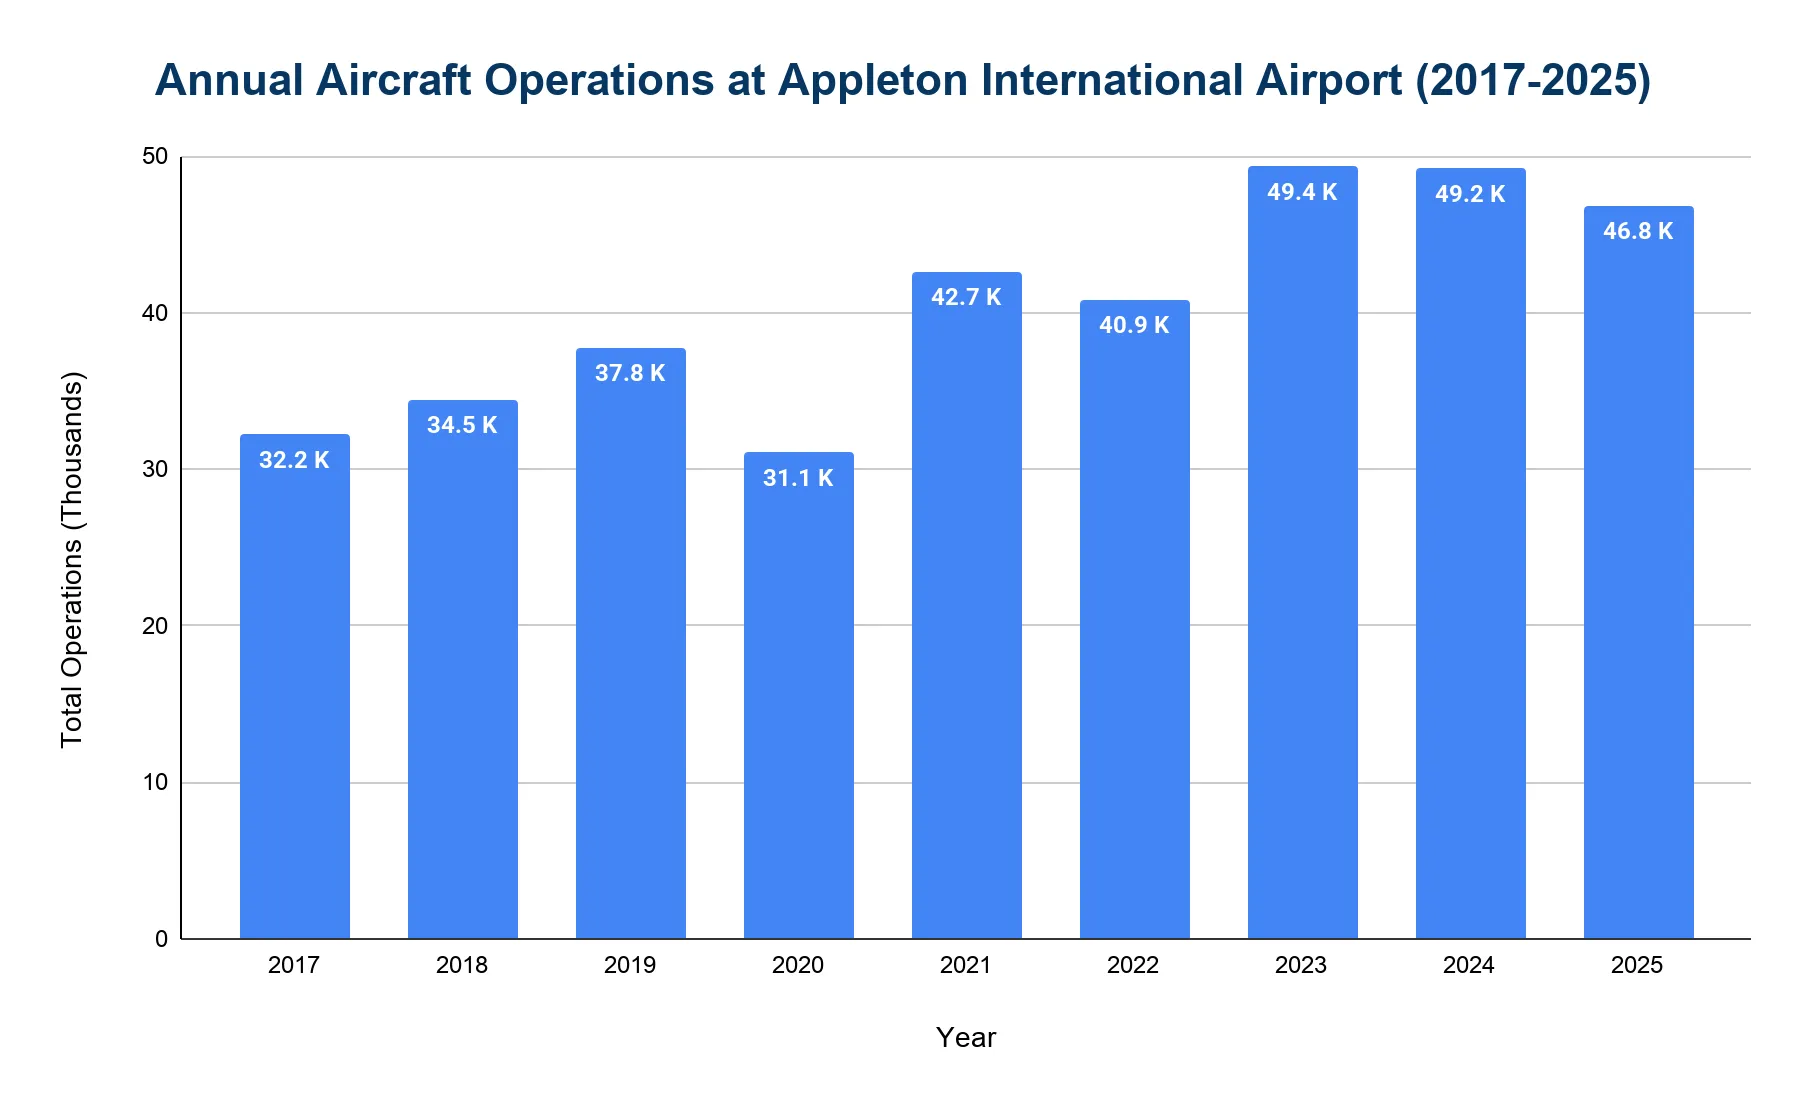
Appleton International Airport sees approximately 49,000 takeoffs and landings per year.
- The airport recorded 46,832 total aircraft movements in 2025, showing a 4.8% decrease from 49,207 movements in 2024.
- In 2019, operations reached approximately 37,809 and 34,458 in 2018.
- The number dropped to 31,072 in 2020, the lowest during the pandemic.
- Operations rose to 42,658 in 2021, dipped to 40,877 in 2022, then jumped to 49,384 in 2023.
Which airlines operate the most flights out of Appleton International Airport?
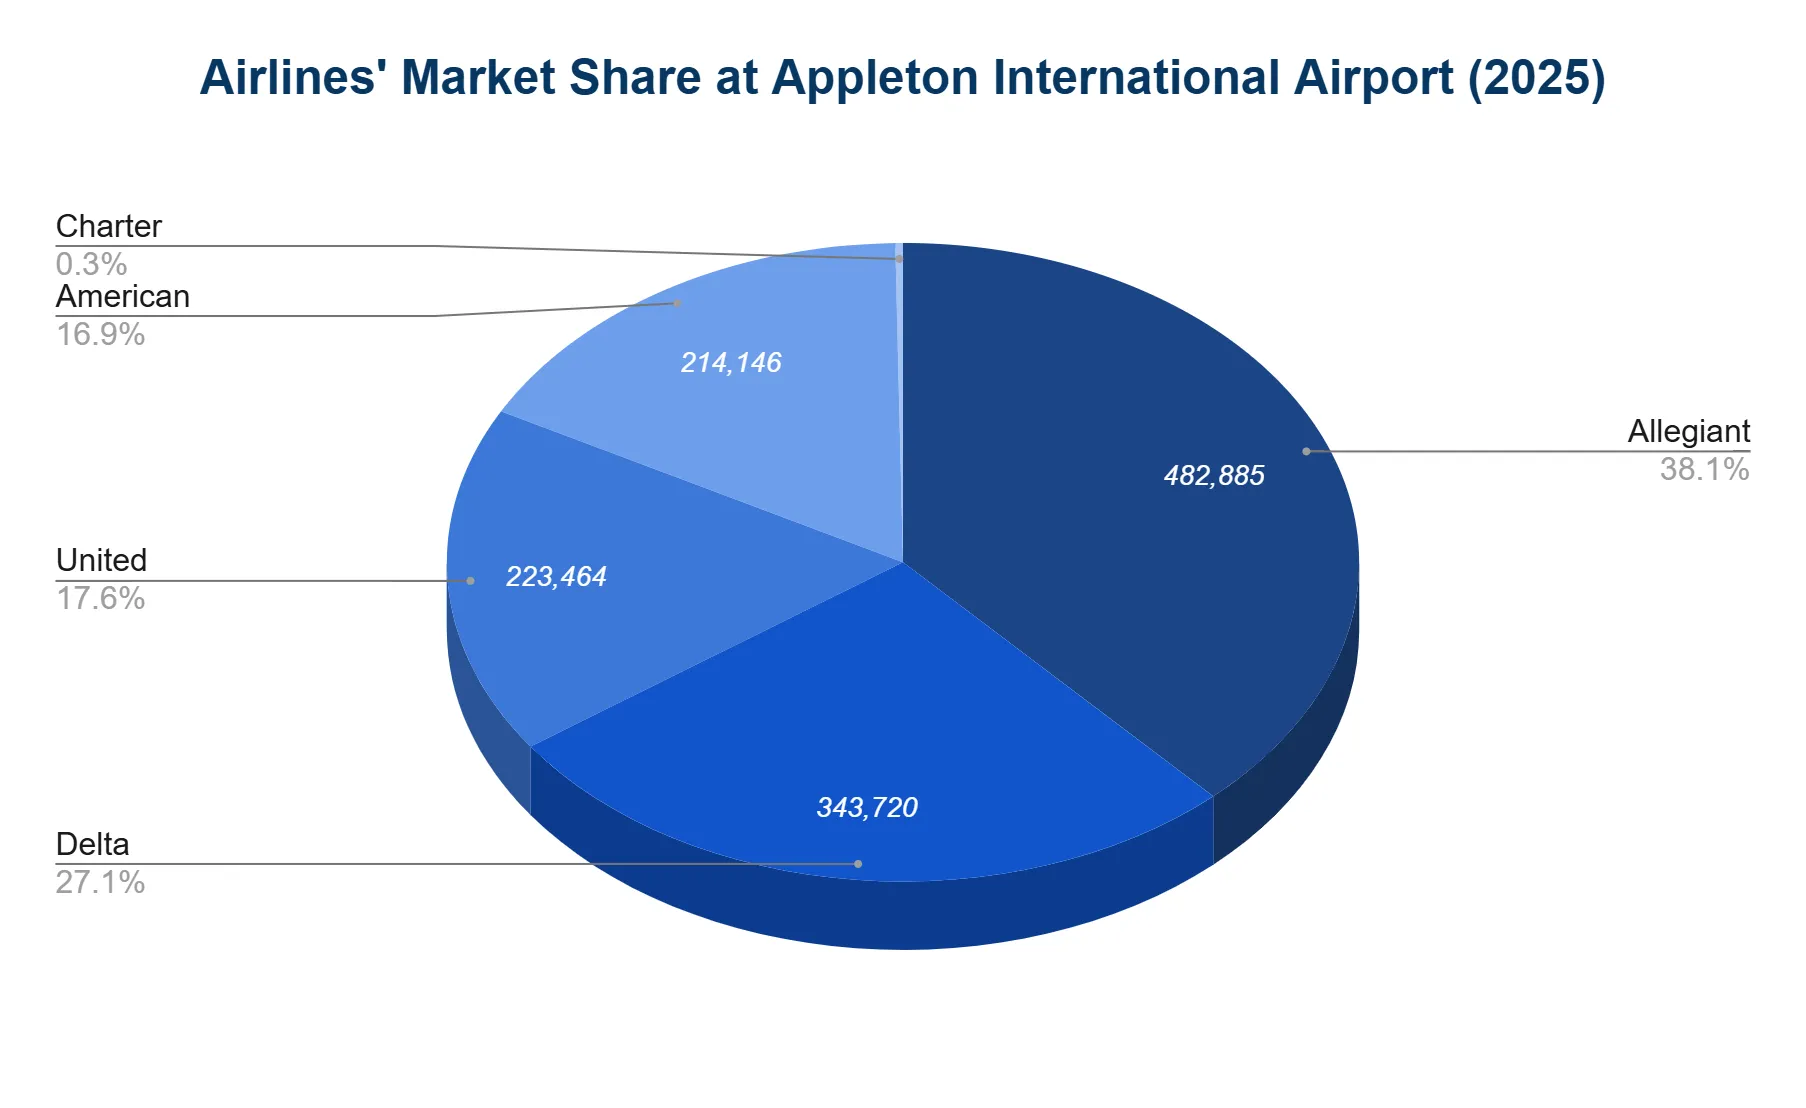
ATW is dominated by low-cost carriers and regional airlines, with Allegiant Air holding the largest shares of passenger traffic.
- In 2025, Allegiant accounted for 38.1% of annual passenger volume, about 482,885 passengers.
- Delta followed with 27.1%, or 343,720 passengers.
- United handled 17.6% (around 223,464) and American 16.9% (about 214,146).
- Charter airlines served 0.3% (roughly 3,419 passengers).
How many routes are there at Appleton International Airport?
Appleton International Airport provides approximately 23 nonstop destinations through 4 main airlines.
- Recent additions include Atlanta (Delta), Dallas/Fort Worth (American) and expanded service to Florida (Allegiant).
- The route network includes major airline hubs and vacation destinations, serving both business and leisure travelers.
Which destinations are the most popular from Appleton International Airport?
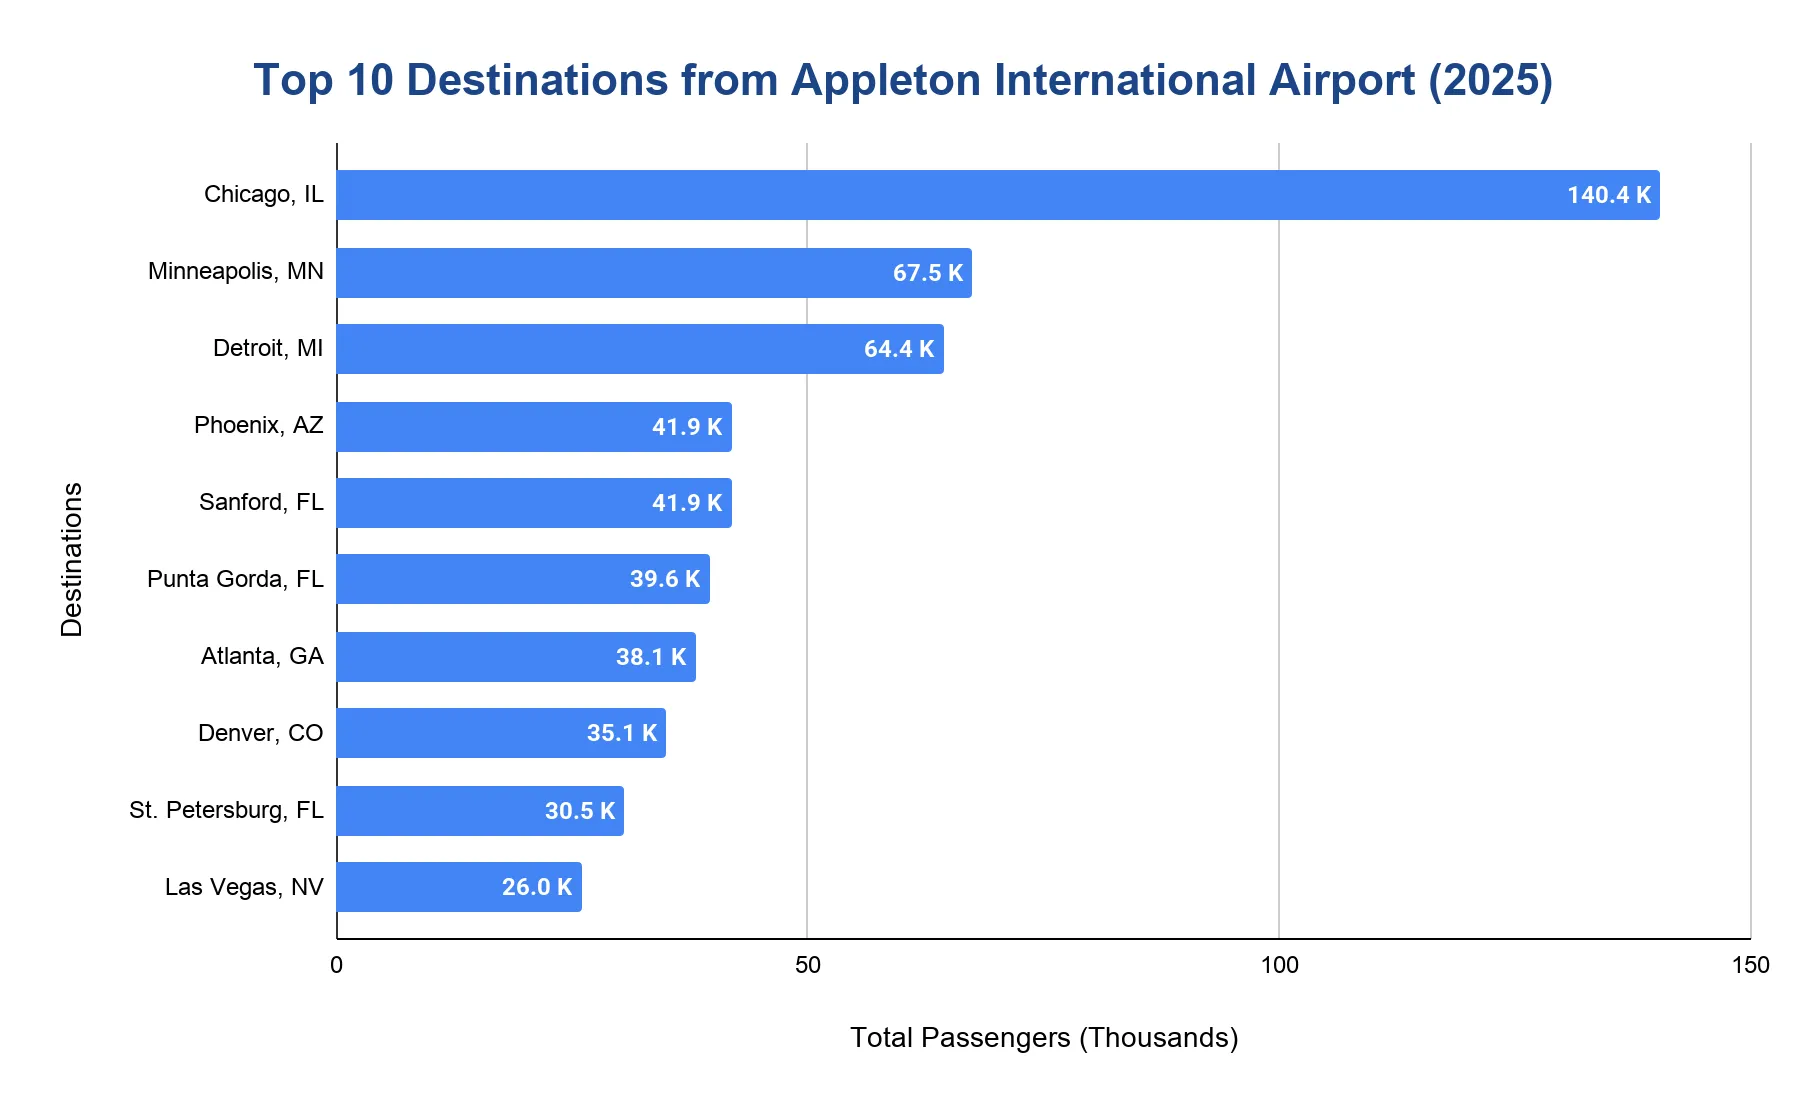
- Chicago, IL was the busiest route in 2025, with 140,420 passengers.
- Minneapolis, MN ranked second with 67,490 passengers.
- Detroit, MI followed with 64,370 passengers.
- Phoenix, AZ served 41,940 passengers, and Sanford, FL had 41,900 passengers, rounding out the top five.
How much cargo does Appleton International Airport handle annually?
ATW is a key cargo hub for northeast Wisconsin, especially for express and parcel freight handled by FedEx.
- The airport moves about 18-22 million pounds of cargo annually.
- FedEx Express is the primary cargo operator.
- Shipments include overnight parcels, business deliveries and industrial components, supporting the region's paper and manufacturing sectors.
- Dedicated cargo facilities and regular FedEx feeder flights help maintain supply chain reliability in the Fox Valley.
How many cancellations occur at Appleton International Airport annually?
Flight cancellations at ATW remain relatively low, typically under 2% annually.
- In 2025, 1.22% of domestic flights were cancelled, marking an improvement from the 1.84% rate observed in 2024.
- The highest rate occurred in 2020 at 6.03%, due to widespread disruptions and winter weather.
- Cancellations dropped to 1.25% in 2021, then rose slightly to 1.9% in 2022.
- By 2023, the rate improved to 1.06%.
Related Travel Statistics
- Colorado Springs Airport Statistics
- Daytona Beach International Airport Statistics
- Fort Lauderdale Airport (FLL) Statistics
- Grand Rapids Airport (GRR) Statistics
- Harrisburg Airport (MDT) Statistics
- Harry Reid Airport (LAS) Statistics
- Atlanta Airport (ATL) Statistics
- Idaho Falls Regional Airport Statistics
- Jacksonville International Airport Statistics
- Pittsburgh Airport (PIT) Statistics
- Punta Gorda Airport (PGD) Statistics
- Rochester Airport (ROC) Statistics
What are the main causes of flight disruptions at Appleton International Airport?
- Winter weather, especially from December through March, causes delays due to snow and de-icing.
- Summer thunderstorms impact schedules both at ATW and at major hubs like Chicago, Minneapolis and Detroit.
- Airline staffing shortages, especially among regional carriers like American and United, lead to schedule changes.
- Air traffic control delays at large Midwest airports can affect ATW arrivals and departures.
- Mechanical issues, while less frequent, occasionally contribute to delays.
What are the notable incidents at Appleton International Airport?
- June 29, 1972: A mid-air collision over Lake Winnebago between Air Wisconsin Flight 671 and a North Central CV-580 killed 13 people. It remains the deadliest event linked to ATW and led to radar and control system improvements.
- February 14, 2011: A Gulfstream G550 overran Runway 30 after a hydraulic failure. All 3 onboard survived. The incident resulted in upgraded emergency procedures.
- December 23, 2016: A Delta A330 charter carrying the Minnesota Vikings slid off a snowy taxiway. All 162 passengers were unhurt but stranded for 3 hours. The airport later enhanced winter coordination.
- August 13, 2022: A Delta Boeing 717 struck a bald eagle during takeoff to Atlanta. The plane returned safely with minor damage. No injuries were reported. The incident emphasized the need for ongoing wildlife control.
References
- Appleton International Airport — December Airline Statistics 2025 · atwairport.com ↑
- Appleton International Airport — December Airline Statistics 2023 · atwairport.com ↑
- Appleton International Airport Airline Passenger Statistics · atwairport.com
- BTS TranStats — Airport profiles (route information by airport) · transtats.bts.gov
- FAA OPSNET — George Bush Intercontinental Airport Operations Data · aspm.faa.gov
- Incidents at Jackson–Medgar Wiley Evers International Airport — NTSB · ntsb.gov

