

 Popular Countries
 24/7 Support
Updated
Fort Lauderdale-Hollywood International Airport (FLL) is South Florida’s second-busiest airport and a key entry point to Latin America and the Caribbean. Just 3 miles from downtown Fort Lauderdale and 21 miles north of Miami, FLL links North America with dozens of leisure destinations worldwide.
How many passengers pass through Fort Lauderdale-Hollywood International Airport each year?
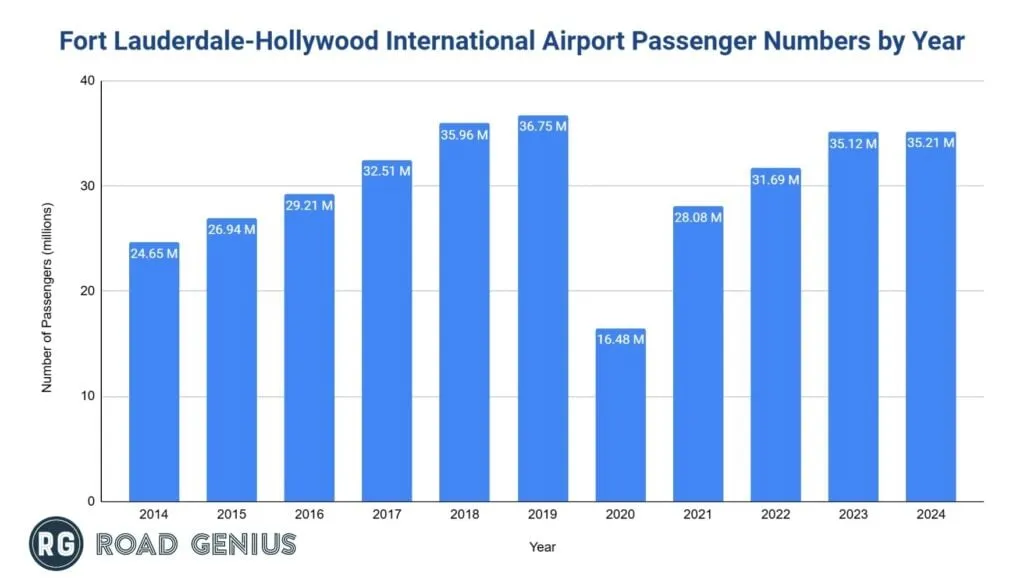
Over 35 million passengers pass through Fort Lauderdale-Hollywood International Airport (FLL) each year.
- In 2024, FLL handled 35.21 million passengers, which was up approximately 0.3% from 2023 but still 4% below pre-pandemic 2019 levels.
- Annual passenger traffic reached 35.12 million in 2023, continuing the recovery from pandemic lows, with 31.69 million in 2022 and 28.08 million in 2021.
- Before the pandemic, 36.75 million passengers traveled through FLL in 2019, dropping to 16.48 million in 2020 during the pandemic low.
Fort Lauderdale-Hollywood International Airport 2025 Statistics
Fort Lauderdale-Hollywood International Airport has welcomed 28.90 million passengers through November 2025, showing approximately 6.3% growth versus the same timeframe in 2024.
Monthly Passenger Traffic at Fort Lauderdale-Hollywood International Airport in 2025
| Month | Total Passengers |
|---|---|
| Jan | 3,010,757 |
| Feb | 2,719,150 |
| Mar | 3,218,177 |
| Apr | 2,816,724 |
| May | 2,524,616 |
| Jun | 2,468,170 |
| Jul | 2,643,655 |
| Aug | 2,522,337 |
| Sep | 1,984,915 |
| Oct | 2,366,658 |
| Nov | 2,628,783 |
| Dec | Not Available |
FLL passenger traffic in 2024
- Approximately 35.21 million travelers used Fort Lauderdale-Hollywood International Airport in 2024, split into 27.89 million domestic passengers (79%) and 7.32 million international passengers (21%).
How large is Fort Lauderdale-Hollywood International Airport?
Fort Lauderdale-Hollywood International Airport spans approximately 1,400 acres of land in Broward County, Florida.
- Runways: 2 parallel runways supporting all-weather operations
- North Runway (10L-28R): 9,000 feet x 150 feet
- South Runway (10R-28L): 8,000 feet x 150 feet
- Terminals: 4 (Terminals 1-4) with 66 gates
- Parking: Garages at every terminal with cameras guidance system, curbside valet at Terminals 1 and 3, and 47-space cell phone waiting area
What is the number of aircraft operations at Fort Lauderdale-Hollywood International Airport each year?
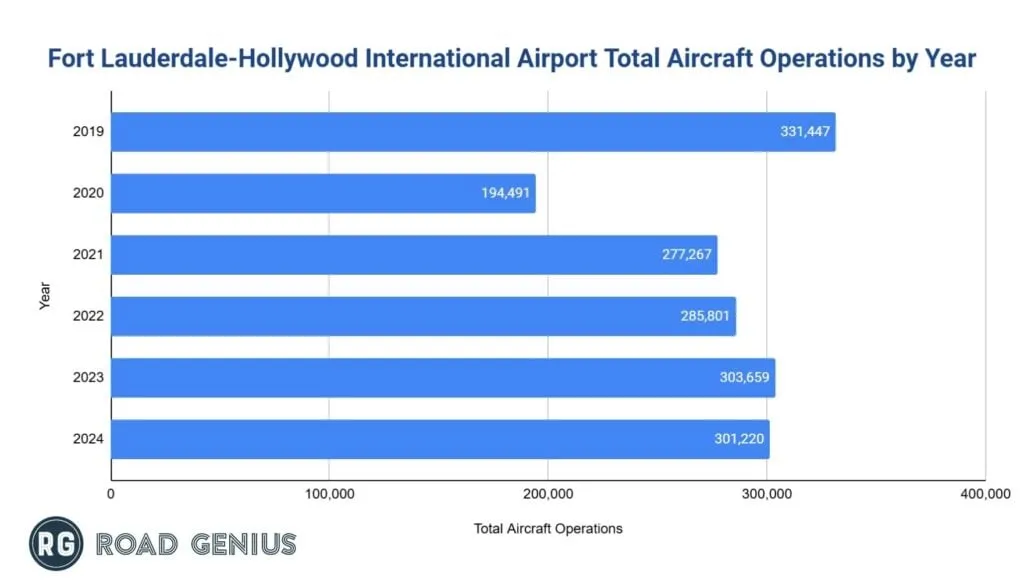
Over 300,000 aircraft operations (including takeoffs and landings) occur at Fort Lauderdale-Hollywood International Airport (FLL) each year.
- In 2024, FLL handled 301,220 operations, down approximately 0.8% from 2023 and 91% of the pre-pandemic 2019 levels.
- Annual aircraft operations reached 303,659 in 2023, continuing the recovery from pandemic lows, with 285,801 operations in 2022 and 277,267 in 2021.
- Before the pandemic, 331,447 operations occurred at FLL in 2019, which dropped to 194,491 in 2020 during the pandemic low.
Aircraft Operations by Type
- Air Carrier and Air Taxi flights dominated with 250,660 operations in 2024, representing 83% of total activity.
- General Aviation and Military flights combined for 50,560 operations (17%), rounding out the airport's total activity.
Fort Lauderdale-Hollywood International Airport Aircraft Operations Type
| Year | Air Transport/Air Taxi | General Aviation/Military | Total |
|---|---|---|---|
| 2014 | 222,318 | 36,026 | 258,254 |
| 2015 | 239,940 | 38,062 | 278,002 |
| 2016 | 253,081 | 37,158 | 290,239 |
| 2017 | 274,109 | 38,654 | 312,763 |
| 2018 | 296,670 | 36,795 | 333,465 |
| 2019 | 300,322 | 31,125 | 331,447 |
| 2020 | 171,719 | 22,772 | 194,491 |
| 2021 | 242,560 | 34,707 | 277,267 |
| 2022 | 249,172 | 36,629 | 285,801 |
| 2023 | 269,039 | 34,620 | 303,659 |
| 2024 | 250,660 | 50,560 | 301,220 |
How much revenue does Fort Lauderdale-Hollywood International Airport generate each year?
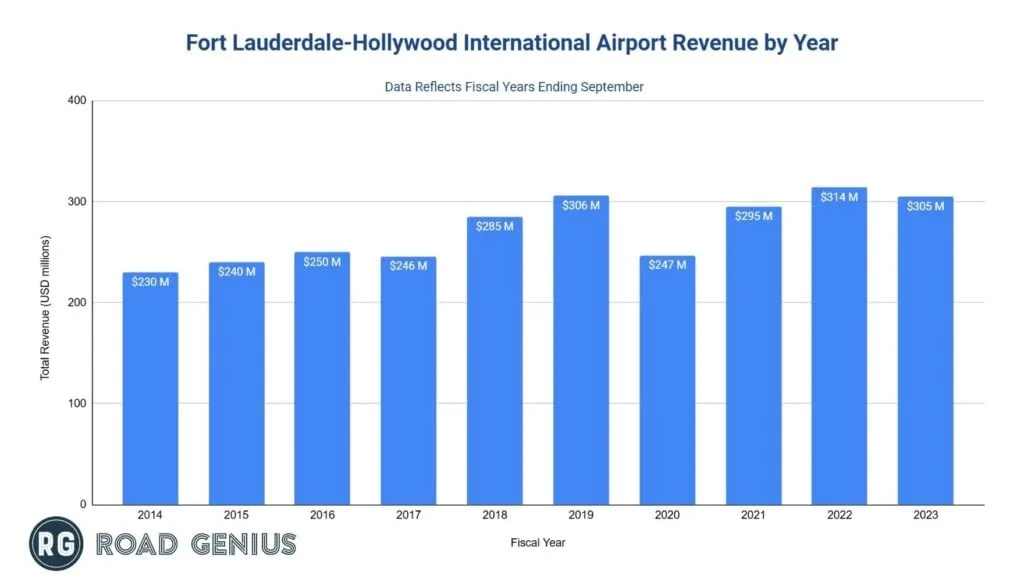
Fort Lauderdale-Hollywood International Airport (FLL) has generated over $340 million in revenue in recent years.
- In fiscal year 2024 (year ending September), FLL generated $341 million in revenue, up approximately 12% from 2023 and 16% above pre-pandemic levels.
- Annual revenue reached $305 million in fiscal year 2023, down approximately 3% from 2022, with $314 million in fiscal year 2022.
- FLL generated revenue of $343 million in fiscal year 2020, which dropped to $295 million in fiscal year 2021 during the pandemic.
FLL International Airport Revenue in 2024
- Approximately $341 million in revenue was generated by Fort Lauderdale-Hollywood International Airport (FLL) in fiscal year 2024 (year ending September).
FLL International Airport Revenue in 2023
- Fort Lauderdale-Hollywood International Airport (FLL) generated approximately $305 million in revenue in fiscal year 2023 (year ending September).
Which concourse at Fort Lauderdale-Hollywood International Airport is busiest?
- Terminal 4, Concourse G was the busiest concourse with 509,983 enplaned passengers, handling 31.7% of total traffic at FLL.
Enplaned Passengers by Concourse at Fort Lauderdale-Hollywood International Airport
- T4-G: 509,983 passengers (31.7%)
- T3-F: 328,099 passengers (20.4%)
- T2-D: 228,410 passengers (14.2%)
- T1-C: 223,919 passengers (13.9%)
- T1-A/B: 192,321 passengers (11.9%)
- T3-E: 127,116 passengers (7.9%)
Which airlines carry the most passengers at Fort Lauderdale-Hollywood International Airport?
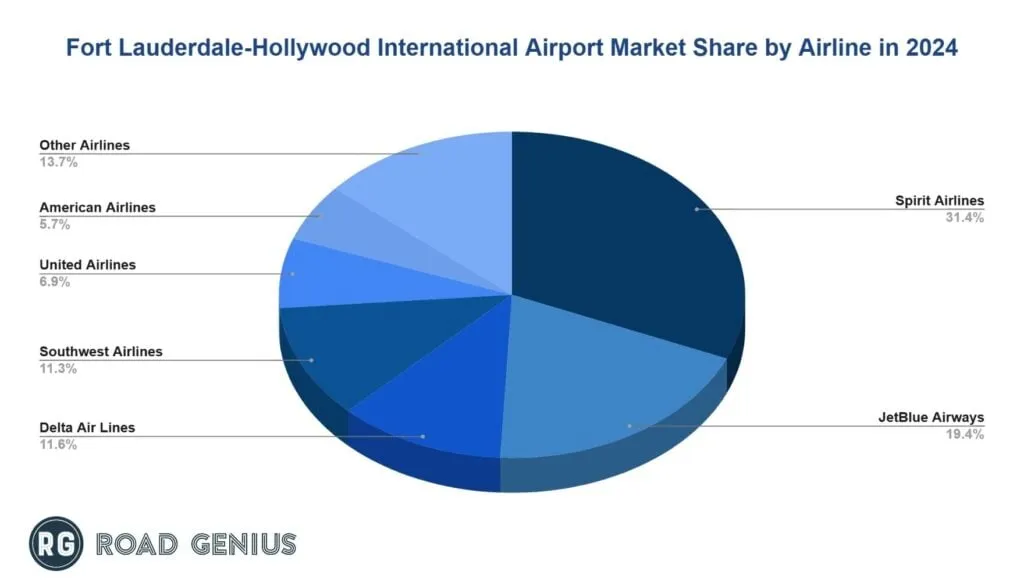
Spirit Airlines carried the most passengers with a 31.4% market share in 2024 at FLL.
Market Share by Airline at FLL (2024)
- Spirit Airlines: 31.4% (11.06 million passengers)
- JetBlue Airways: 19.4% (6.85 million passengers)
- Delta Air Lines: 11.6% (4.09 million passengers)
- Southwest Airlines: 11.3% (3.98 million passengers)
- United Airlines: 6.9% (2.43 million passengers)
- American Airlines: 5.7% (2.00 million passengers)
- Allegiant Air: 2.8% (973,000 passengers)
- Other carriers: 10.9% (3.83 million passengers)
What are the busiest routes at Fort Lauderdale-Hollywood International Airport?
The busiest domestic and international routes at FLL reflect both the low-cost carrier strategy and South Florida's strong connections to Latin America and the Caribbean.
Top Domestic Routes by Passengers (2024)
- FLL - Atlanta (ATL): 1.26 million passengers
- FLL - Newark (EWR): 783,660 passengers
- FLL - New York LaGuardia (LGA): 727,550 passengers
- FLL - New York John F. Kennedy (JFK): 577,630 passengers
- FLL - Charlotte (CLT): 558,440 passengers
- FLL - Chicago O'Hare (ORD): 495,280 passengers
- FLL - Baltimore (BWI): 488,860 passengers
- FLL - Dallas/Fort Worth (DFW): 481,440 passengers
- FLL - Boston (BOS): 469,560 passengers
- FLL - Detroit (DTW): 413,760 passengers
Top International Routes by Passengers (2024)
- FLL - Cancún (CUN): 444,000 passengers
- FLL - Toronto (YYZ): 415,000 passengers
- FLL - Montreal (YUL): 350,000 passengers
- FLL - Nassau (NAS): 320,000 passengers
- FLL - Kingston (KIN): 300,000 passengers
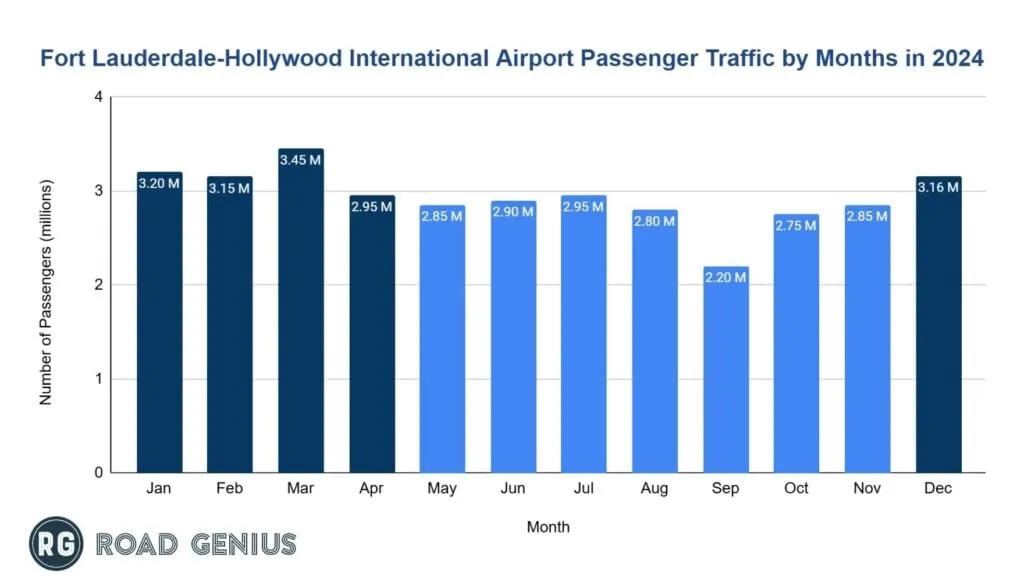
Monthly trends in passenger traffic at FLL
March was the peak month at Fort Lauderdale-Hollywood International Airport (FLL) in 2024.
- March was the busiest month with approximately 3.64 million passengers, followed by December with 3.31 million and January with 3.17 million.
How much cargo moves through Fort Lauderdale-Hollywood International Airport each year?
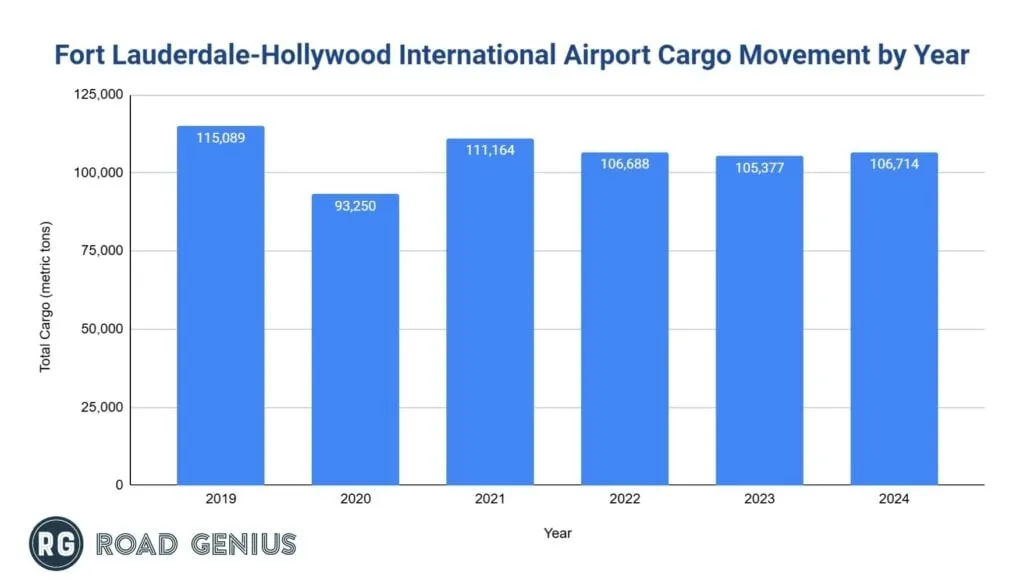
Fort Lauderdale-Hollywood International Airport (FLL) handles approximately 106,700 U.S. tons of cargo in recent years.
- In 2024, FLL processed 106,714 U.S. tons of cargo, up approximately 1.3% from 2023 and 7% below pre-pandemic 2019 levels.
- Annual cargo volumes reached 105,377 U.S. tons in 2023, remaining relatively stable, with 106,688 U.S. tons in 2022 and 111,164 U.S. tons in 2021.
- Before the pandemic, 115,089 U.S. tons of cargo moved through FLL in 2019, which dropped to 93,250 U.S. tons in 2020 during the pandemic low.
How reliable is Fort Lauderdale-Hollywood International Airport?
Fort Lauderdale-Hollywood International Airport (FLL) achieved a 74% on-time arrival and 71% on-time departure rate in 2024, ranking as the 2nd worst among major U.S. airports for on-time performance.
- Cancellations (2024): 1.63% of scheduled flights
- Average delay in 2024 (for delayed flights): Departure 69.52 minutes, arrival 72.46 minutes
- Peak delays: Afternoon and evening hours due to thunderstorms and runway constraints
How does Fort Lauderdale-Hollywood International Airport rank globally?
Fort Lauderdale-Hollywood International Airport (FLL) ranks as the 18th busiest airport in the United States and approximately the 63rd busiest globally by passenger traffic in 2024.
- Cargo rank (North America): near 50th
- Role: Major U.S. gateway to the Caribbean and Latin America
- Appleton International Airport Statistics
- Birmingham Airport (BHM) Statistics
- Buffalo Airport (BUF) Statistics
- Charlotte Douglas Airport Statistics
- Columbia Metropolitan Airport Statistics
- Dallas Fort Worth Airport Statistics
- Daytona Beach International Airport Statistics
- Flagstaff Pulliam Airport Statistics
- Grand Rapids Airport (GRR) Statistics
- Oakland Airport (OAK) Statistics
- OKC Will Rogers Airport Statistics
- Palm Beach Airport (PBI) Statistics
What is Fort Lauderdale-Hollywood International Airport's economic impact?
FLL supports more than $37.5 billion in annual economic activity across South Florida.
- The airport underpins 255,386 jobs region-wide, including nearly 18,000 positions on or adjacent to the airport, and drives Broward County’s tourism economy by facilitating cruise and leisure travel.
References
- FLL Official Statistics and Press Releases · broward.org
- BTS TranStats — Airport profiles (route information by airport) · transtats.bts.gov

