

 Popular Countries
 24/7 Support
Published Sep 9, 2026
Cleveland Hopkins International Airport (CLE) is Ohio’s busiest airport and the primary air gateway for Greater Cleveland. It connects the region to destinations across the U.S. and select international locations through a range of partner airlines.
How many passengers pass through Cleveland Hopkins International Airport each year?
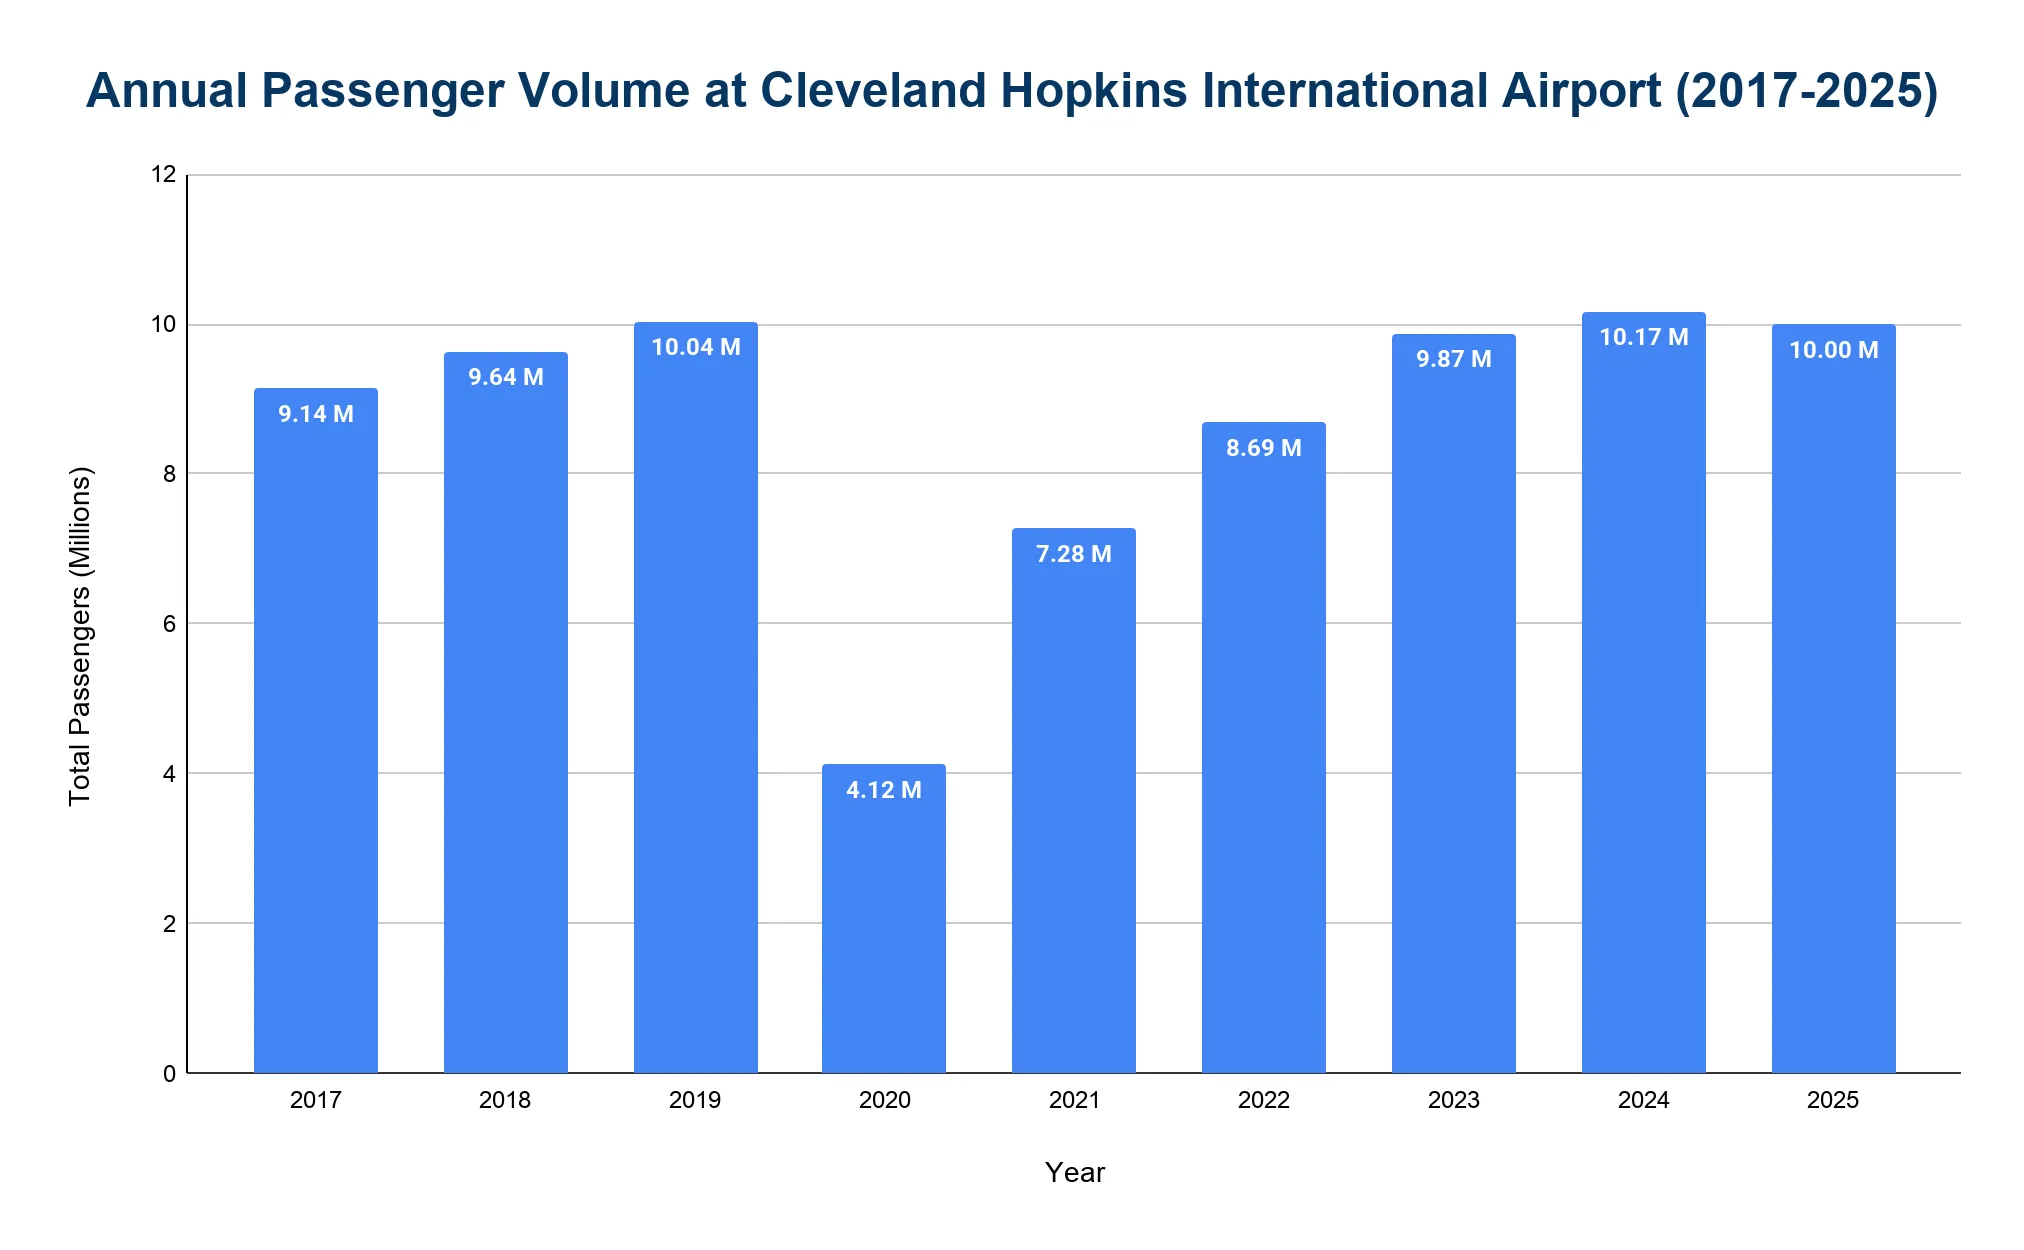
Cleveland Hopkins International Airport handles more than 10 million passengers annually.
- CLE recorded 10 million passengers in 2025, representing a 1.7% decrease from the previous year.
- In 2019, CLE handled 10.04 million passengers before pandemic-related disruptions.
- Passenger traffic dropped to 4.12 million in 2020, a 59% decline.
- Traffic recovered to 7.28 million in 2021, 8.69 million in 2022 and 9.87 million in 2023.
- It set a new record in 2024 with 10.17 million passengers, a 3% increase from 2023.
What is the total number of aircraft operations at Cleveland Hopkins International Airport each year?
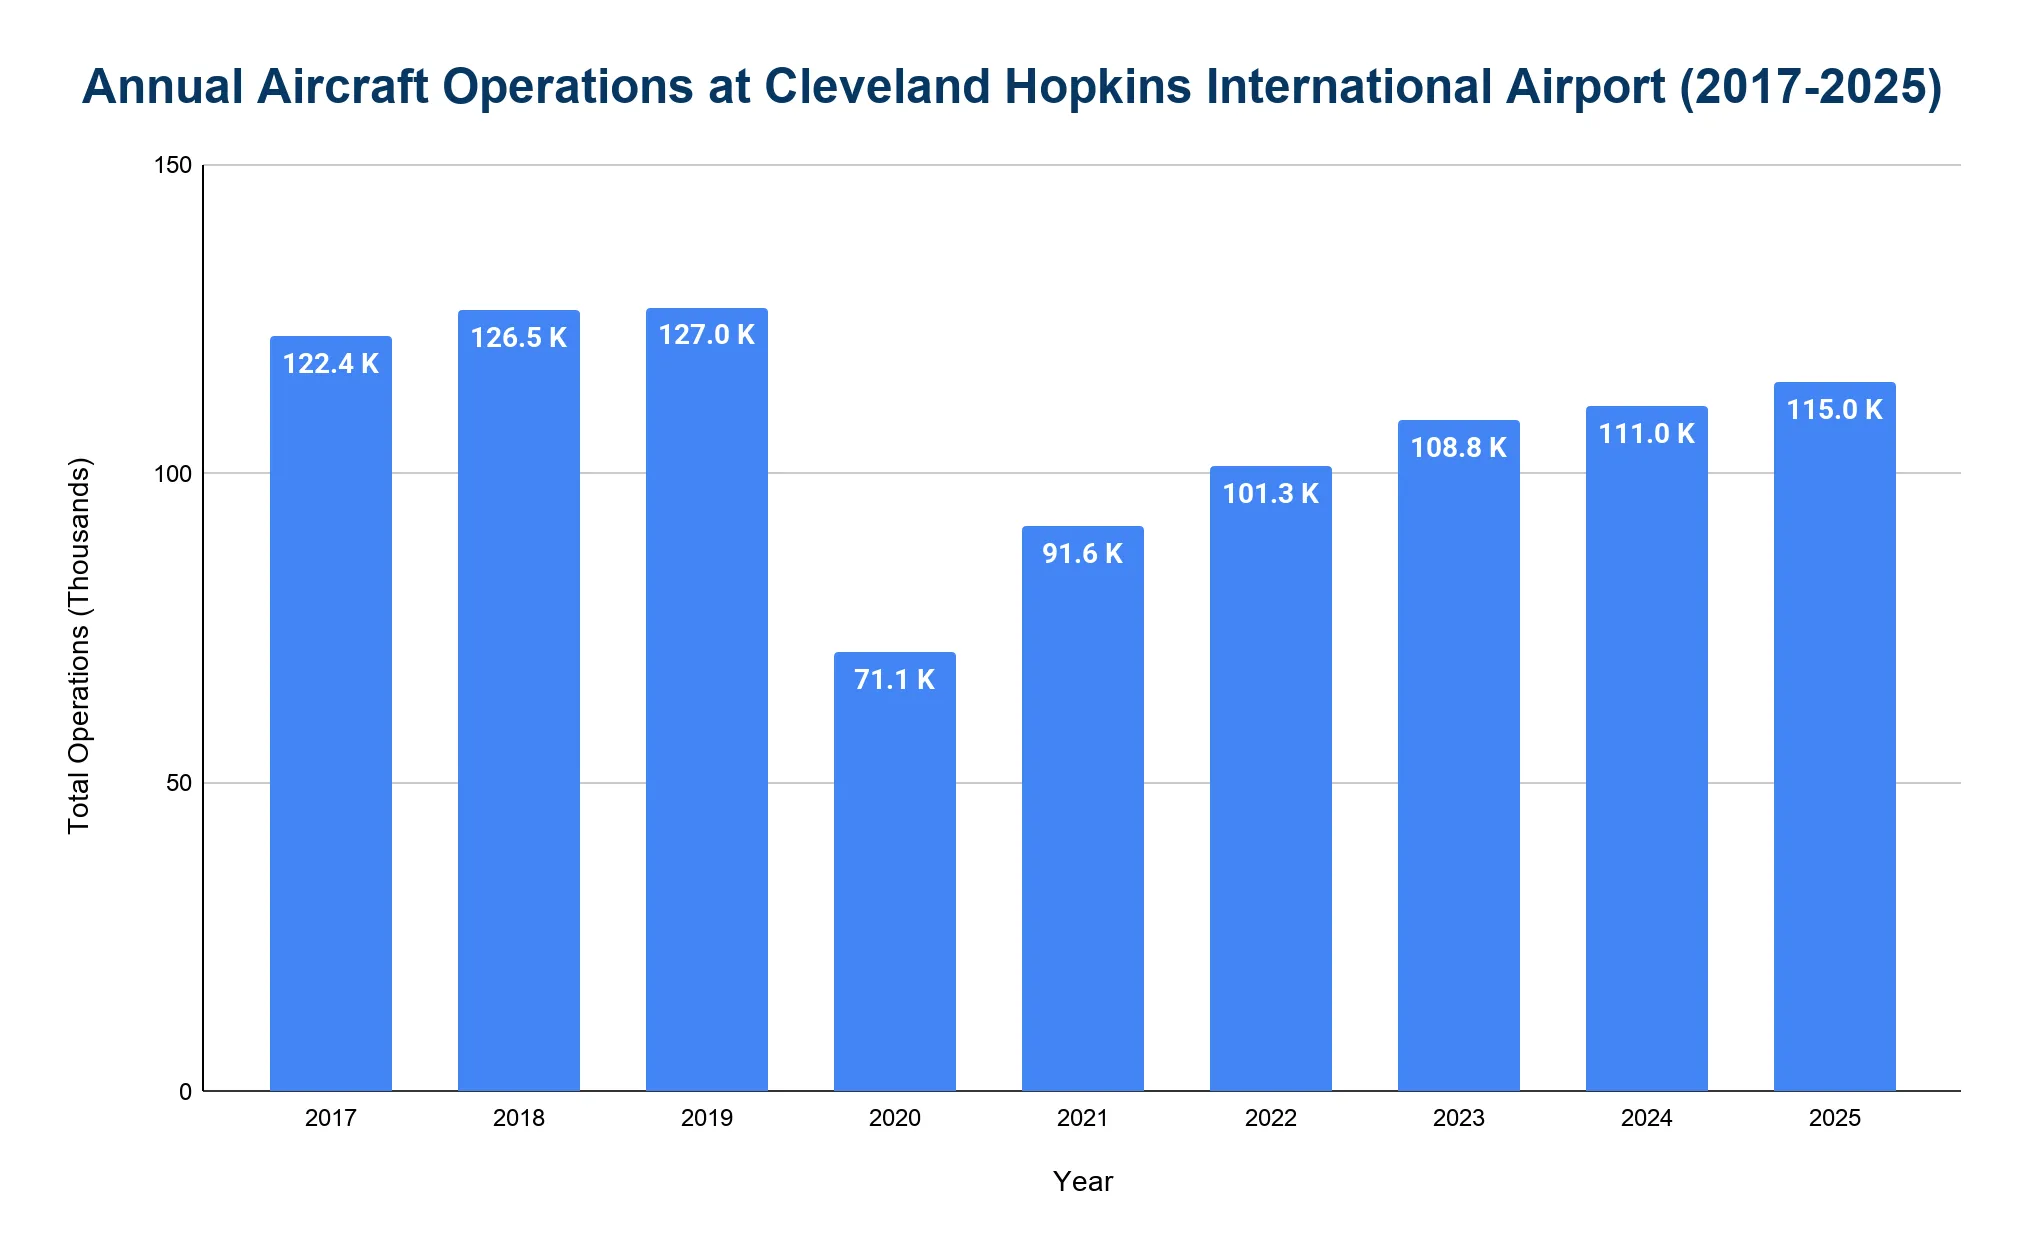
Cleveland Hopkins International Airport sees over 110,000 takeoffs and landings each year.
- CLE recorded 114,969 aircraft operations in 2025, a 3.6% increase from 110,961 operations in 2024.
- Pre-pandemic, the airport saw 126,999 movements in 2019 and 126,478 in 2018.
- Operations fell to 71,141 in 2020, a 44% drop.
- Activity rebounded with 91,605 in 2021, 101,314 in 2022 and 108,788 in 2023.
Which airlines operate the most flights out of Cleveland Hopkins International Airport?
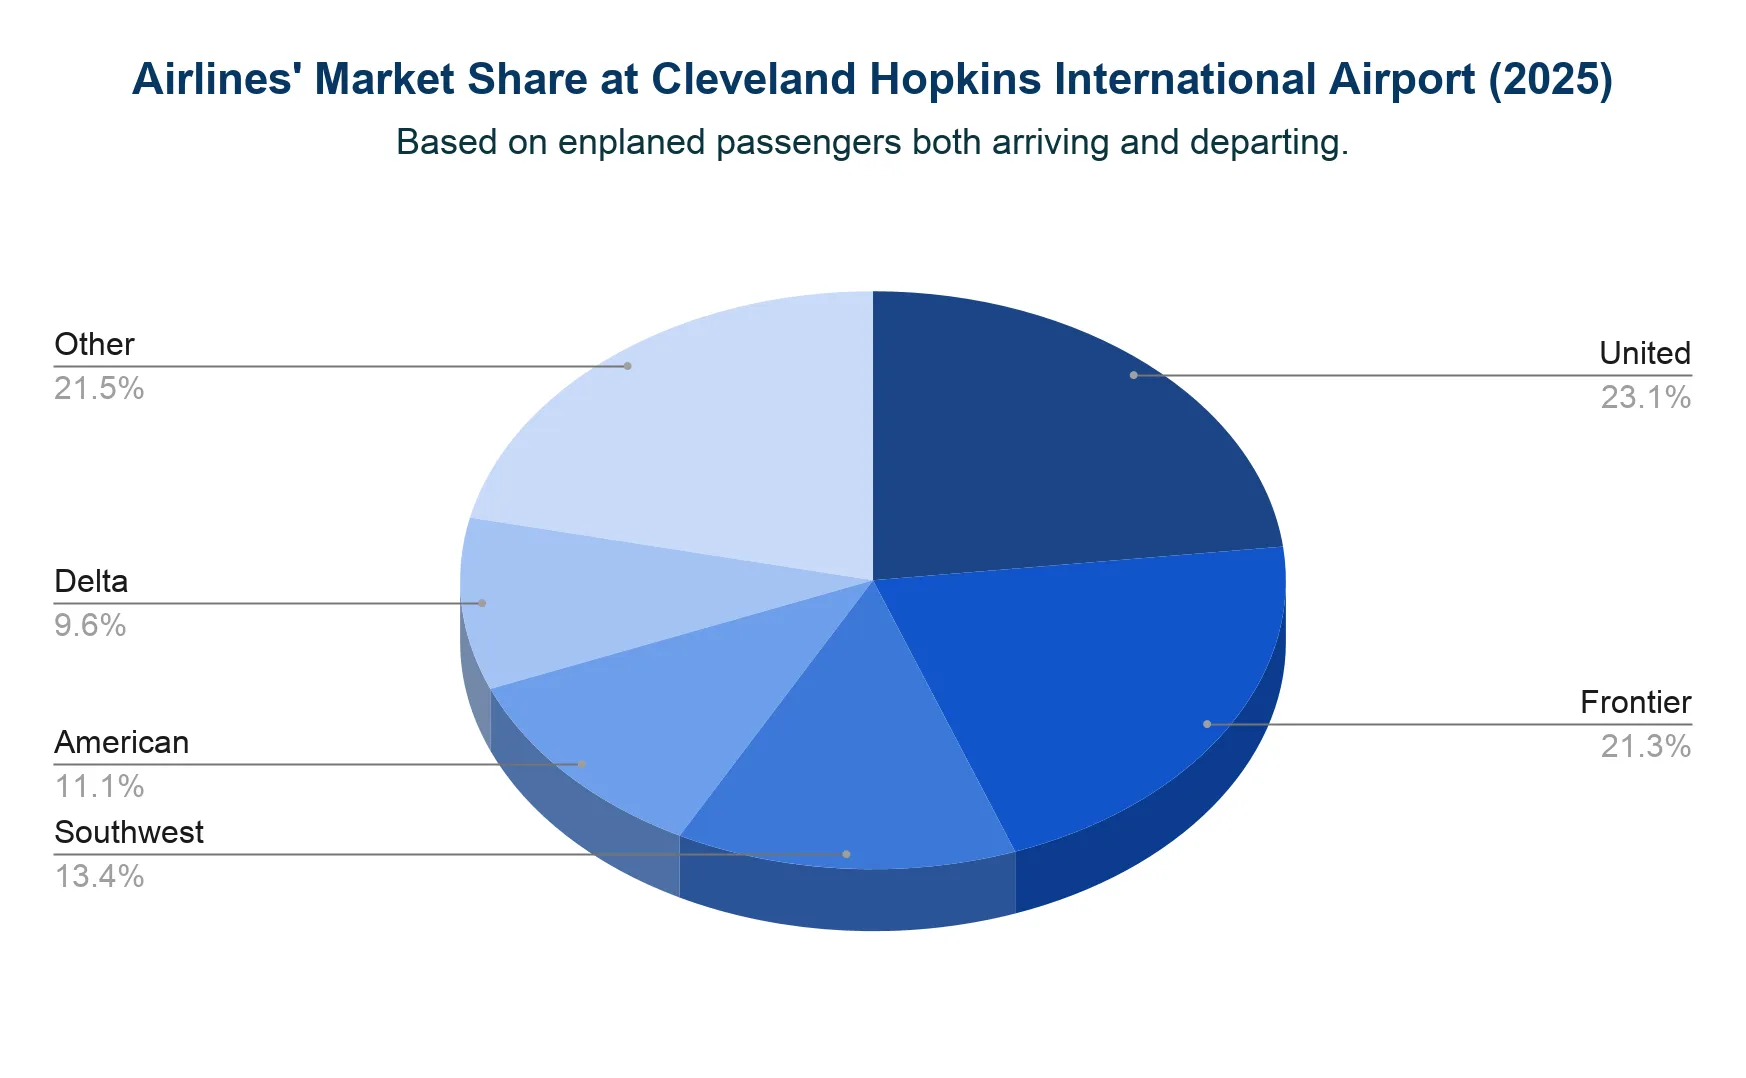
Legacy and low-cost carriers both operate at CLE. United Airlines holds the largest market share by a narrow margin.
- In 2025, United Airlines led with 23.1% of passenger volume.
- Frontier Airlines followed with 21.3%.
- Southwest Airlines held 13.4% and American Airlines accounted for 11.1%.
- Delta Air Lines represented 9.6%.
What are the monthly trends in passenger traffic at Cleveland Hopkins International Airport?
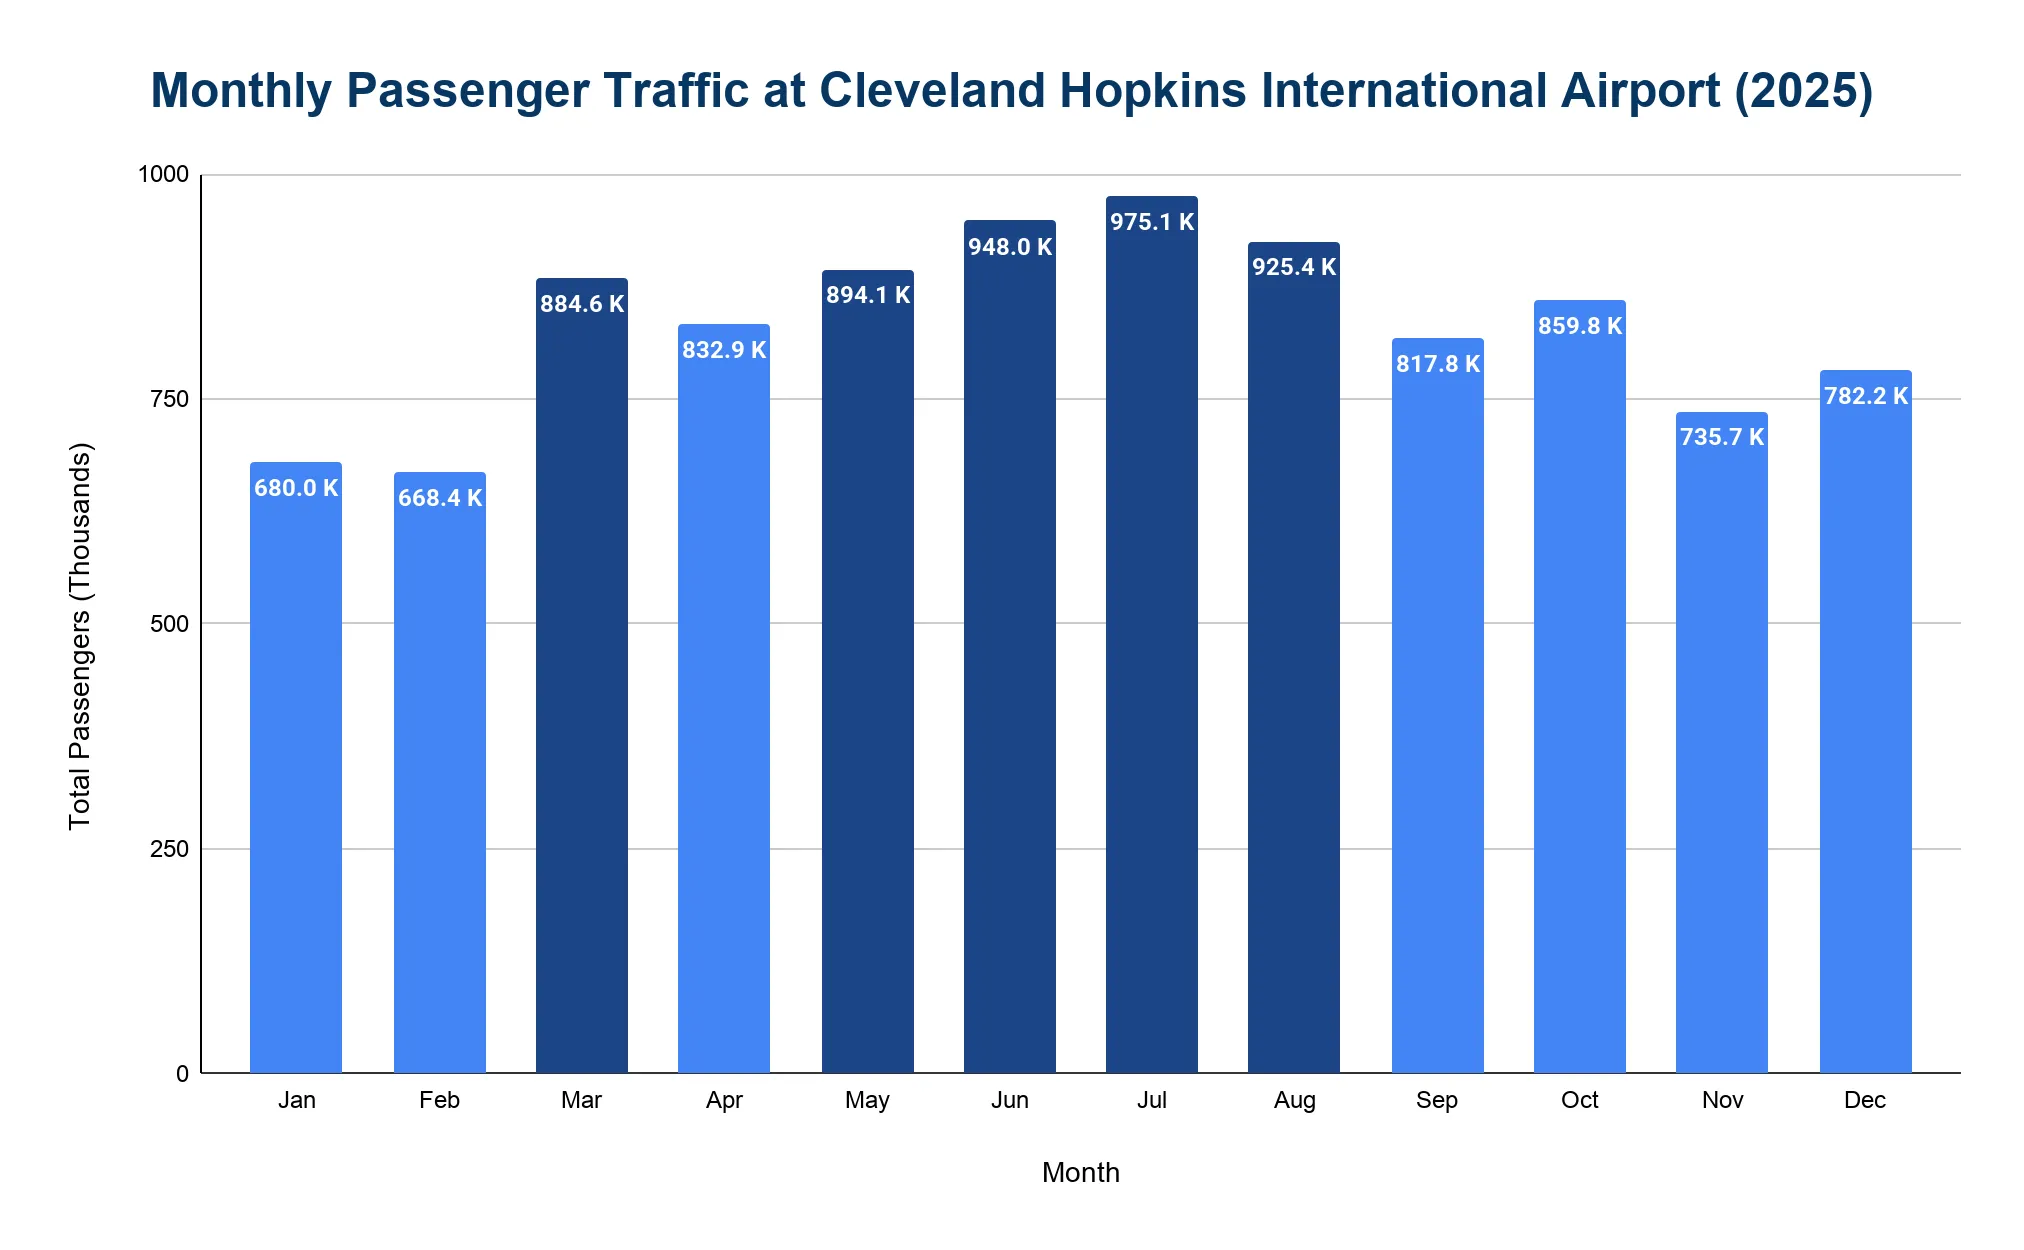
CLE shows distinct seasonal trends, with higher volumes in summer and around major holidays.
- July was the busiest month in 2025 with 975,137 passengers.
- June saw 947,962 passengers, reflecting the start of the summer travel surge.
- August recorded 925,425 passengers, remaining a high-volume month after the July peak.
- May handled 894,115 passengers, marking the early seasonal rise.
- February was the slowest with 668,388 passengers, followed by January with 679,958 passengers.
How many routes are there at Cleveland Hopkins International Airport?
As of 2025, Cleveland Hopkins International Airport (CLE) serves approximately 43 nonstop destinations across the United States, Canada, Mexico, the Caribbean, and Europe.
- Key international service includes Aer Lingus’ nonstop route to Dublin, Ireland, which expanded in 2025 from four to up to six weekly roundtrip flights during the summer travel season due to strong passenger demand.
- Dublin remains CLE’s only direct European destination.
- The airport’s route network provides extensive connectivity to major U.S. hubs including Atlanta, Chicago, Denver, Dallas/Fort Worth, Charlotte, Newark, and Washington, D.C., while also offering popular vacation routes to destinations such as Orlando, Fort Lauderdale, Cancún, Punta Cana, Las Vegas, and Myrtle Beach.
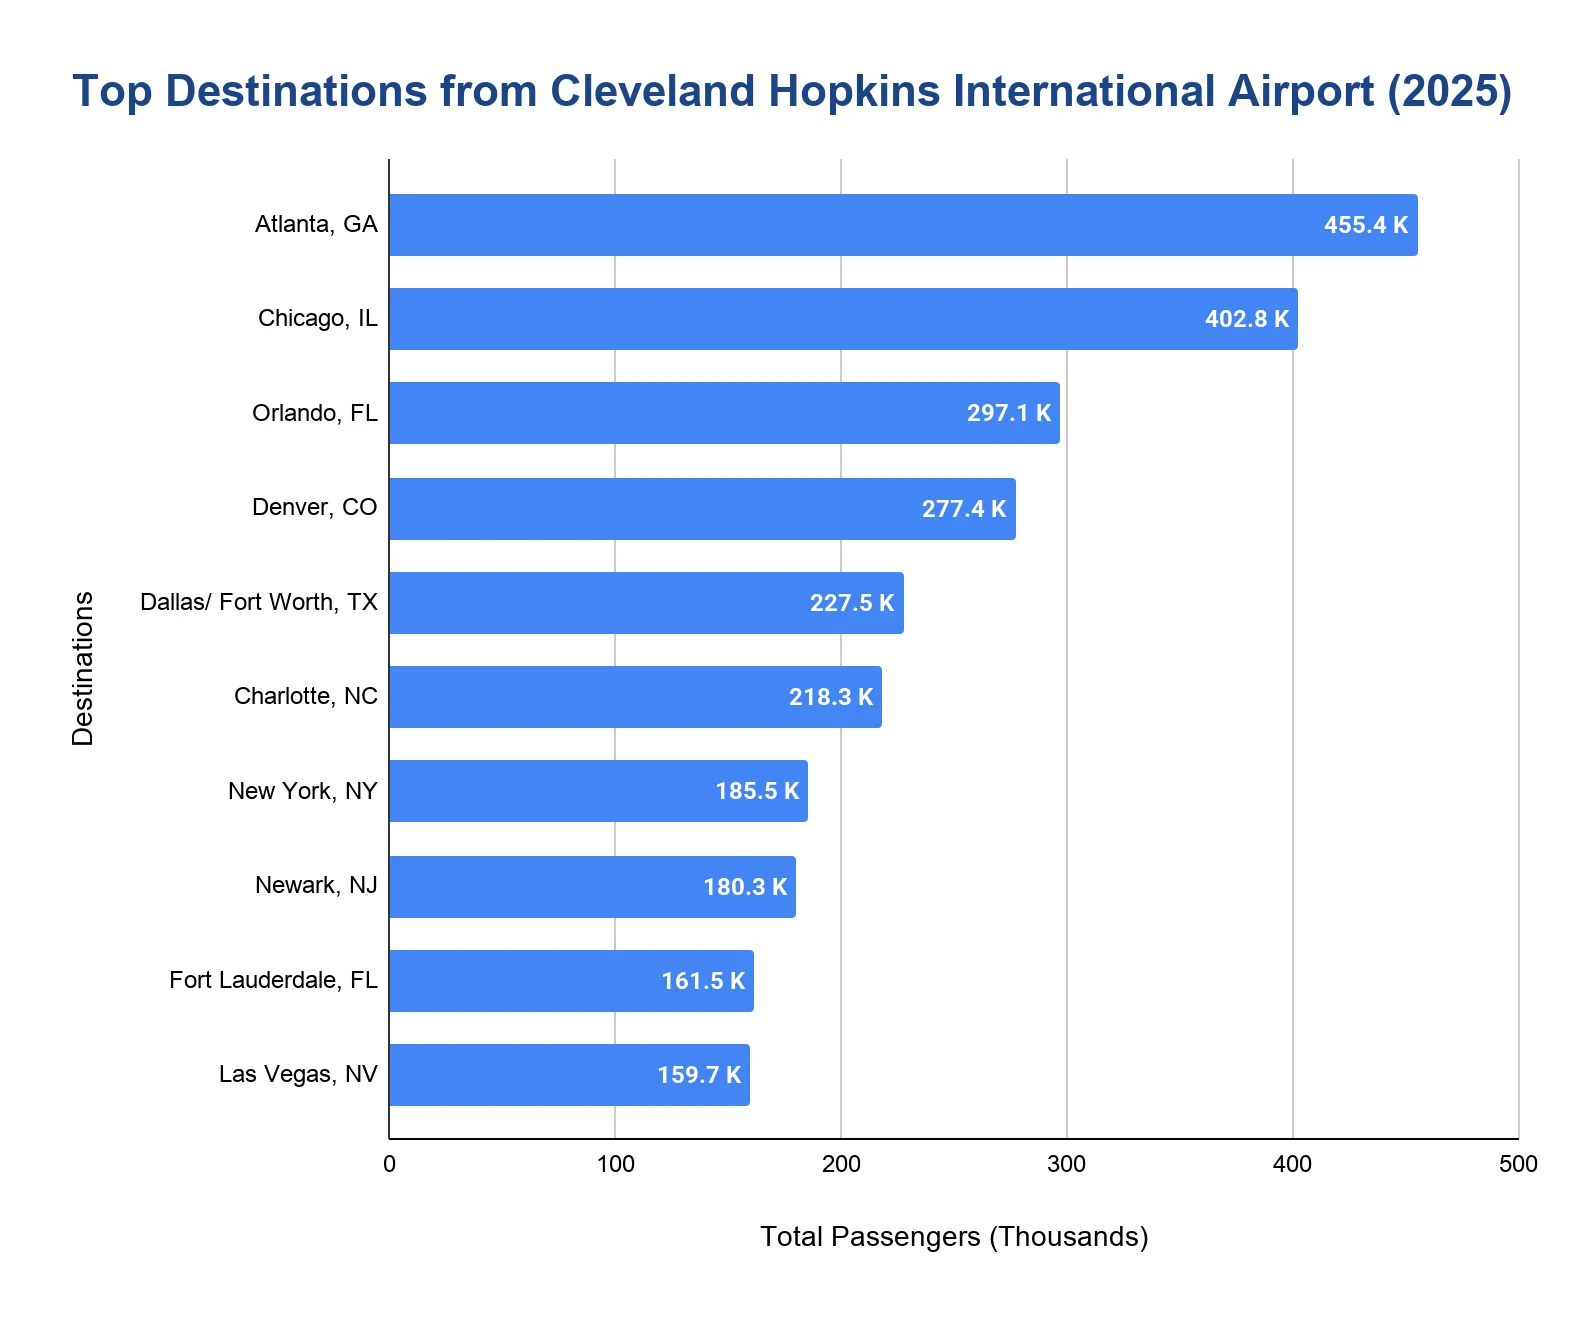
Which destinations are the most popular from Cleveland Hopkins International Airport?
- Atlanta, GA (ATL) carried 455,360 passengers in 2025, making it the busiest route.
- Chicago O'Hare, IL (ORD) served 402,780 passengers, maintaining its position as the second-busiest route.
- Orlando, FL (MCO) handled 297,080 passengers, providing essential connectivity to Florida leisure markets.
- Denver, CO (DEN) served 277,350 passengers and Dallas/Fort Worth, TX (DFW) handled 227,490 passengers, completing the top 5 domestic destinations.
How much cargo does Cleveland Hopkins International Airport handle annually?
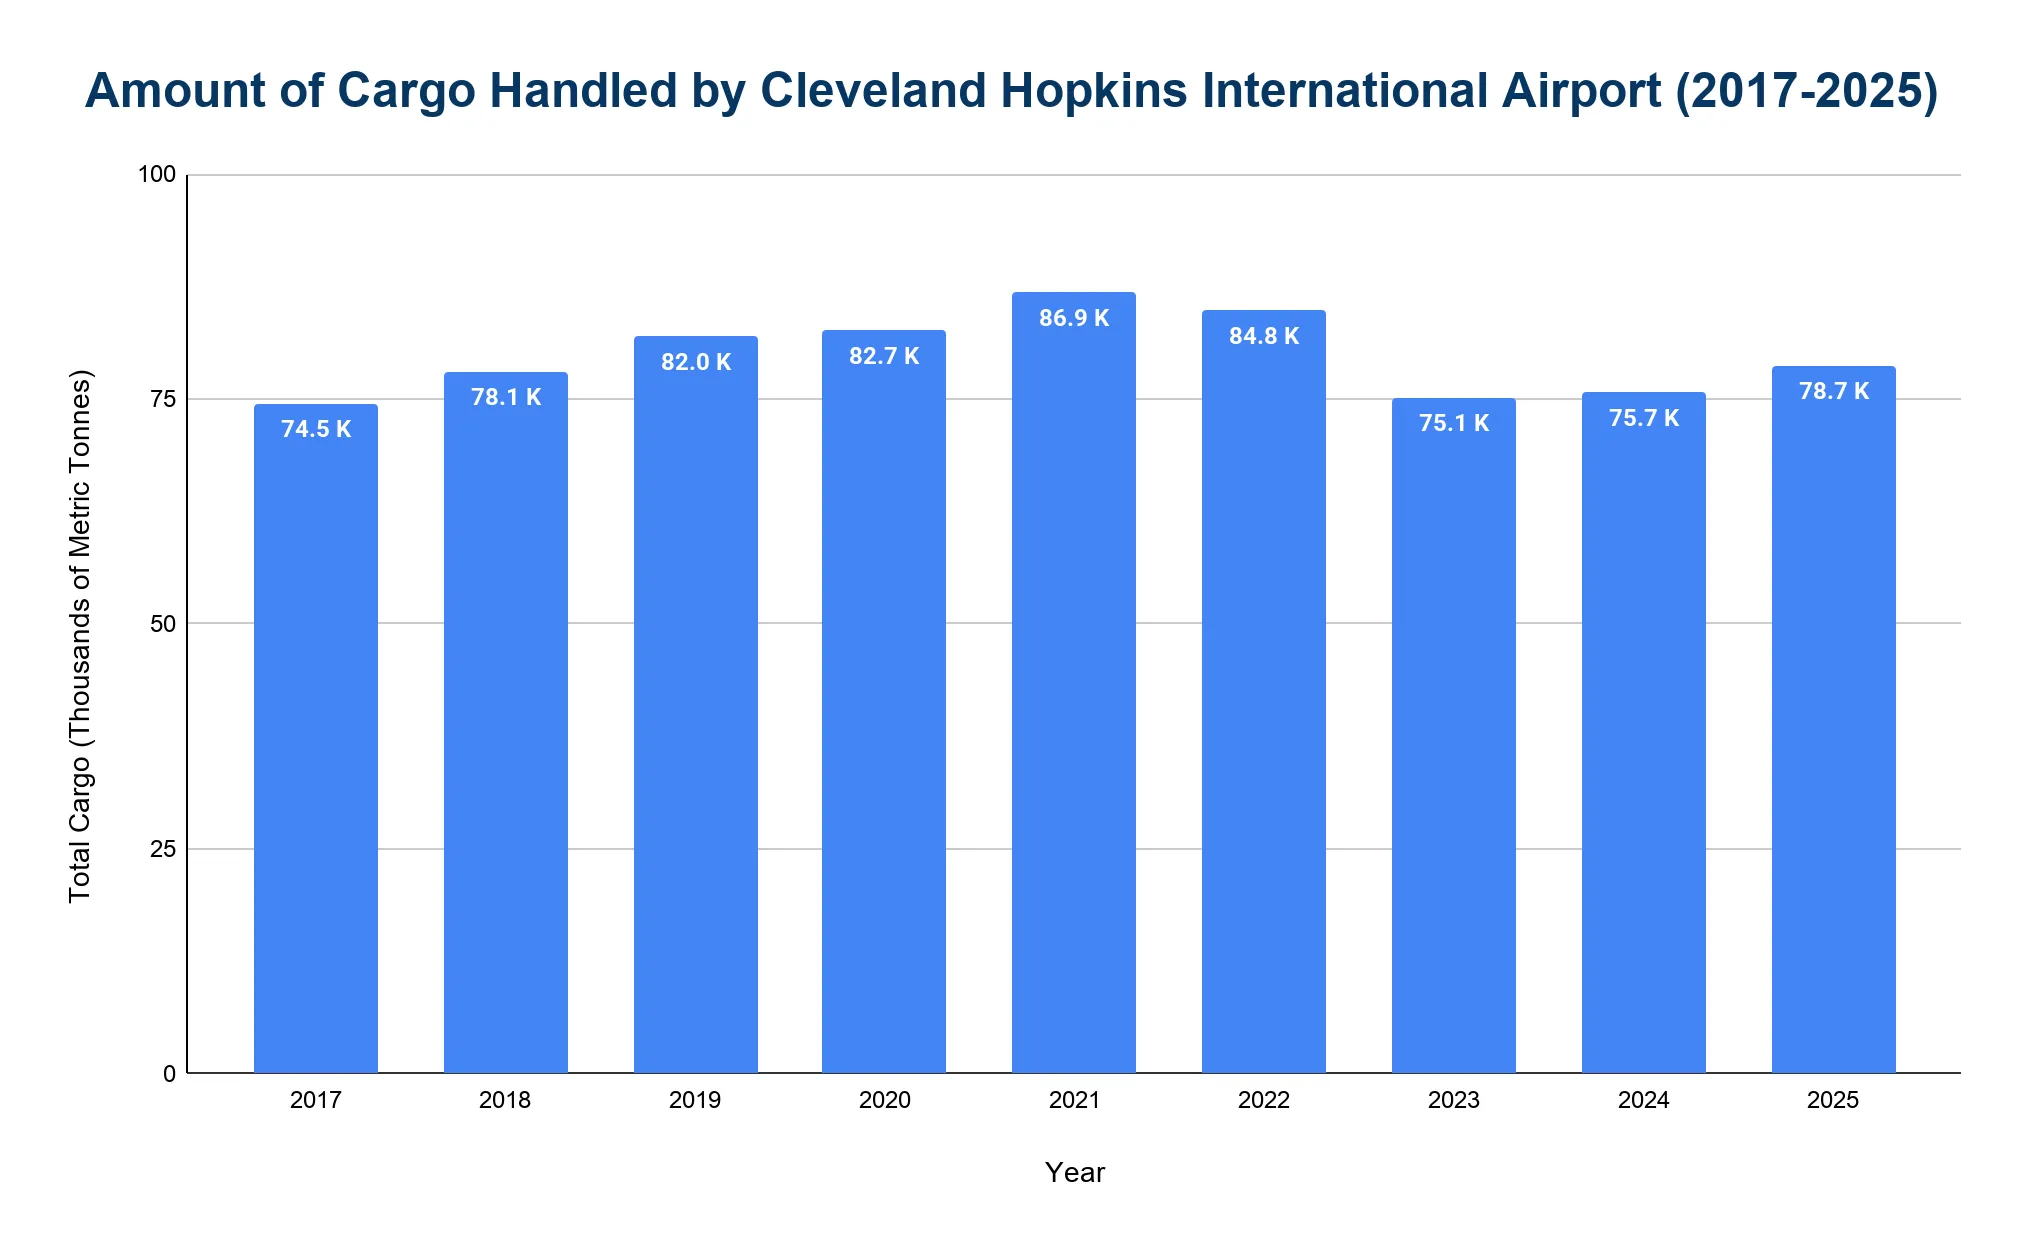
CLE is Ohio’s leading cargo airport, handling over 70,000 metric tonnes of freight each year.
- Cleveland Hopkins International Airport handled 78,713 metric tonnes of cargo in 2025, showing continued recovery compared with 75,735 metric tonnes in 2024.
- Before the pandemic, the airport processed around 82,000 metric tonnes of cargo in 2019, serving as a key benchmark for freight activity.
- During the pandemic period, cargo volumes remained resilient, with 82,670 metric tonnes handled in 2020 and rising further to 86,904 metric tonnes in 2021.
- In the recovery and stabilization phase, cargo throughput reached 84,848 metric tonnes in 2022 before declining to 75,127 metric tonnes in 2023 and slightly improving again in 2024 and 2025.
How many cancellations occur at Cleveland Hopkins International Airport annually?
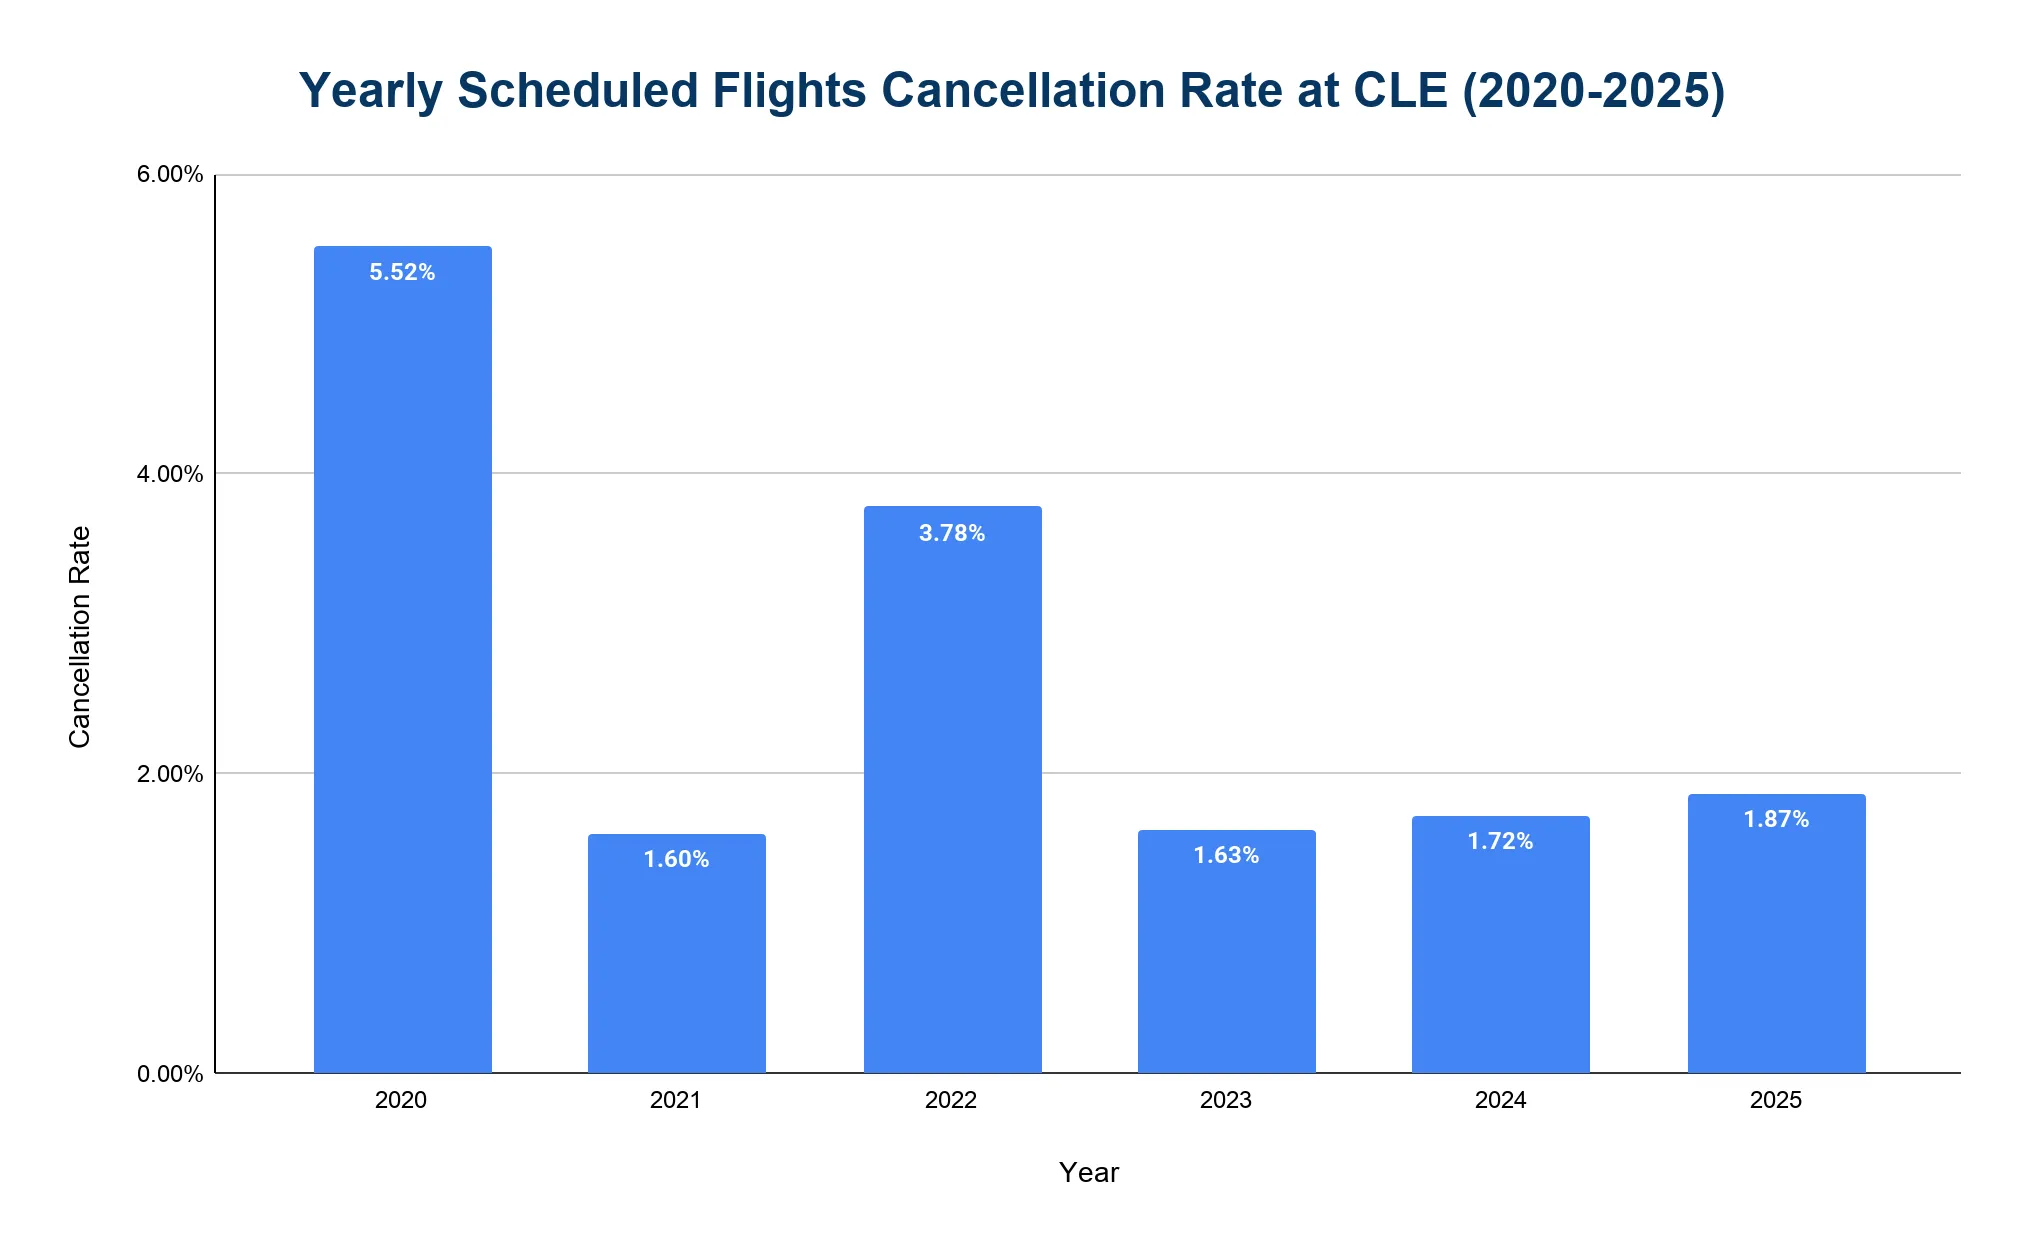
Flight cancellations at CLE are generally low, typically below 2%.
- Approximately 1.87% of domestic flights were cancelled in 2025, a slight increase from 1.72% in 2024.
- The highest rate occurred in 2020, during the pandemic, when 5.52% of flights were cancelled.
- In 2021, the cancellation rate dropped to 1.60%, representing a return to more normal operations.
- The rate increased in 2022 at 3.78%, reflecting industry-wide staffing challenges and operational disruptions.
- In 2023, 1.63% of flights were cancelled, following the national trend of improved reliability.
What are the main causes of flight disruptions at Cleveland Hopkins International Airport?
- Winter weather, including snow and ice that require de-icing (December through March).
- Summer thunderstorms, which can delay flights at CLE and major hub airports.
- Airline operational issues, such as crew shortages and aircraft unavailability.
- Air traffic control delays at major hubs like Chicago, Atlanta and Newark.
- Late-arriving aircraft, responsible for around 46% of delays at CLE.
How much revenue has Cleveland Hopkins International Airport generated each year?
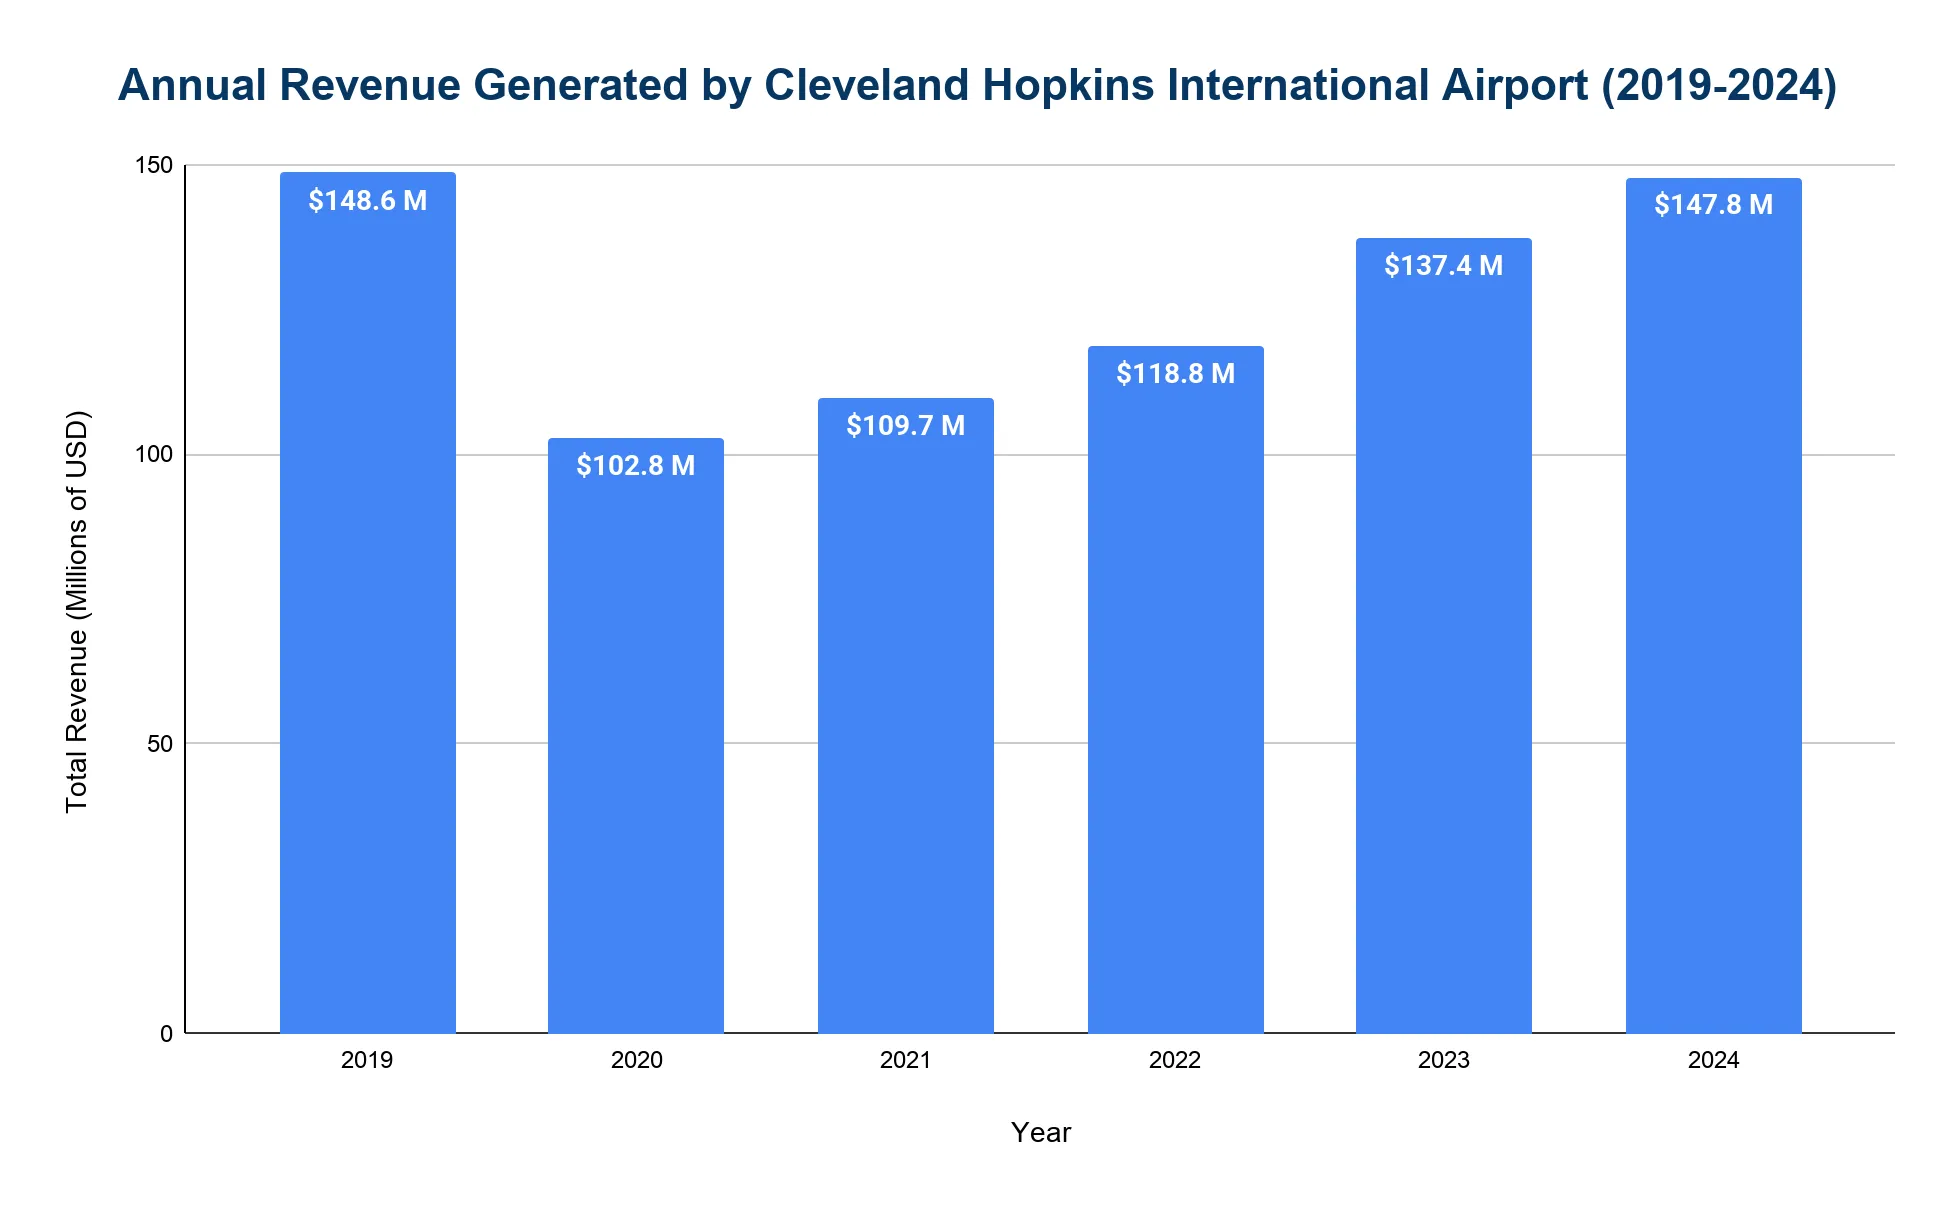
Cleveland Hopkins International Airport generates over $140 million in annual operating revenue.
- In 2024, operating revenue reached $147.8 million, approaching the 2019 record and representing strong post-pandemic recovery.
- Prior to the pandemic, revenue stood at $148.6 million in 2019.
- Revenue dropped to $102.8 million in 2020 amid the passenger collapse.
- The airport rebounded with $109.7 million in 2021 and $118.8 million in 2022.
- In 2023, the airport generated $137.4 million in operating revenue.
Related Travel Statistics
- Buffalo Airport (BUF) Statistics
- Southwest Florida Airport Statistics
- Atlanta Airport (ATL) Statistics
- Missoula Montana Airport (MSO) Statistics
- Myrtle Beach Airport (MYR) Statistics
- Newark Airport (EWR) Statistics
- Oakland Airport (OAK) Statistics
- OKC Will Rogers Airport Statistics
- Orlando Airport (MCO) Statistics
- Peoria Airport (PIA) Statistics
- Pittsburgh Airport (PIT) Statistics
- Richmond International Airport Statistics
What are the notable incidents at Cleveland Hopkins International Airport?
- February 17, 1991: A Ryan International DC-9 cargo plane crashed during takeoff due to wing icing, killing both crew members. This incident led to improved de-icing procedures at CLE.
- December 18, 1978: An Allegheny Commuter aircraft collided with a snowplow while landing in snowy conditions. All 17 on board survived, though the aircraft was destroyed. Runway coordination protocols were updated.
- January 4, 1985: A Pan Am Boeing 727 was hijacked during boarding. The armed individual held hostages for six hours before the FBI intervened. One ticket agent was injured, no fatalities occurred.
- January 6, 2003: A Continental Express ERJ-145 overran a snowy runway. No injuries occurred. The aircraft was repaired, and winter protocols were reviewed.
References
- Cleveland Hopkins International — Facts and Figures · clevelandairport.com
- FAA OPSNET — George Bush Intercontinental Airport Operations Data · aspm.faa.gov
- BTS TranStats — Airport profiles (route information by airport) · transtats.bts.gov
- Cleveland Hopkins International Airport Annual Revenue Data (City of Cleveland Open Data) · data.clevelandohio.gov
- Aviation Safety Network · aviation-safety.net

