

 Popular Countries
 24/7 Support
Published Sep 9, 2026
OKC Will Rogers International Airport (OKC) operates as Oklahoma City’s primary commercial airport. Named after celebrated Oklahoman Will Rogers, the airport is the busiest commercial airport in Oklahoma and functions as a regional gateway for central Oklahoma, recording more than 2 million Federal Aviation Administration (FAA) passenger boardings in 2024.
How many passengers fly through Will Rogers World Airport each year?
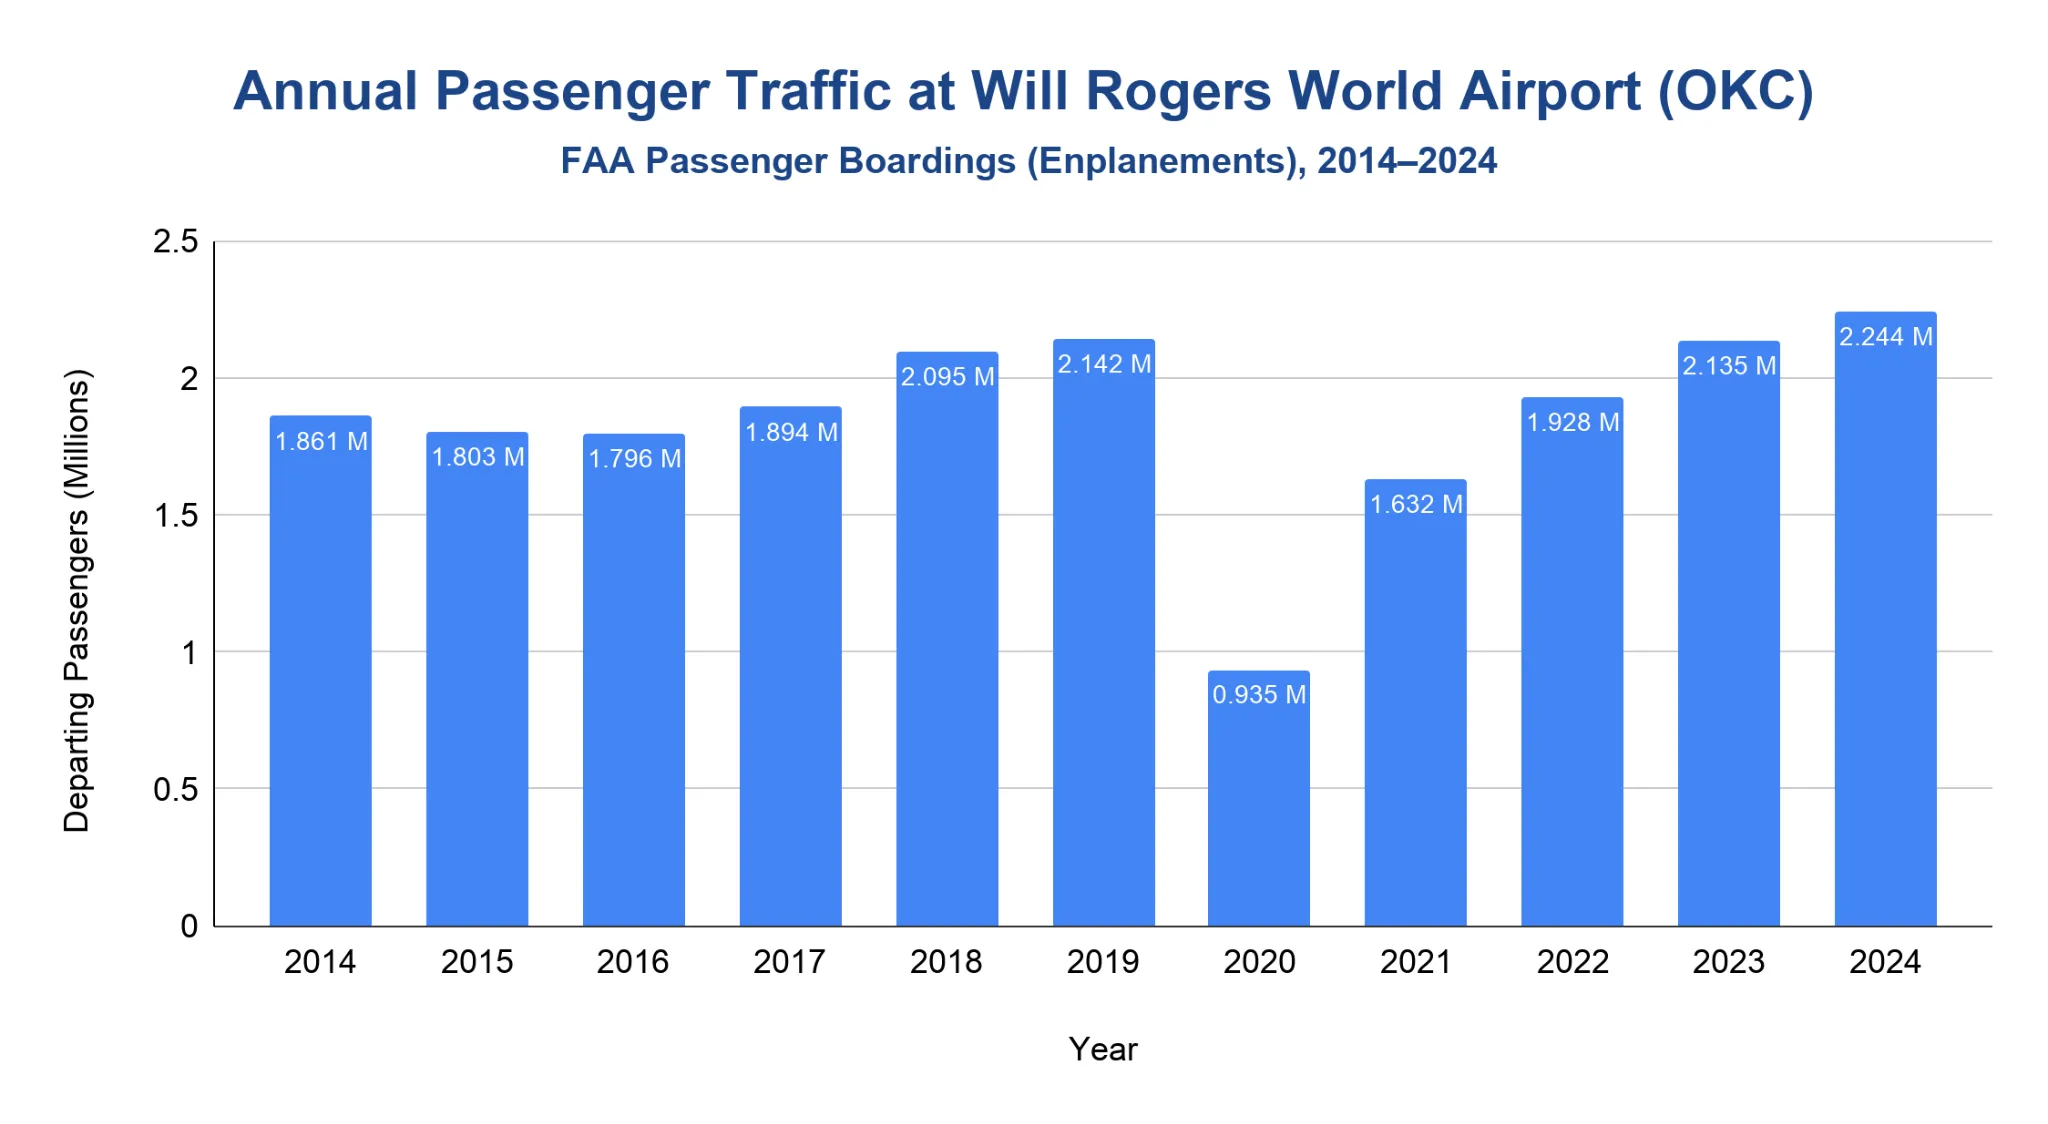
OKC recorded 2.24 million FAA passenger boardings in 2024, the latest final year available.
- From 2014 to 2018, passenger boardings increased from 1.86 million to 2.09 million, showing an overall increase despite minor mid-period declines.
- Pre-pandemic traffic reached 2.14 million boardings in 2019.
- The pandemic caused boardings to fall to 934,842 in 2020, a 56.36% decline from 2019.
- Recovery began in 2021, when boardings rose to 1.63 million.
- Post-pandemic growth continued through 2024, when OKC reached 2.24 million boardings, surpassing its 2019 level by 4.74%.
Note: FAA passenger boardings are enplanements, meaning departing passengers only. They are not the same as total passenger traffic, which includes both departing and arriving passengers.
Does Will Rogers World Airport offer domestic and international flights?
OKC began scheduled international passenger service on 8 November 2025 with American Airlines nonstop flights to Cancún, Mexico.
- Through 2024, OKC’s scheduled commercial passenger service was domestic.
- American Airlines launched weekly nonstop service from OKC to Cancún, Mexico, on 8 November 2025.
- The service operated through 4 April 2026.
- The Federal Inspection Station (FIS) project gave OKC the passenger-processing infrastructure needed for direct international flights.
- The Cancún launch marked a new international-service milestone for the airport.
How many aircraft movements occur at Will Rogers World Airport each year?
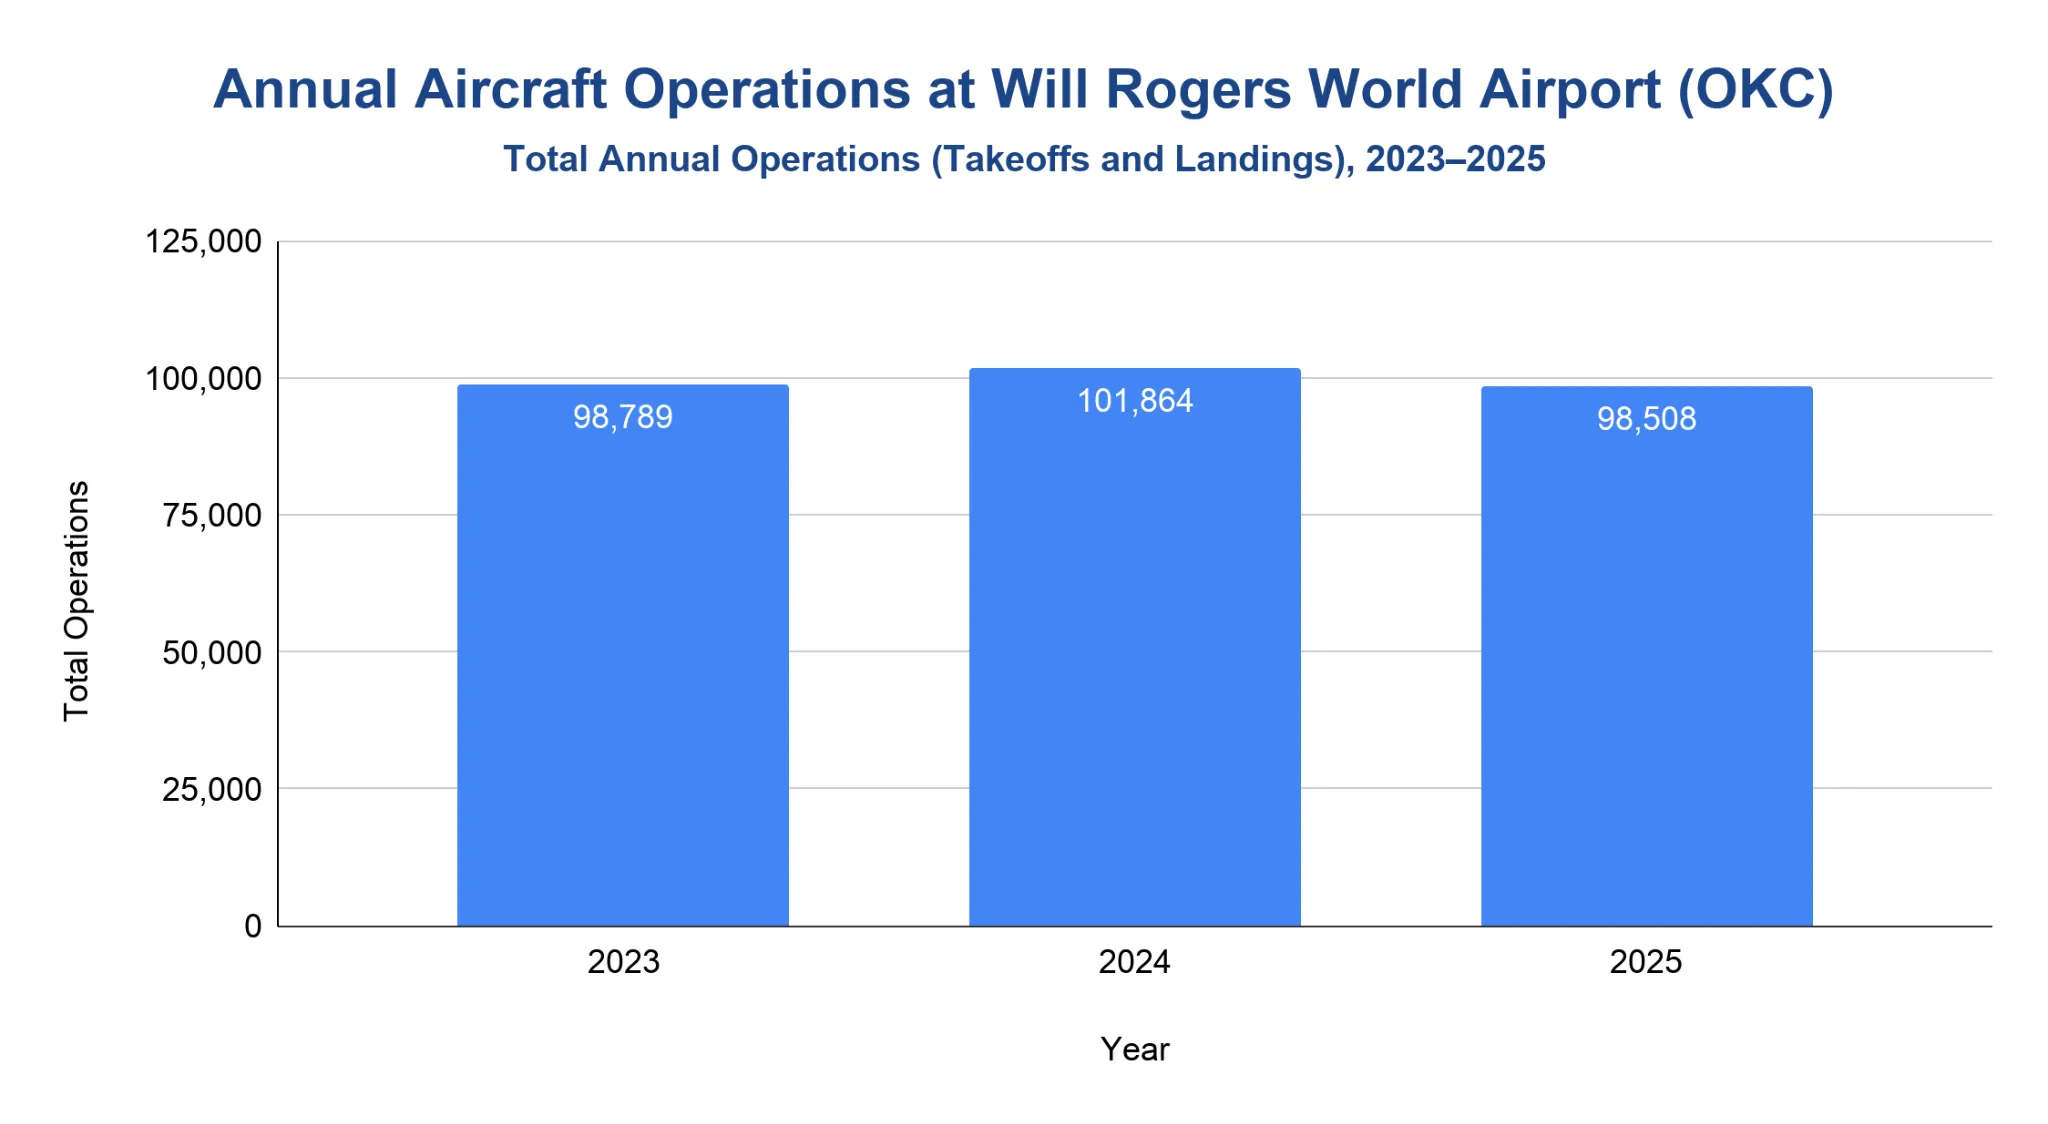
OKC recorded 98,508 aircraft operations in 2025, with commercial flights accounting for 54.7% of total operations.
- Aircraft operations increased from 98,789 in 2023 to 101,864 in 2024, before easing to 98,508 in 2025.
- Commercial operations were the largest category in 2025, with 53,888 movements.
- Civil operations totaled 24,240, representing 24.6% of all aircraft operations.
- Military operations totaled 20,380, representing 20.7% of all aircraft operations.
- Dedicated freighter activity was reported separately as 1,014 freighter landings in 2025, compared with 1,091 in 2024.
| Aircraft Operations by Type at OKC | |||
|---|---|---|---|
| Year | Commercial Operations | Civil Operations | Military Operations |
| 2023 | 44,610 | 24,381 | 29,798 |
| 2024 | 52,304 | 24,608 | 24,952 |
| 2025 | 53,888 | 24,240 | 20,380 |
Source · Aircraft operations count takeoffs and landings.
Which airlines carry the most passengers at Will Rogers World Airport?
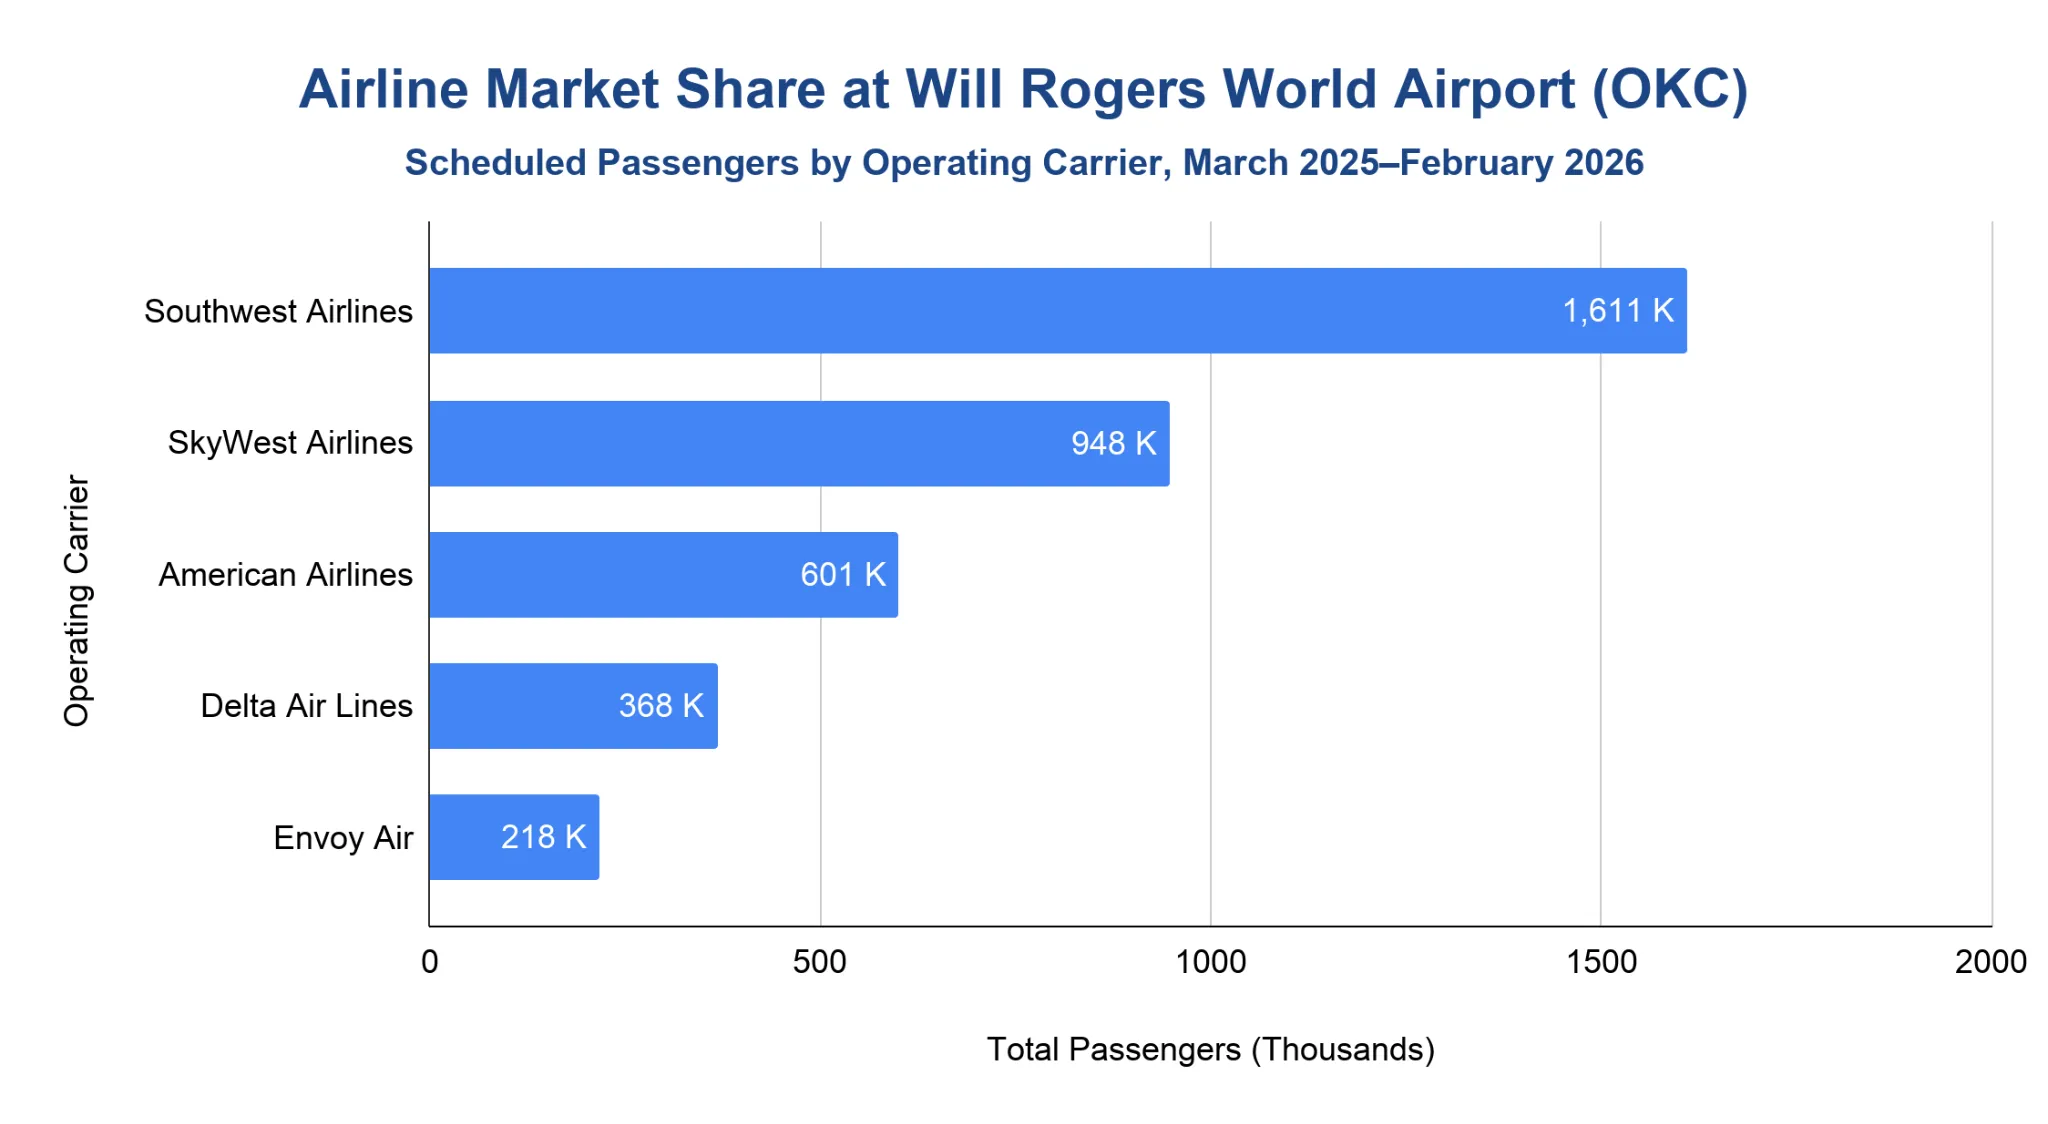
Southwest Airlines was OKC’s largest operating carrier in March 2025–February 2026, carrying 1.61 million scheduled passengers for a 36.2% share.
- The Bureau of Transportation Statistics (BTS) carrier-share table covers scheduled United States (U.S.) flights for March 2025–February 2026.
- Southwest Airlines carried 1.61 million passengers, more than one-third of the carrier table.
- SkyWest Airlines ranked second with 948,000 passengers and a 21.32% share.
- American Airlines carried 601,000 passengers, representing 13.51% of the table.
- Delta Air Lines and Envoy Air followed with 368,000 and 218,000 passengers, respectively.
Note: BTS reports this carrier table by operating carrier, so regional operators such as SkyWest Airlines and Envoy Air are shown separately from their mainline partner brands.
What are the most popular destinations from Will Rogers World Airport?
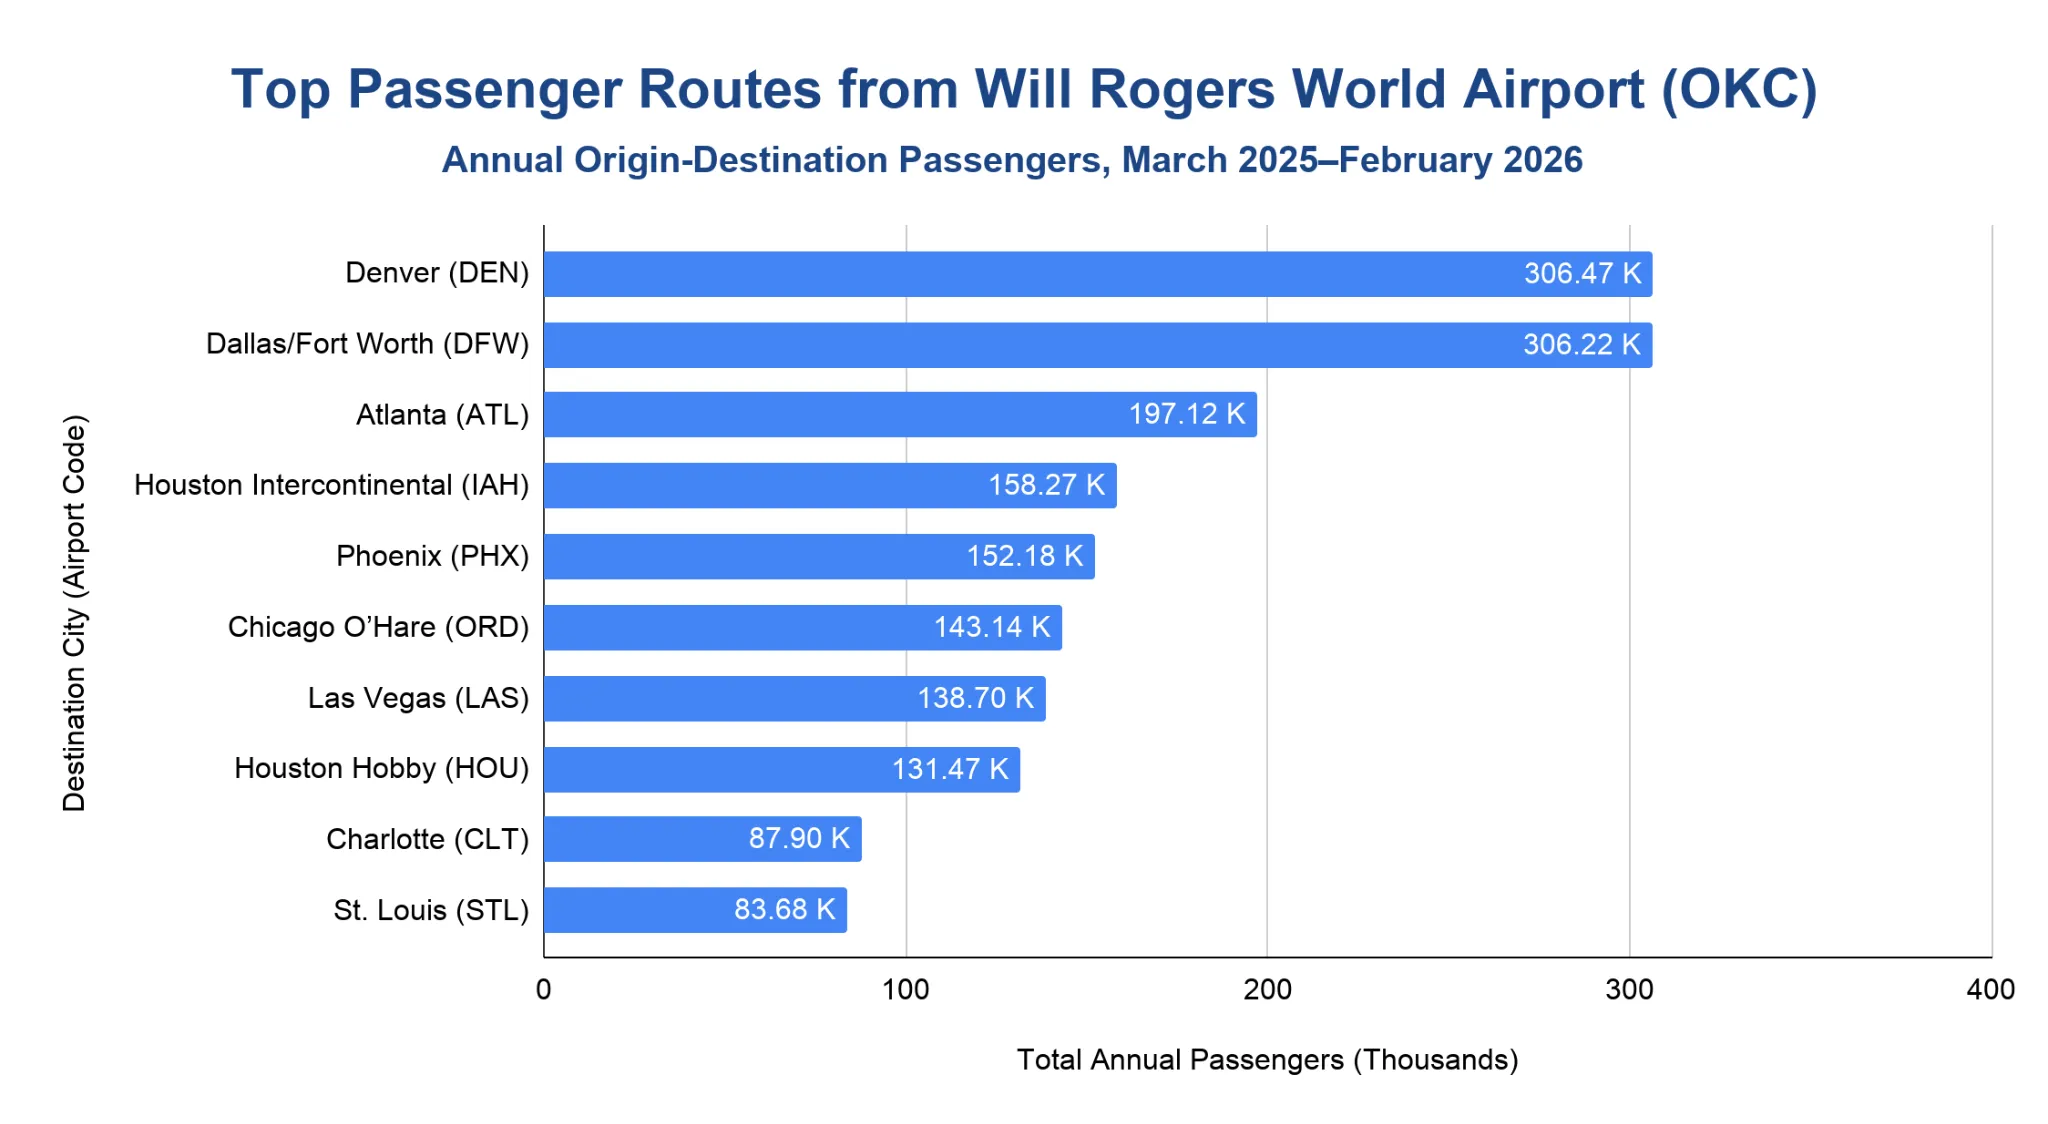
Denver (DEN) narrowly led OKC’s destination list in March 2025–February 2026 with 306,470 passengers.
- Denver (DEN) and Dallas/Fort Worth (DFW) were nearly tied, separated by only 250 passengers.
- Dallas/Fort Worth (DFW) ranked second with 306,220 passengers.
- Atlanta (ATL) ranked third with 197,120 passengers.
- Houston Intercontinental (IAH) and Phoenix (PHX) rounded out the top five with 158,270 and 152,180 passengers, respectively.
- The top ten also included Chicago O’Hare (ORD), Las Vegas (LAS), Houston Hobby (HOU), Charlotte (CLT), and St. Louis (STL).
Note: BTS T-100 Domestic Market figures are reported by airport pair; Houston Intercontinental and Houston Hobby are separate destination airports.
Peak Travel Months at Will Rogers World Airport
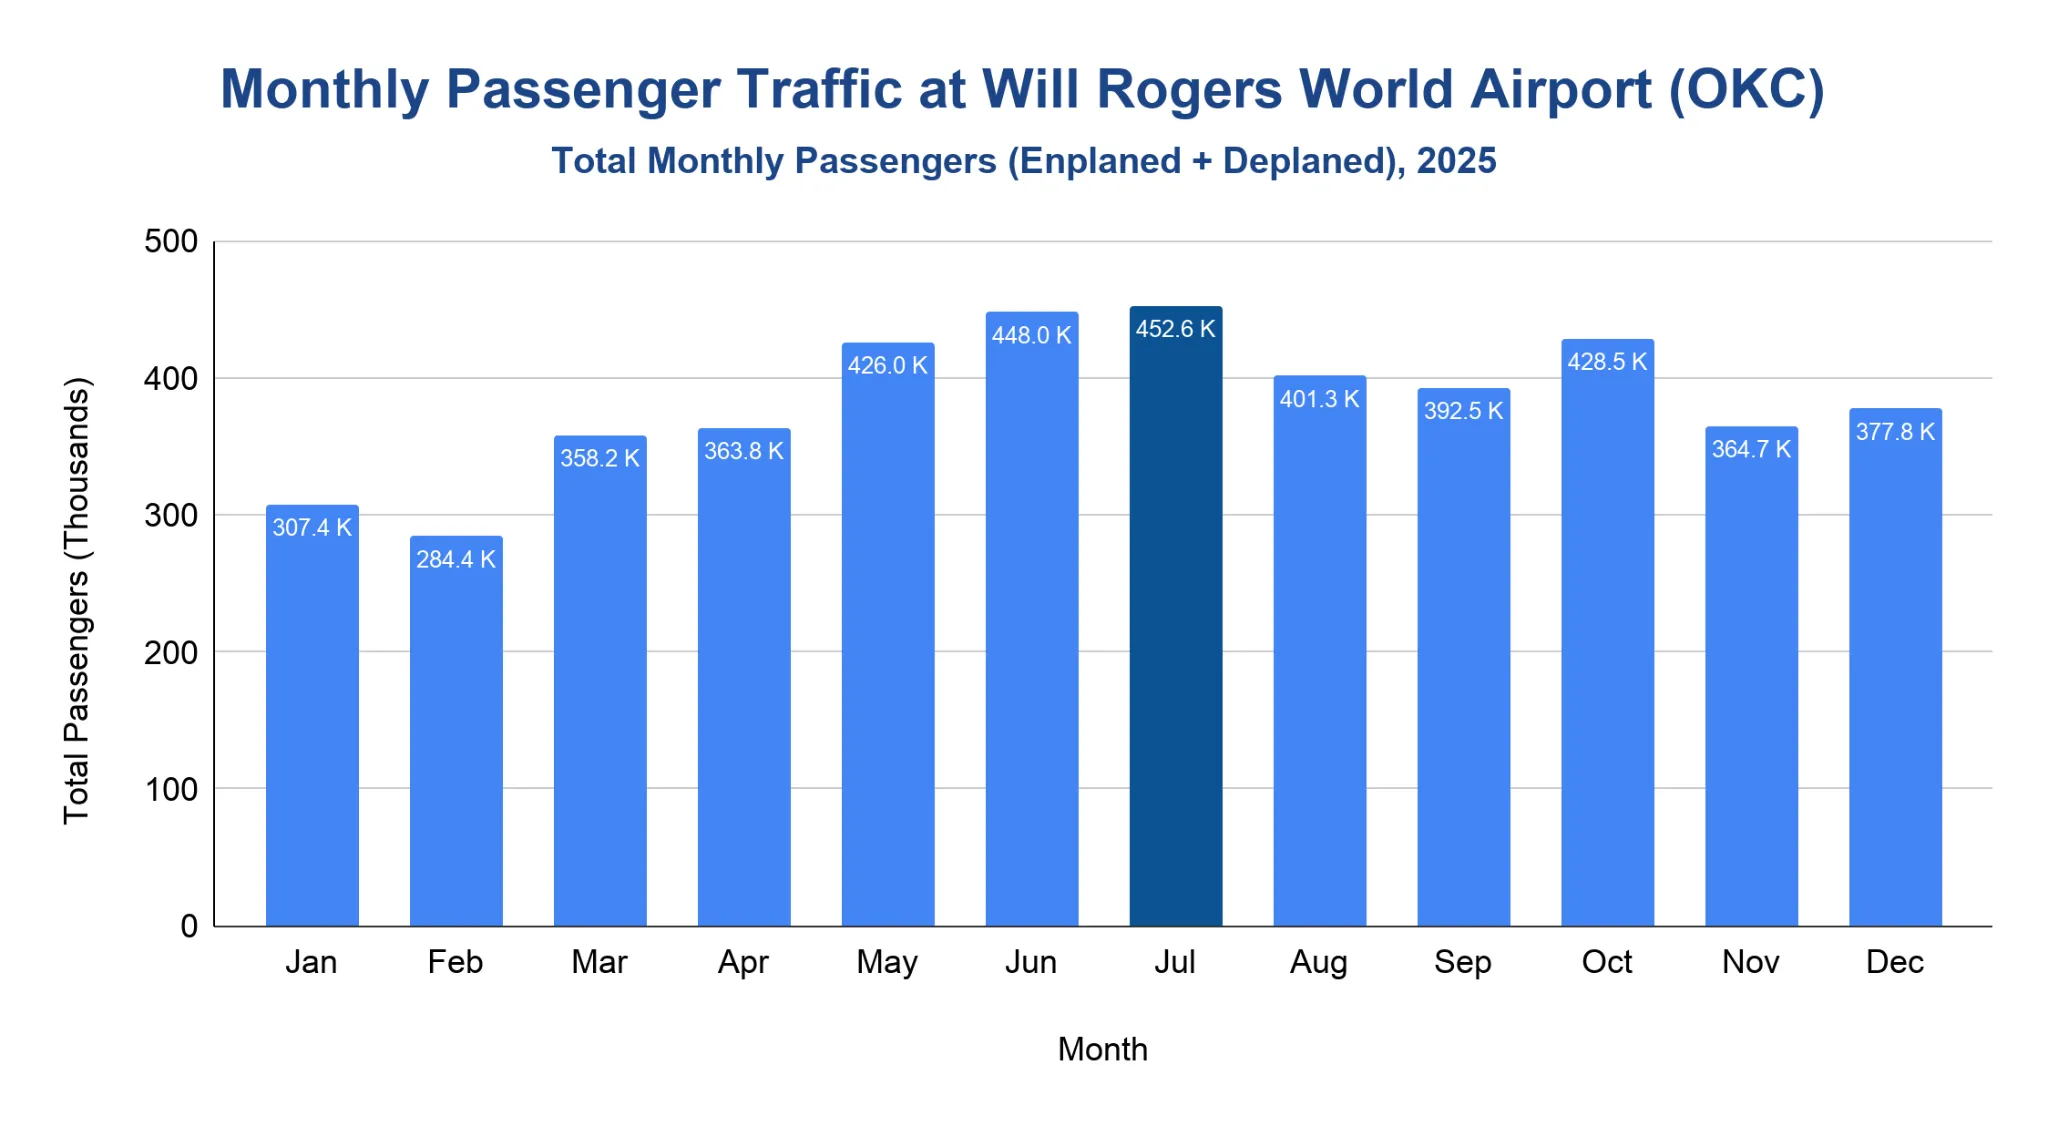
July was OKC’s busiest month in 2025, with 452,620 total passengers.
- Summer travel produced the two busiest months of the year, with 452,620 total passengers in July and 447,978 in June.
- October was the strongest non-summer month, reaching 428,466 total passengers.
- May also exceeded 425,000 total passengers, reflecting late-spring and early-summer travel demand.
- February was the quietest month, with 284,413 total passengers.
- December reached 377,770 total passengers, above the winter low but below the summer peak.
Note: Monthly total passengers are calculated by adding airport-reported enplaned and deplaned passengers. This section uses total passenger traffic, while the annual passenger-history section uses FAA passenger boardings, which count departing passengers only.
How much cargo passes through Will Rogers World Airport each year?
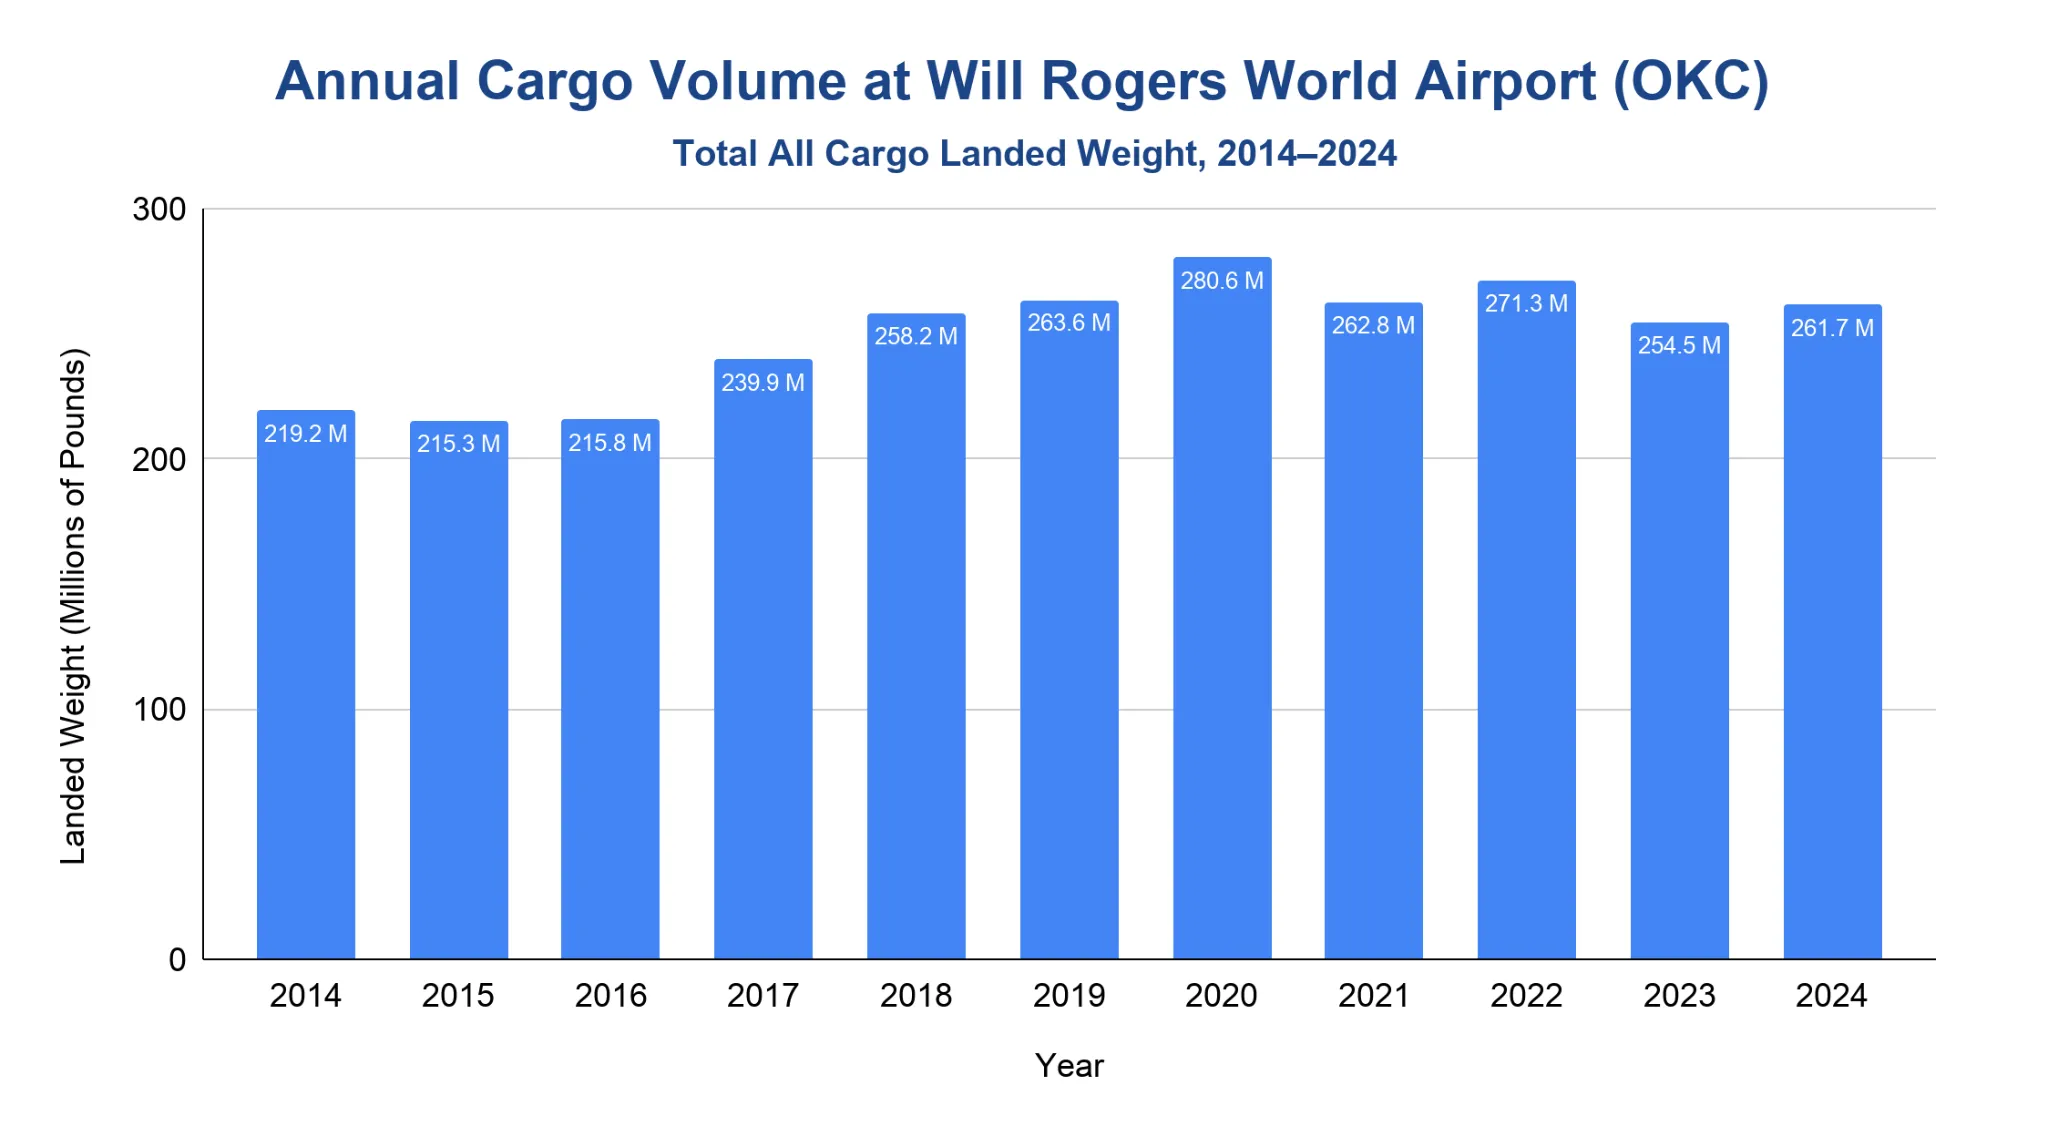
OKC recorded 261.7 million pounds of FAA all-cargo landed weight in 2024, the latest final FAA cargo year available.
- FAA all-cargo landed weight increased from 219.22 million pounds in 2014 to 258.21 million pounds in 2018.
- Pre-pandemic all-cargo landed weight reached 263.56 million pounds in 2019.
- The pandemic period did not show the same decline as passenger traffic; all-cargo landed weight rose to 280.58 million pounds in 2020 before easing to 262.75 million pounds in 2021.
- Post-pandemic landed weight reached 271.32 million pounds in 2022, then eased to 254.54 million in 2023.
- In 2024, OKC recorded 261.7 million pounds of all-cargo landed weight, up 2.81% from 2023.
Note: All-cargo landed weight measures the weight of arriving all-cargo aircraft.
How much revenue does Will Rogers World Airport generate each year?
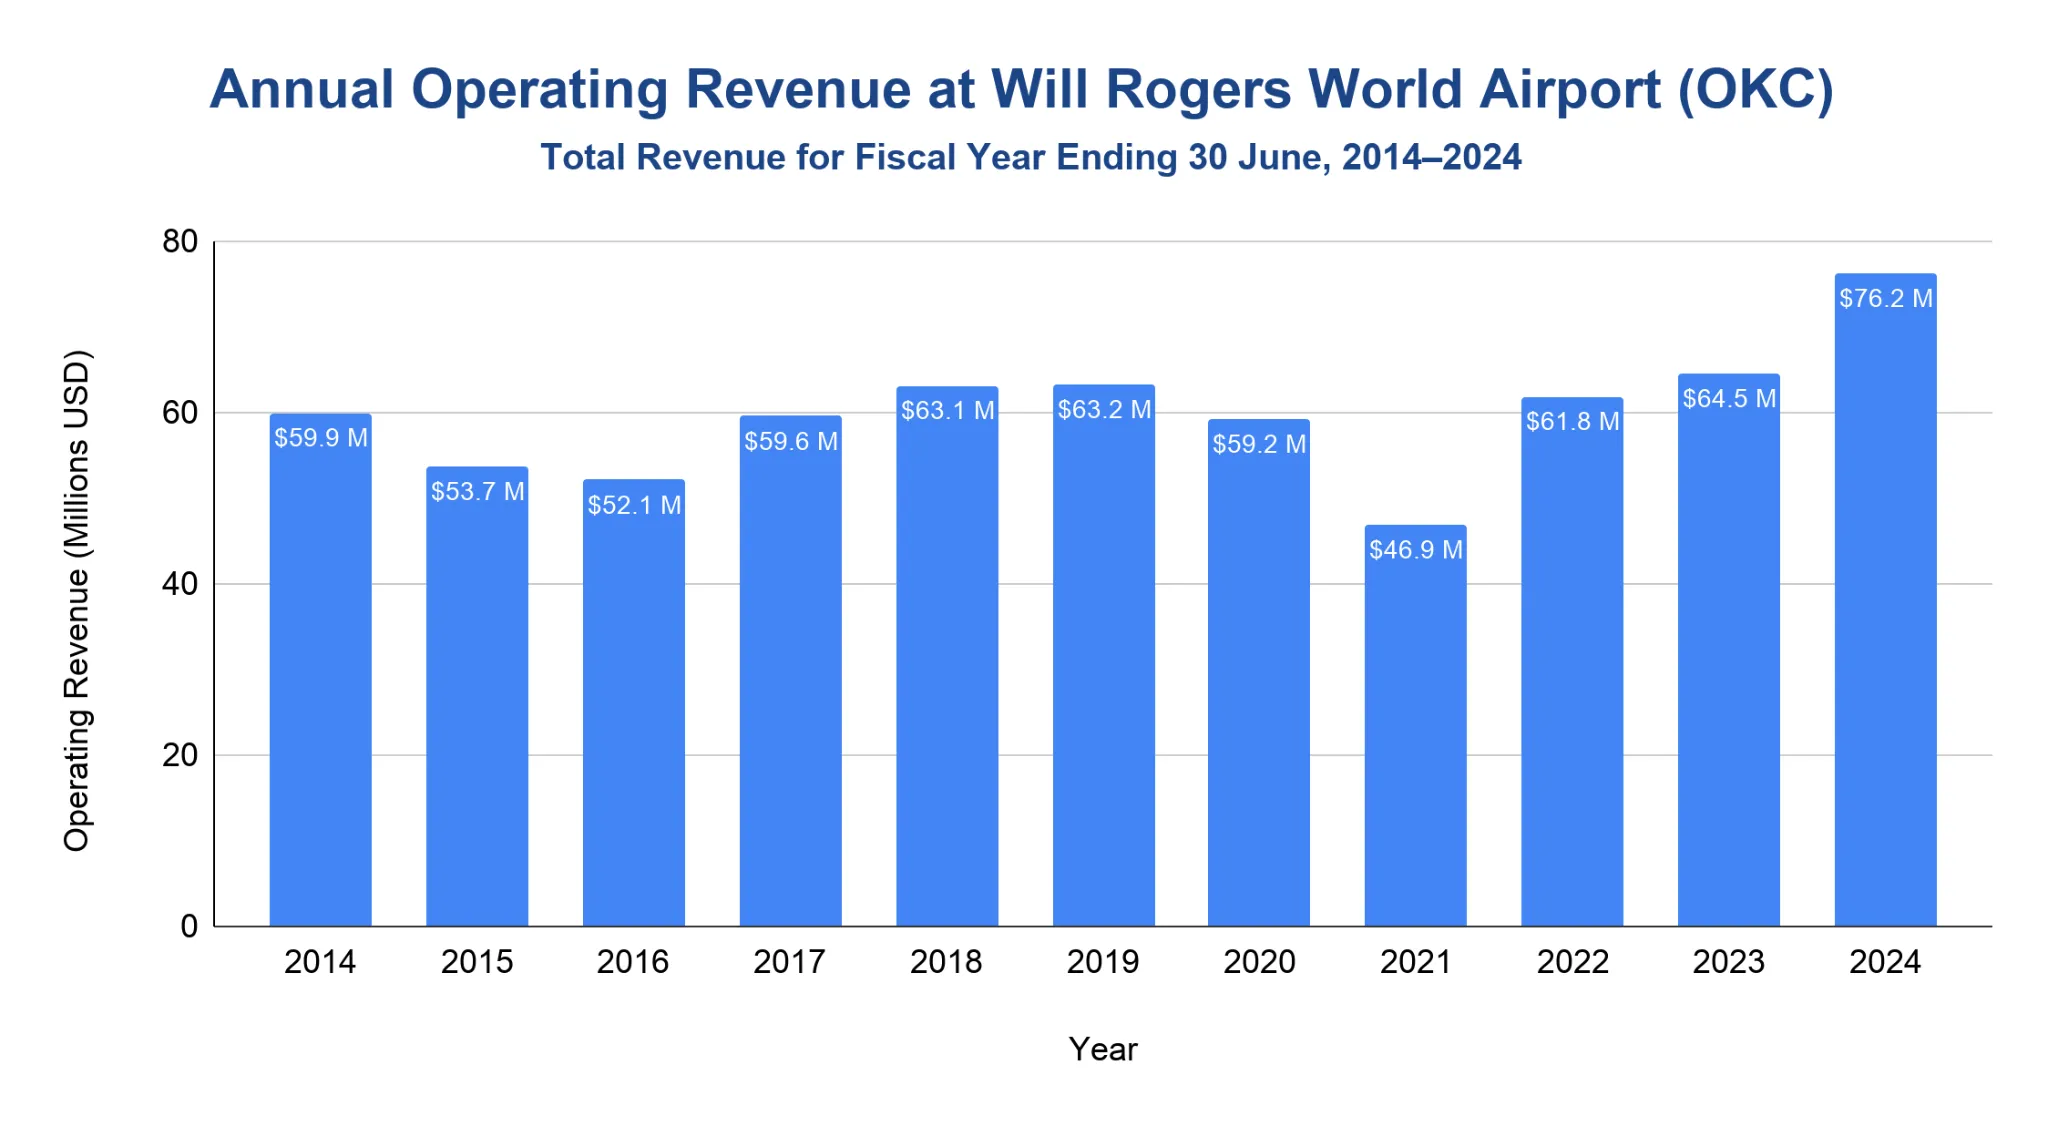
OKC reported $76.18 million in total operating revenue in 2024 in FAA Compliance Activity Tracking System (CATS) Form 127 data.
- Total operating revenue moved from $59.91 million in 2014 to $63.1 million in 2018, despite a mid-period low of $52.11 million in 2016.
- Pre-pandemic operating revenue reached $63.2 million in 2019.
- During the pandemic period, operating revenue declined from $59.21 million in 2020 to $46.86 million in 2021.
- Post-pandemic revenue recovered to $61.83 million in 2022 and $64.52 million in 2023.
- The latest reported year, 2024, was 18.07% above 2023 and 20.55% above 2019.
Note: Total operating revenue is the Form 127 operating-revenue line. The Oklahoma City Airport Trust fiscal year ends on June 30.
How reliable is Will Rogers World Airport?
For March 2025–February 2026, 80% of OKC departures and 74% of arrivals were on time in the Bureau of Transportation Statistics (BTS) domestic-flights summary.
- OKC’s on-time departure rate was 80% in the latest BTS rolling period, down from 83% in 2024.
- The on-time arrival rate was 74%, down from 78% in 2024.
- Average delay among delayed flights was 79.67 minutes for departures and 69.64 minutes for arrivals.
- The cancellation rate was 1.15% in March 2025–February 2026.
- The airport’s reported domestic-flight count was 20,800 for the rolling period.
| Metric | 2021 | 2022 | 2023 | 2024 | 2025 | 2026* |
|---|---|---|---|---|---|---|
| On-time departures | 83% | 81% | 83% | 83% | 80% | 80% |
| On-time arrivals | 78% | 75% | 77% | 78% | 74% | 74% |
| Avg departure delay (min.) | 84.89 | 73.43 | 74.52 | 77.00 | 80.97 | 79.67 |
| Avg arrival delay (min.) | 62.56 | 63.32 | 63.10 | 63.96 | 69.66 | 69.64 |
| Cancelled flights | 2.14% | 2.46% | 0.88% | 1.00% | 1.42% | 1.15% |
| Flights | 19,500 | 20,500 | 21,300 | 22,800 | 24,200 | 20,800 |
Source · BTS counts a flight as delayed when it arrives or departs 15 minutes or more after schedule. Average delay minutes are calculated from delayed flights only. *2026 covers March 2025 through February 2026. BTS publishes average delays in decimal-minute format. As such, the values have been kept exactly as reported to avoid altering the underlying data.
Related Travel Statistics
- Aspen/Pitkin County Airport Statistics
- Bangor International Airport (BGR) Statistics
- Buffalo Airport (BUF) Statistics
- Eastern Iowa Airport Statistics
- Eugene Airport (EUG) Statistics
- Gainesville Regional Airport Statistics
- Grand Rapids Airport (GRR) Statistics
- Huntsville Airport (HSV) Statistics
- Midway International Airport Statistics
- Portland International Jetport Statistics
- Raleigh-Durham International Airport Statistics
- Roanoke-Blacksburg Regional Airport Statistics
Major Expansion Projects at Will Rogers World Airport
The FY2025–FY2029 capital plan includes $53.2 million for Parking Garage D and $13.53 million for the Federal Inspection Station facility buildout.
- Parking Garage D is the largest listed OKC terminal-area project, with $53.2 million in all-years budgeted funding.
- The Federal Inspection Station facility buildout is budgeted at $13.53 million, supporting OKC’s new international passenger-processing capability.
- Passenger boarding bridge replacement is budgeted at $20 million, with spending scheduled across FY2025 through FY2027.
- Baggage claim unit replacement is budgeted at $5.5 million.
- Terminal restroom renovations are budgeted at $5.49 million.
- Runway 17R-35L work includes $6.67 million for north-end reconstruction and $11.87 million for pavement shoulder and lighting rehabilitation.
Note: Capital plan amounts are budgeted project funding, not final completed project costs.
How does Will Rogers World Airport rank?
OKC ranked 69th among United States commercial service airports by FAA passenger boardings in 2024.
- OKC recorded 2.24 million FAA passenger boardings in 2024.
- FAA passenger boardings count enplanements, meaning departing passengers only.
- The airport was listed as a small-hub airport in the 2024 FAA commercial service enplanements report.
- The 69th-place ranking reflects passenger boardings, not total passengers.
- Total airport passenger traffic is higher than FAA boardings because total traffic includes both departing and arriving passengers.
Note: FAA passenger boardings are used for federal airport ranking and classification. They should not be compared directly with total passenger traffic.
References
- City of Oklahoma City — Will Rogers World Airport overview, international service and Federal Inspection Station (2025–2026) · okc.gov
- Will Rogers World Airport (flyOKC) — airport activity, monthly passenger totals, aircraft operations and capital projects (2023–2025; FY2025–FY2029) · flyokc.com
- FAA Passenger Boarding and All-Cargo Data Master · faa.gov
- BTS TranStats — Airport profiles (route information by airport) · transtats.bts.gov
- FAA CATS — Form 127 Operating and Financial Summary (FY2014–FY2025) · cats.airports.faa.gov

