

 Popular Countries
 24/7 Support
Updated
Located about 7 miles northwest of downtown Albany in Colonie, New York, Albany International Airport covers 1,171 acres and operates two runways, one measuring 8,500 feet and the other 7,200 feet. It is New York State’s fourth-busiest airport and ranked 87th nationwide for passenger boardings in 2024.
How many passengers travel through Albany International Airport each year?
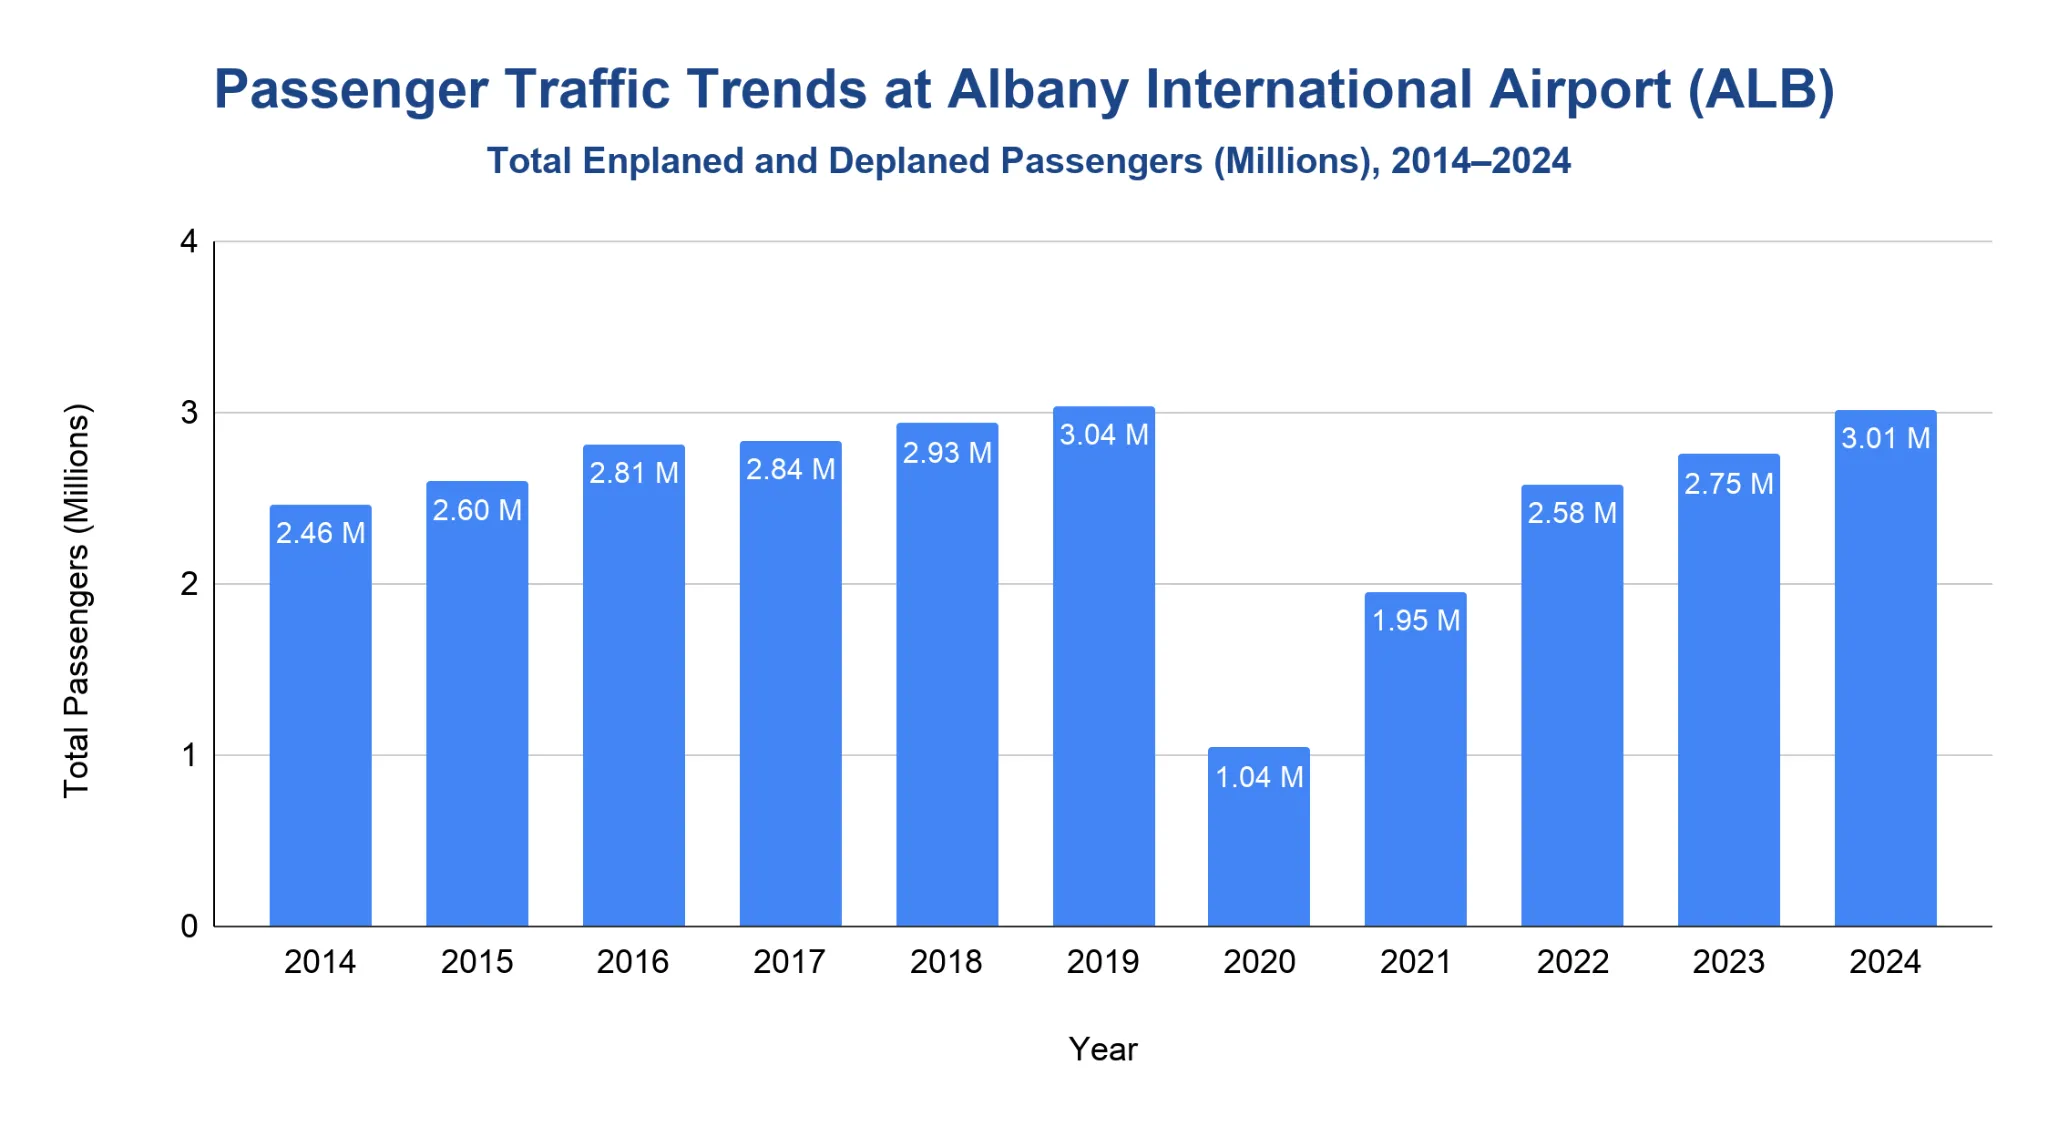
Albany International Airport handled 3.01 million total passengers in 2024, reaching 99% of its 2019 peak.
- From 2014 to 2019 total passenger traffic climbed from 2.46 million to 3.04 million.
- Traffic dropped to 1.04 million in 2020 during the pandemic, the lowest point in the 2014–2024 span.
- Volumes rebounded to 1.95 million in 2021, 2.58 million in 2022 and 2.75 million in 2023.
- The 2024 figure of 3.01 million marks the airport’s 2nd-busiest year on record.
- As of May 2025, ALB had recorded 604,437 departing passengers (enplanements), up 5.3% from the same period in 2024.
Note: The latest year-to-date data for 2025 represents airport authority figures which may vary slightly from T100 market data used in later sections.
Note: Annual figures represent estimated total passengers, calculated as approximately double the number of enplanements.
Does Albany International Airport Offer International Flights?
Albany International Airport currently does not provide international commercial passenger services.
- The 2024 annual report listed only nonstop U.S. destinations in scheduled jet airline service, while also noting that the airport has a Customs / Immigration F.I.S. facility.
- The airport’s current flights and airlines pages likewise show scheduled passenger service only to U.S. destinations.
- The “International” designation reflects customs capability rather than scheduled international commercial passenger flights.
How many aircraft operations take place at Albany International Airport each year?
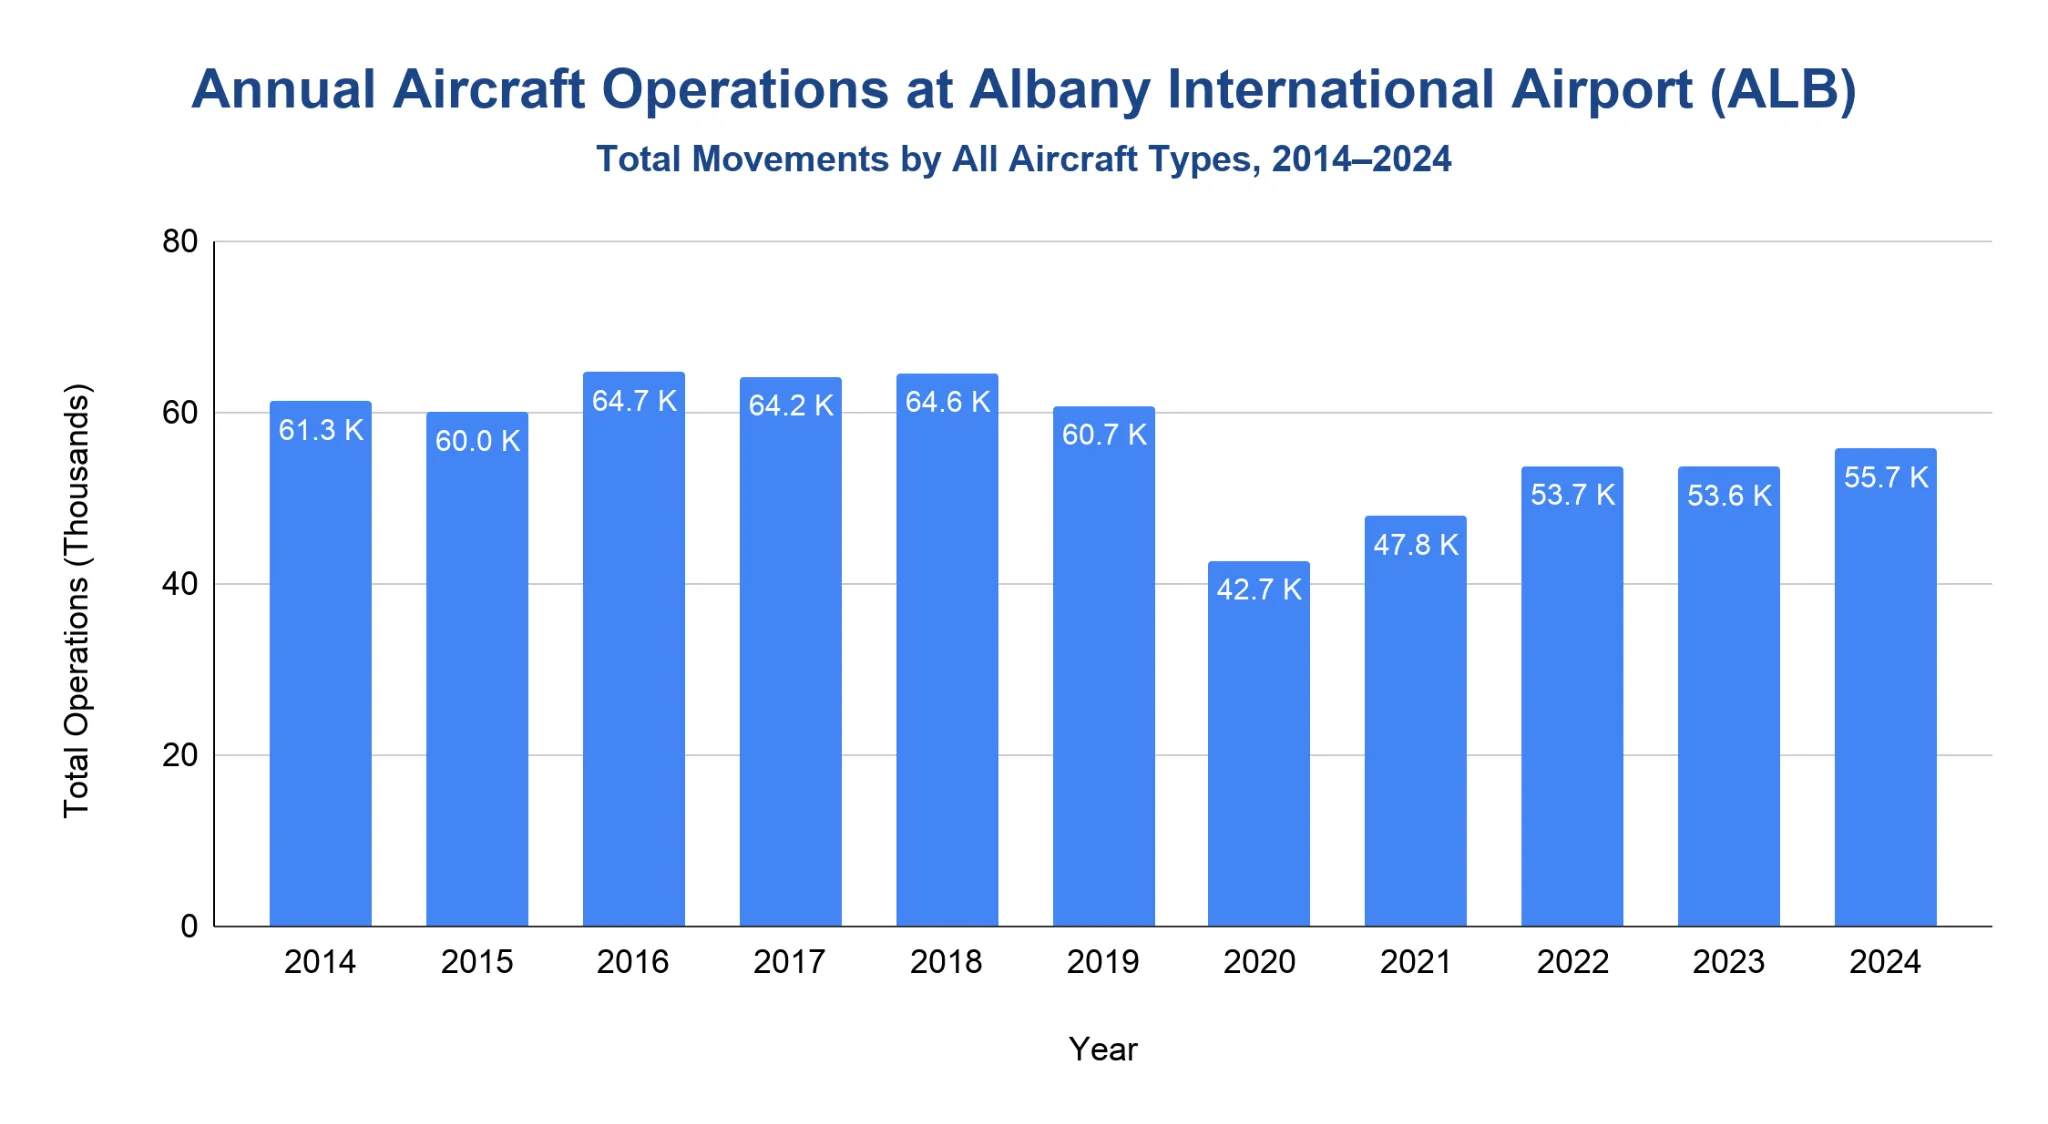
Albany International Airport logged 55,705 aircraft operations in 2024.
- From 2014 to 2019, total operations generally stayed near or above 60,000 per year, peaking at 64,731 in 2016.
- Activity fell to 42,679 in 2020, then rebounded to 47,849 in 2021, 53,726 in 2022, 53,610 in 2023 and 55,705 in 2024.
- The 2024 mix included 31,790 airline movements, 1,772 cargo flights, 19,764 general aviation operations and 2,379 military flights.
- General aviation alone logged 18,124 operations in 2014, 17,608 in 2019, 16,414 in 2020 and 19,764 in 2024.
- The latest full-year official report shows 55,705 total operations in 2024 versus 53,610 in 2023.
| Aircraft Operations by Type at Albany International Airport | |||||
|---|---|---|---|---|---|
| Year | Airlines | Cargo | General Aviation | Military | Total |
| 2014 | 37,082 | 3,770 | 18,124 | 2,316 | 61,292 |
| 2015 | 36,370 | 3,774 | 17,376 | 2,481 | 60,001 |
| 2016 | 39,834 | 4,264 | 17,576 | 3,057 | 64,731 |
| 2017 | 39,962 | 4,406 | 16,818 | 2,974 | 64,160 |
| 2018 | 39,402 | 4,148 | 17,753 | 3,300 | 64,603 |
| 2019 | 36,446 | 3,750 | 17,608 | 2,944 | 60,748 |
| 2020 | 19,604 | 3,174 | 16,414 | 3,487 | 42,679 |
| 2021 | 23,751 | 3,418 | 17,441 | 3,239 | 47,849 |
| 2022 | 33,267 | 3,346 | 14,521 | 2,592 | 53,726 |
| 2023 | 34,046 | 2,744 | 14,647 | 2,173 | 53,610 |
| 2024 | 31,790 | 1,772 | 19,764 | 2,379 | 55,705 |
Source · Figures represent aircraft operations, with each landing or takeoff counted as one operation.
Which airlines carry the most passengers at Albany International Airport?
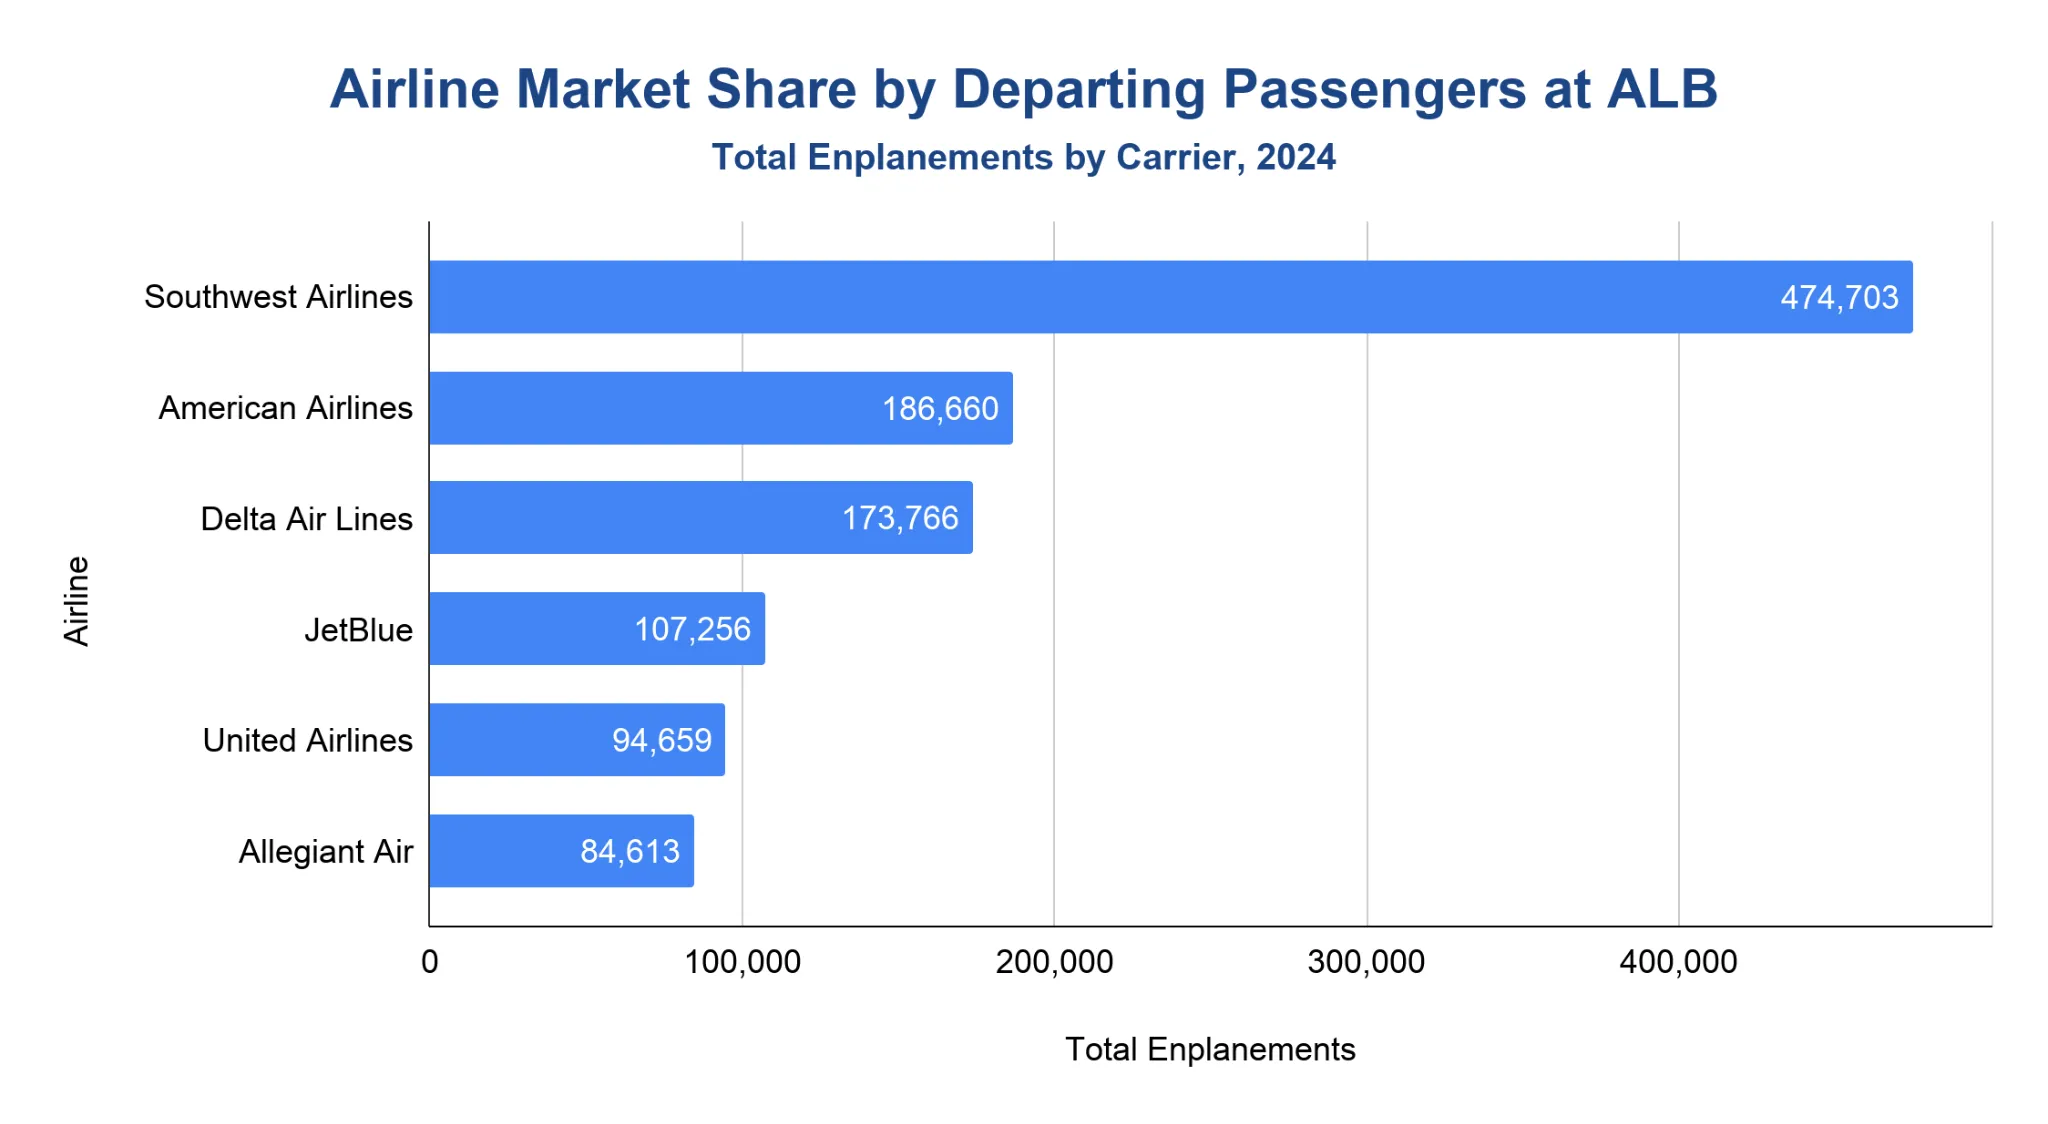
Southwest Airlines carried the most departing passengers at Albany International Airport in 2024, with 474,703 enplanements and a 31.8% market share.
- Southwest Airlines carried about 474,703 departing passengers (31.8%), remaining the market leader.
- American Airlines followed with 186,660 departing passengers (12.4%), and Delta Air Lines carried 173,766 (11.5%).
- JetBlue followed as the fourth-largest carrier with 107,256 departing passengers (7.1%), while United Airlines carried 94,659 departing passengers (6.3%).
- Allegiant Air and other regional carriers accounted for much of the remaining market.
- The latest full-year official report shows Southwest leading with 474,703 enplanements in 2024 versus 450,081 in 2023.
Note: Figures represent enplanements, or departing passengers, by carrier.
What are the most popular destinations from Albany International Airport?
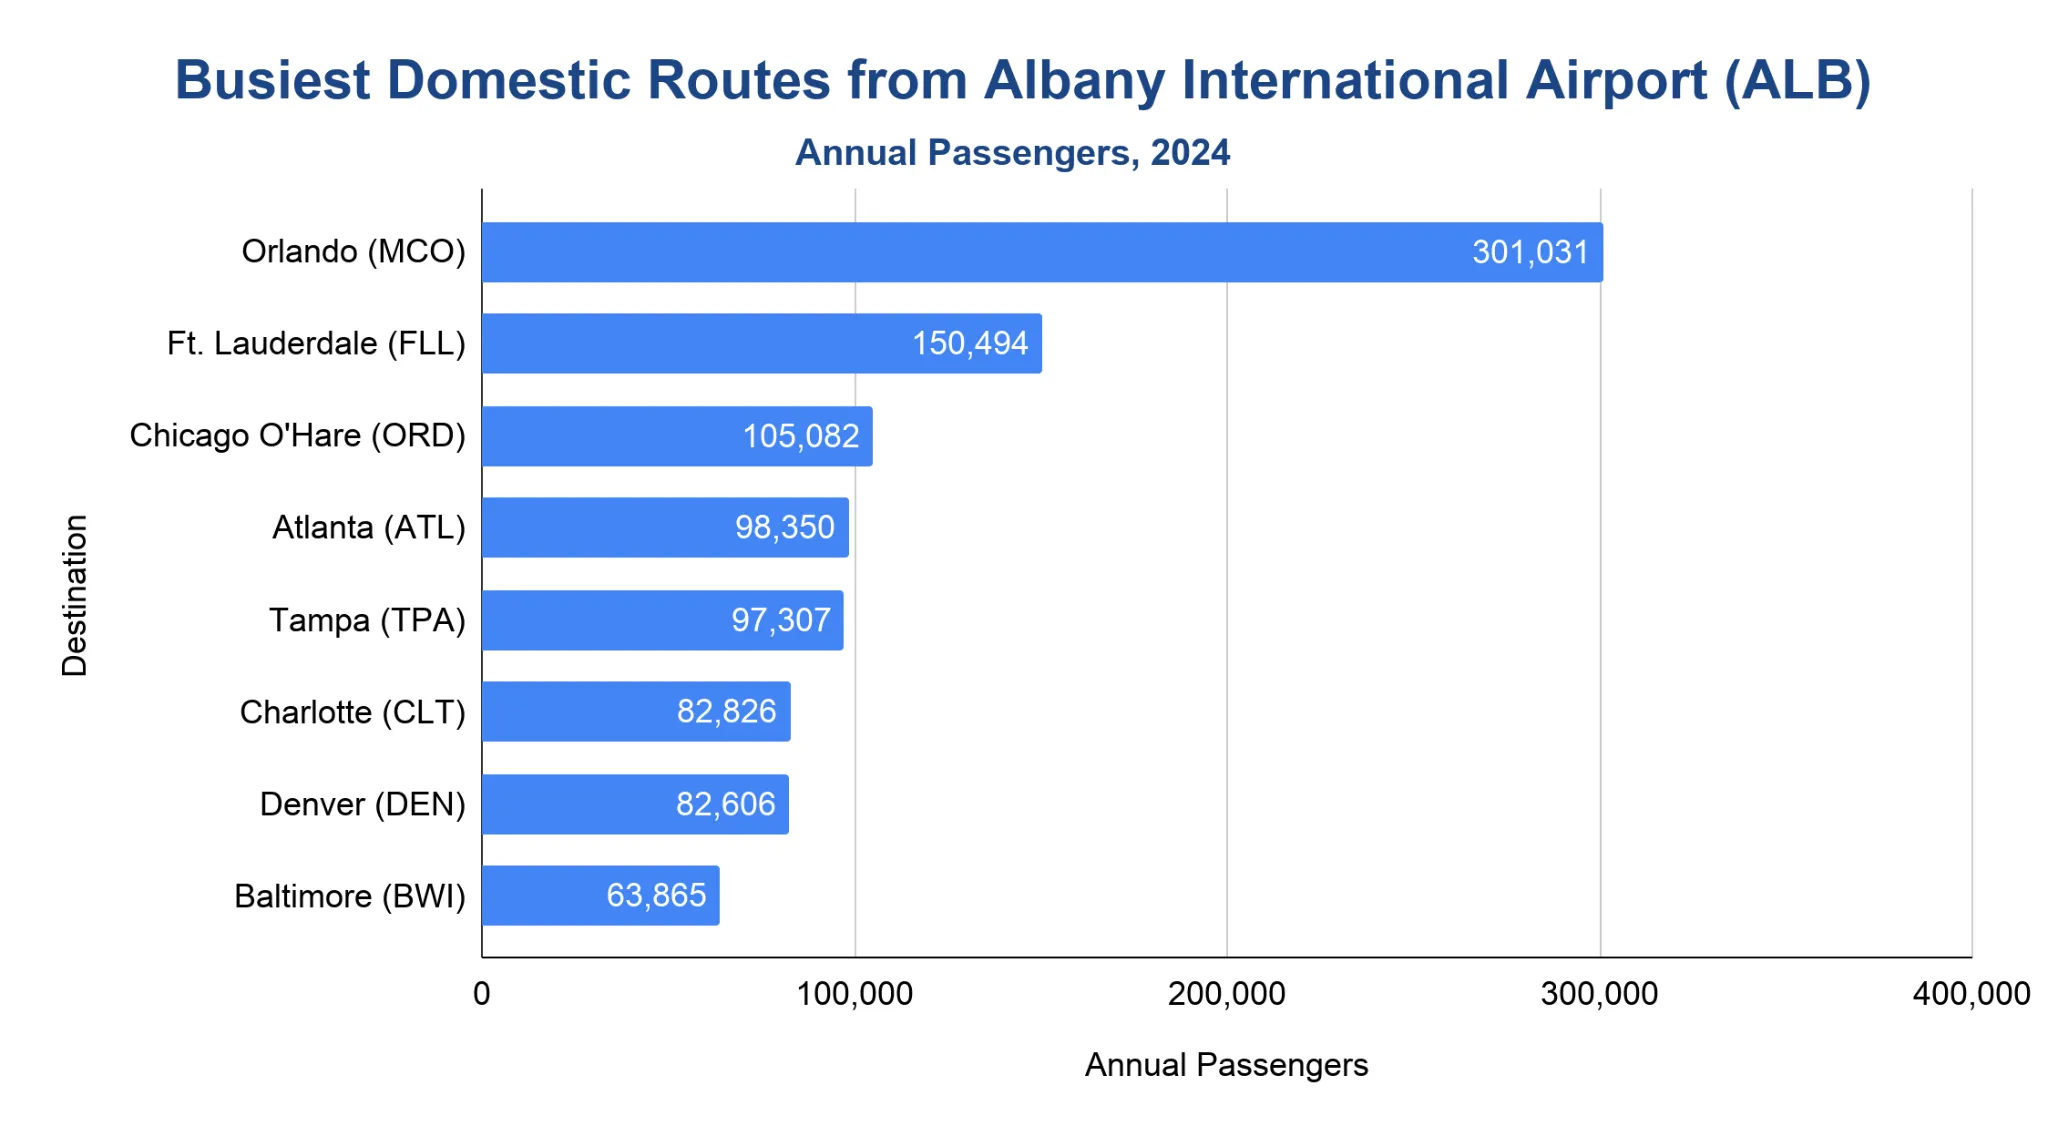
Orlando (MCO) ranked first with 301,031 passengers in 2024.
- Ft. Lauderdale served 150,494 passengers, placing second.
- Chicago O’Hare (ORD) moved 105,082 passengers, making it the third-busiest route.
- Atlanta (ATL) handled 98,350 passengers, placing fourth.
- Tampa (TPA) drew 97,307 passengers, also placing among the top five.
- Charlotte (CLT) recorded 82,826 passengers, while Denver (DEN) saw 82,606.
- The latest full-year official report shows Orlando leading with 301,031 passengers in 2024 versus 269,975 in 2023.
Note: All routes are domestic. Figures represent primary origination and destination passenger markets.
How much revenue does Albany International Airport generate each year?
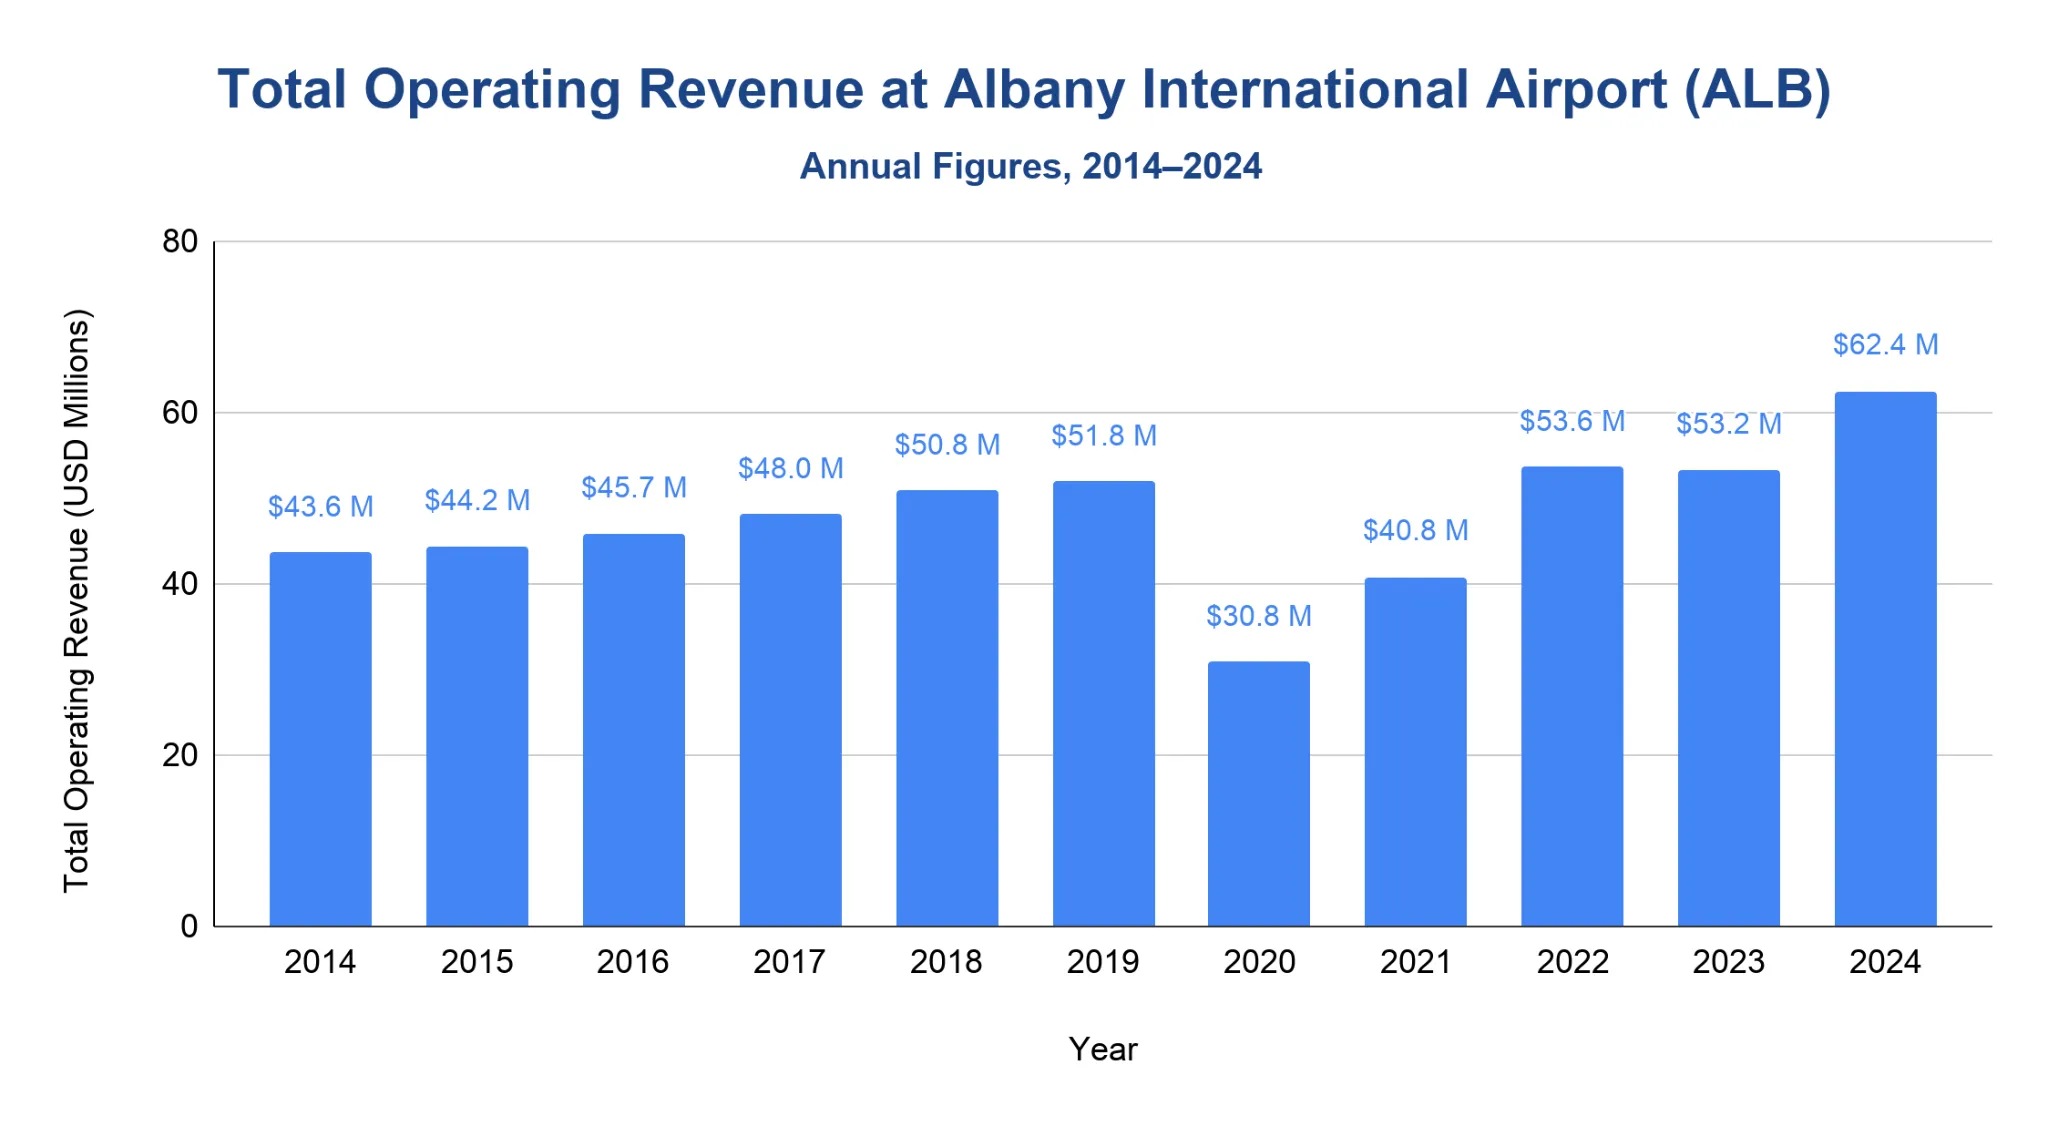
Albany International Airport generated $62.44 million in operating revenue in 2024.
- From 2014 to 2019, operating revenue rose from $43.59 million to $51.84 million.
- Revenue fell to $30.82 million in 2020 before rebounding to $40.78 million in 2021.
- Operating revenue then climbed to $53.58 million in 2022, edged down to $53.23 million in 2023 and rose to $62.44 million in 2024.
- The 2024 figure was the highest audited operating-revenue total in the 2014–2024 period reviewed.
- The latest full-year official report shows ALB generating $62.44 million in operating revenue in 2024 versus $53.23 million in 2023.
Note: Figures represent total audited operating revenues reported by the Albany County Airport Authority. Non-operating income, grants and capital contributions are excluded.
How much cargo moves through Albany International Airport each year?
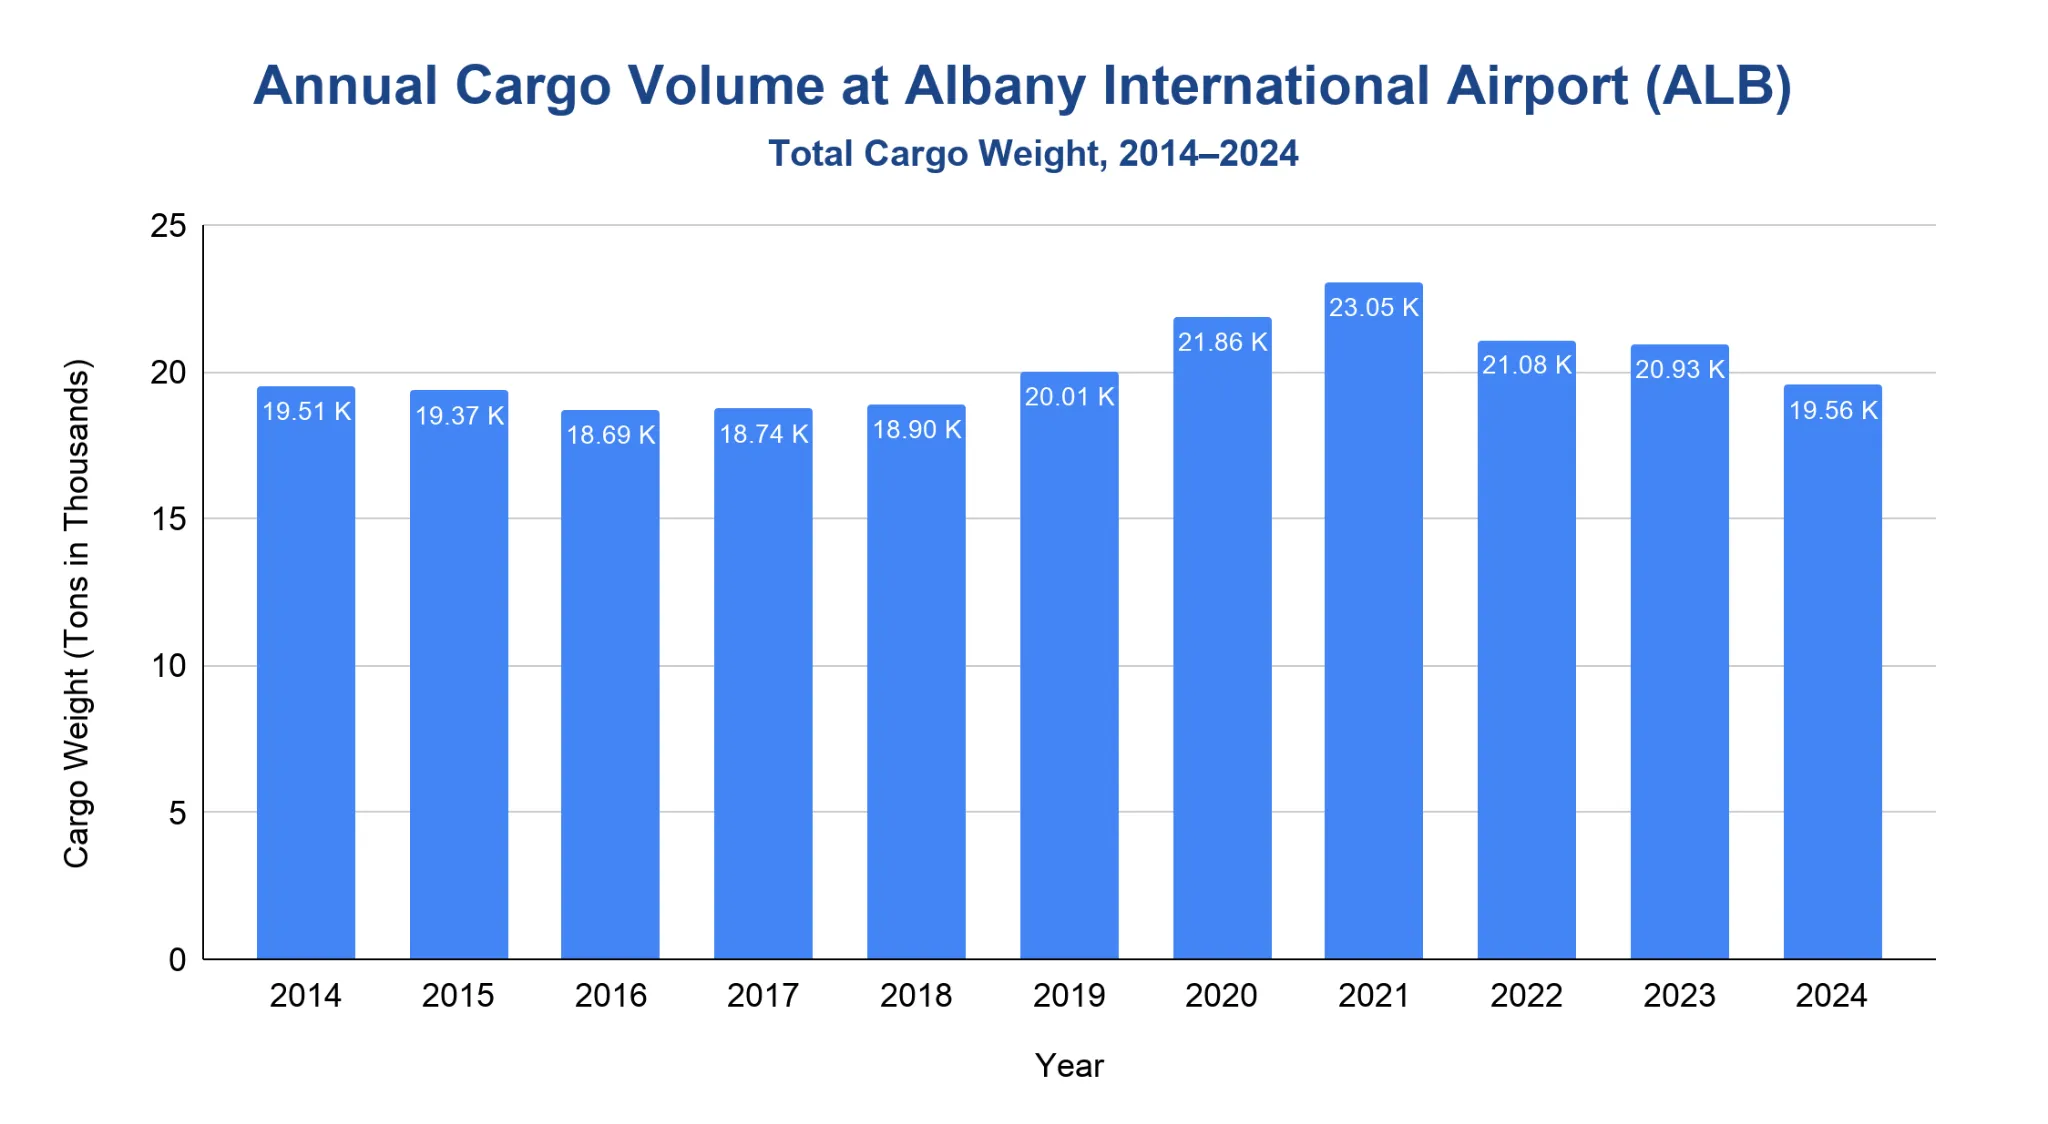
Albany International Airport handled 19,558 tons of cargo in 2024.
- Cargo volumes moved from 19,509 tons in 2014 to 20,009 tons in 2019.
- Pandemic-era demand pushed cargo to 21,858 tons in 2020 and 23,049 tons in 2021, the highest point in the 2014–2024 period reviewed.
- Volumes eased to 21,082 tons in 2022, 20,929 tons in 2023 and 19,558 tons in 2024.
- Federal Express, Mountain Air Cargo and United Parcel Service were the airport’s all-cargo carriers as of December 31, 2024.
- The latest full-year official report shows ALB handling 19,558 tons in 2024 versus 20,929 in 2023.
Note: Figures represent airport-reported cargo in tons. They are not the same measure as FAA landed-weight rankings.
What is Albany International Airport’s on-time performance?
Albany International Airport’s on-time performance is generally reliable, though delays and cancellations vary by year.
- From 2020 to 2025, ALB recorded on-time departure rates ranging from 77% to 84%, while on-time arrival rates ranged from 72% to 82%.
- The 2024 on-time rate was 80% for departures and 75% for arrivals.
- The 2025 on-time rate was 79% for departures and 73% for arrivals.
- Average departure delays measured 76.91 minutes in 2020, 82.57 minutes in 2022, 83.68 minutes in 2024 and 91.76 minutes in 2025.
- Average arrival delays measured 54.33 minutes in 2020, 62.74 minutes in 2022, 63.33 minutes in 2024 and 69.53 minutes in 2025.
- Cancellation rates fell from 8.85% in 2020 to 1.28% in 2024, before edging up to 1.84% in 2025.
- The number of reporting-carrier flights rose from 7,580 in 2020 to 12,595 in 2025.
- The latest full-year data reviewed shows a 79% on-time departure rate and a 73% on-time arrival rate in 2025, with a 1.84% cancellation rate.
| On-Time Performance at Albany International Airport (ALB) | ||||||
|---|---|---|---|---|---|---|
| Metric | 2020 | 2021 | 2022 | 2023 | 2024 | 2025 |
| On-time departure rate | 84% | 82% | 77% | 82% | 80% | 79% |
| On-time arrival rate | 82% | 78% | 72% | 76% | 75% | 73% |
| Average departure delay (min.) | 76.91 | 77.57 | 82.57 | 78.44 | 83.68 | 91.76 |
| Average arrival delay (min.) | 54.33 | 60.76 | 62.74 | 61.29 | 63.33 | 69.53 |
| Cancellation rate | 8.85% | 1.33% | 4.01% | 1.68% | 1.28% | 1.84% |
| Number of flights | 7,580 | 8,517 | 11,980 | 11,891 | 12,042 | 12,595 |
| Number of reporting carriers | 14 | 12 | 12 | 11 | 11 | 10 |
Source · Figures cover domestic flights operated by major U.S. carriers from 2020 to 2025. BTS publishes average delays in decimal-minute format. As such, the values have been kept exactly as reported to avoid altering the underlying data.
Peak Travel Months at Albany International Airport
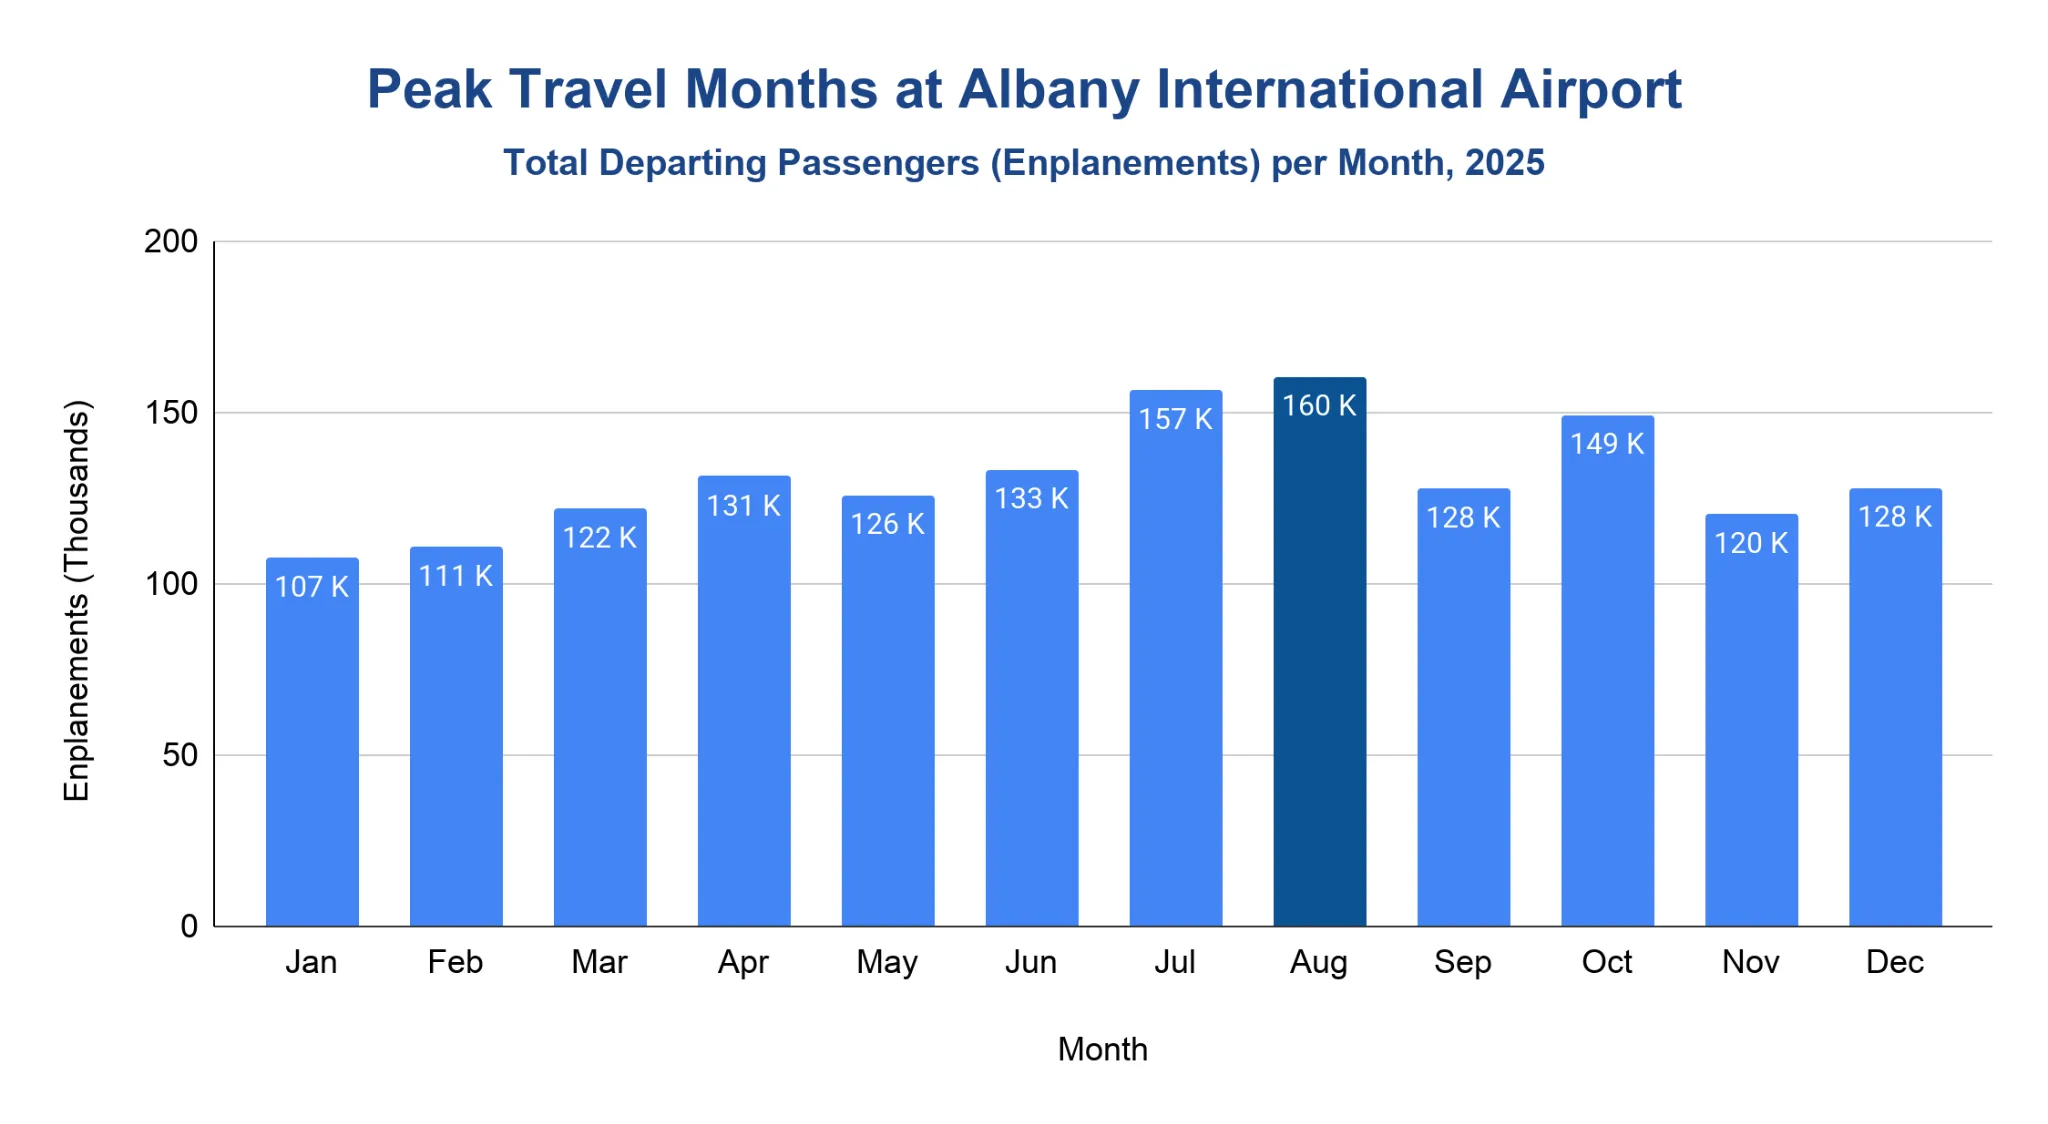
Monthly data for 2025 showed departing passenger totals above 125,000 during the peak travel season.
- June through August drew the highest departing-passenger counts, with 133,212 in June, 156,526 in July and 160,315 in August.
- December holiday travel remained busy at 127,922 departing passengers, though it trailed the midsummer peak.
- January and February were the slowest months, with 107,466 departing passengers in January and 110,634 in February.
- Full-year departing passengers reached 1.57 million in 2025, with August as the busiest month and January as the slowest.
Note: Figures represent departing passengers only from Bureau of Transportation Statistics T-100 Market data for 2025, not total passengers.
Major Expansion Projects at Albany International Airport
Albany International Airport’s largest current capital project is a $100 million main terminal expansion that remained under construction as of February 2026.
- Work continued across the Departure Hall in February 2026, including the signature ceiling feature, new terrazzo flooring, upgraded elevators and escalators, and a future connection to the North Parking Garage.
- Several new passenger amenities had already opened by that point, including the Adirondack Imaginarium children’s play area, the Sensory Room and the renovated Business Center.
- Airport leadership said in September 2024 that the revitalization project would move through five phases rather than one large final unveiling, with phased openings intended to bring portions of the airport back online sooner.
Note: The 2024 annual report said the main terminal project was expected to reach completion in summer 2026.
Albany International Airport Sustainability Initiatives
Albany International Airport’s recent sustainability efforts center on environmental policy commitments and the rollout of sustainable aviation fuel.
- The airport’s Environmental Policy Statement says ALB will maintain an environmental management system, establish a baseline carbon footprint, measure future emissions, and seek continual improvement in sustainability.
- Albany International Airport and Million Air Albany announced in July 2025 that the airport had become the first location in New York to offer a consistent supply of sustainable aviation fuel for business and general aviation, using a targeted 30% SAF blend that the airport said reduces lifecycle carbon emissions by 24% compared with conventional jet fuel.
Related Travel Statistics
- Appleton International Airport Statistics
- Eugene Airport (EUG) Statistics
- Fresno Yosemite International Airport Statistics
- Grand Rapids Airport (GRR) Statistics
- Harrisburg Airport (MDT) Statistics
- LaGuardia Airport (LGA) Statistics
- Los Angeles International Airport Statistics
- Punta Gorda Airport (PGD) Statistics
- Reno-Tahoe International Airport Statistics
- Spokane International Airport (GEG) Statistics
- Palm Beach Airport (PBI) Statistics
- Wichita Airport (ICT) Statistics
Albany International Airport Safety Record
Federal records show a notable 2025 general aviation accident involving a flight that departed Albany International Airport.
- The NTSB’s preliminary report says a Piper PA-28-181 departed Albany International Airport on July 30, 2025, and was substantially damaged in an accident near Block Island, Rhode Island.
- The preliminary report recorded 1 fatality, 1 serious injury, and 1 minor injury.
- The flight was a Part 91 personal flight, and the investigation remains preliminary and subject to change.
How Does Albany International Airport Rank Nationwide?
Albany International Airport ranked among the top 100 U.S. airports for passenger boardings in the latest FAA data reviewed.
- FAA passenger-boarding data for 2024 placed Albany International Airport 87th nationwide, with 1.49 million enplanements.
- FAA all-cargo landed-weight data for 2022 placed Albany International Airport 104th nationwide, with 182.54 million pounds of landed cargo weight.
- The airport’s own 2024 annual report also described ALB as New York State’s 4th-busiest airport by passenger boardings.
References
- Albany County Airport Authority — Airlines, Passenger, Cargo, Aircraft, Top Routes and Finances (2014–2024) · albanyairport.com
- FAA — Commercial Service Enplanements and Hub Classification, CY2024 · faa.gov
- Albany International Airport Prepares for a Busy Fourth of July Travel Weekend (2025) · albanyairport.com
- Bureau of Transportation Statistics Airport Summary Database (2016–2025) · transtats.bts.gov
- Bureau of Transportation Statistics — T-100 Market Data (2025) · transtats.bts.gov
- Albany International Airport — Main Terminal Expansion Project (February 2026) · albanyairport.com
- Airport Leadership Team, Albany County Airport Authority Board Announce Construction Updates (September 2024) · albanyairport.com
- Albany International Airport — Environmental Policy Statement · albanyairport.com
- Million Air Albany and Albany County Airport Authority Now Offering Sustainable Aviation Fuel (2025) · albanyairport.com
- NTSB — Aviation Investigation Report ERA25FA280 (July 30, 2025 accident) · data.ntsb.gov
- FAA — All-Cargo Landed Weight (2022) · faa.gov

