

 Popular Countries
 24/7 Support
Published Sep 9, 2026
Monterey Regional Airport (MRY) is located about 3.5 miles east of downtown Monterey, California. The airport serves the Monterey Peninsula and surrounding areas. Covering 507 acres, MRY is classified by the Federal Aviation Administration (FAA) as a non-hub primary commercial service airport.
How many enplanements does Monterey Regional Airport handle each year?
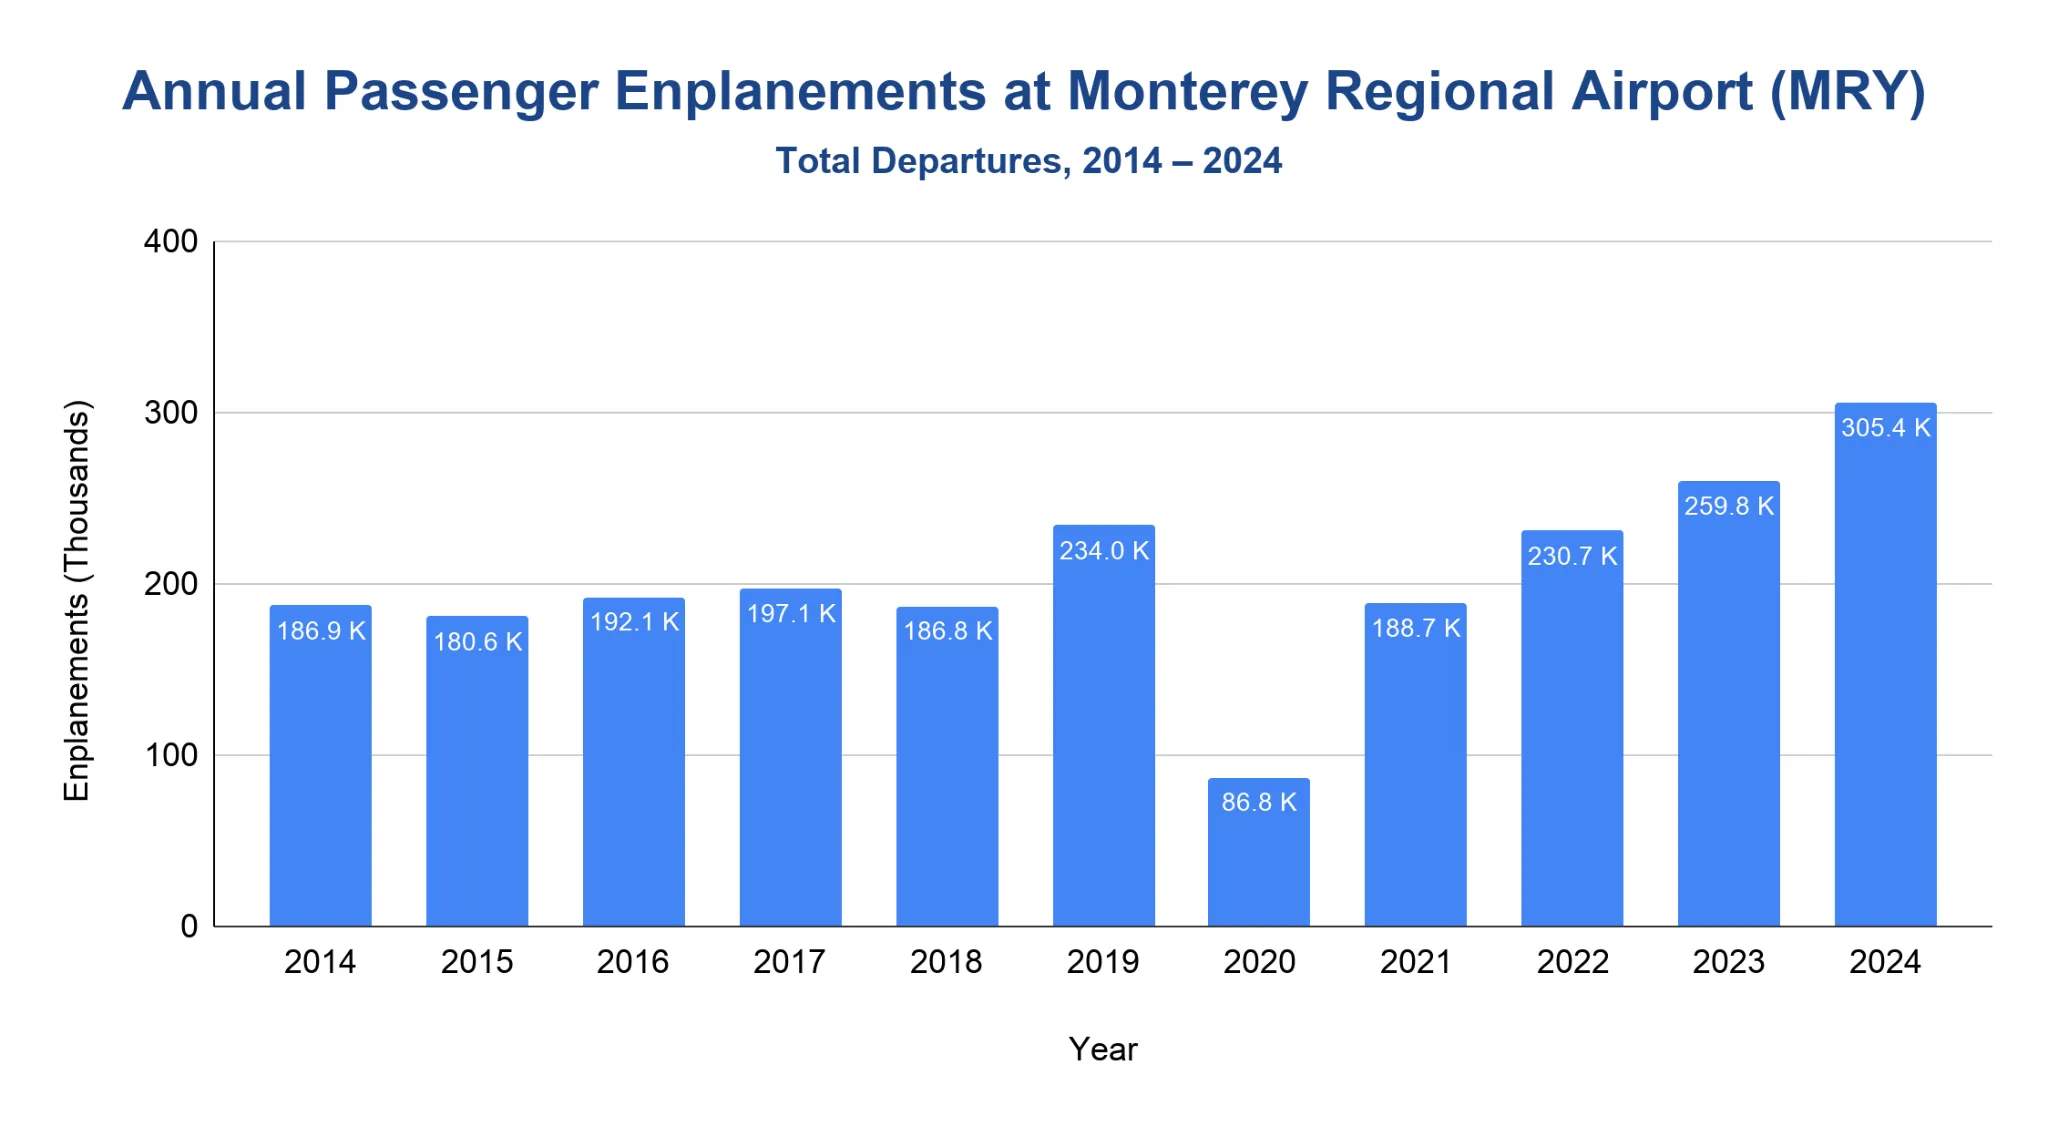
MRY recorded 305,434 commercial passenger enplanements in 2024.
- From 2014 to 2018, enplanements stayed below 200,000, moving from 186,935 in 2014 to 186,806 in 2018.
- Pre-pandemic traffic rose to 233,967 enplanements in 2019.
- The pandemic reduced traffic to 86,795 enplanements in 2020, before recovery began in 2021.
- MRY reached 230,669 enplanements in 2022, 259,778 in 2023 and 305,434 in 2024.
- The 2024 figure was up 17.58% from 2023.
Note: FAA passenger boardings are enplanements, meaning departing passengers only. They are not total arrivals plus departures.
Does Monterey Regional Airport offer domestic or international flights?
MRY’s official scheduled route list shows domestic United States (U.S.) destinations only.
- Official airport route pages list nonstop service to U.S. destinations including Chicago, Seattle, Denver, Dallas/Fort Worth, Phoenix, San Francisco, Las Vegas, Los Angeles and San Diego.
- JSX service is listed to Burbank and Orange County on a seasonal basis.
- Through larger U.S. hub airports, MRY passengers can connect onward to broader domestic and international networks.
- No scheduled international airline route is listed on the airport’s official destination pages.
Note: This section refers to scheduled commercial passenger service, not private or charter aircraft activity.
How many aircraft operations take place at Monterey Regional Airport each year?
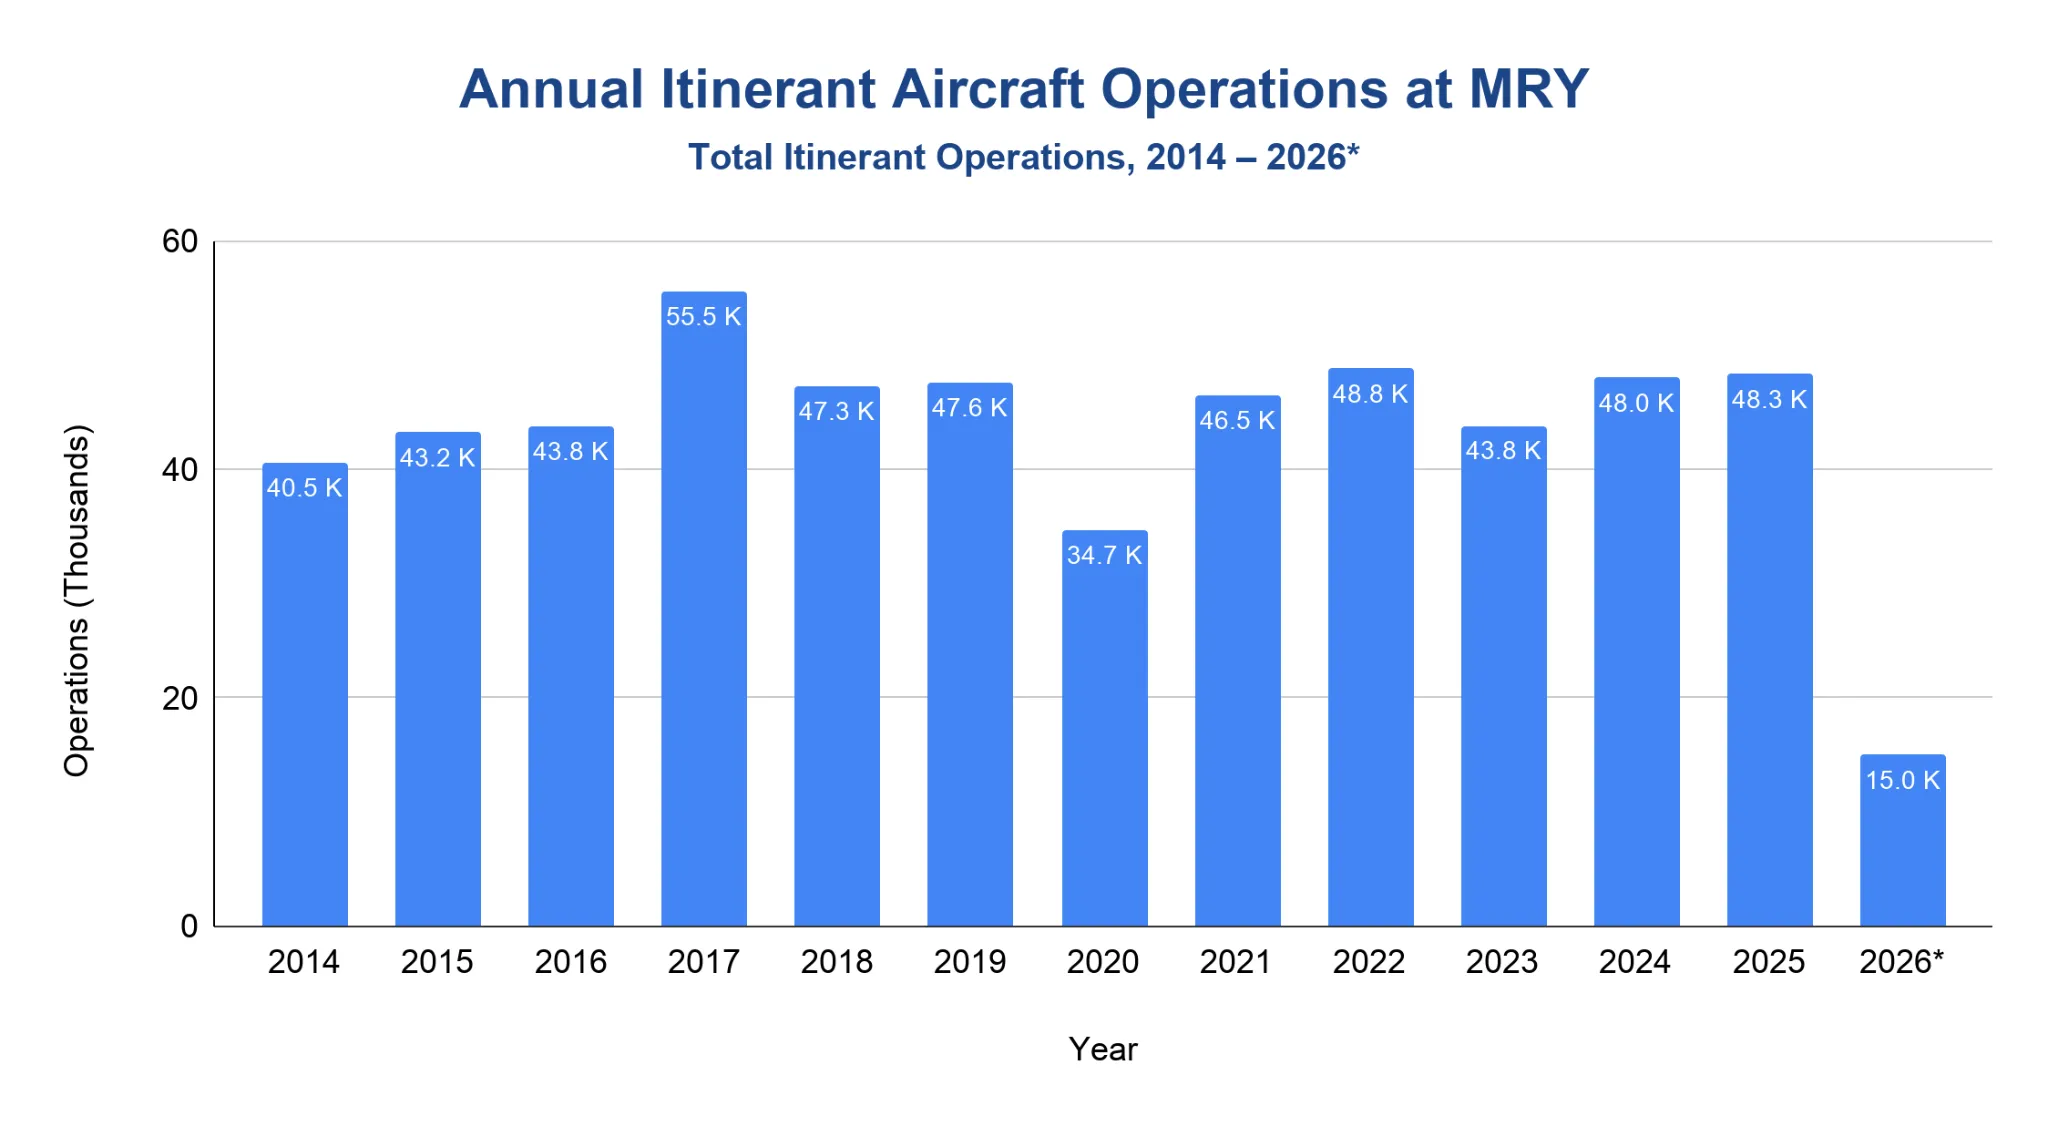
FAA Operations Network (OPSNET) data shows 48,346 itinerant aircraft operations at MRY in 2025. These are aircraft movements that arrive from or depart to another airport.
- From 2014 to 2018, annual activity rose from 40,547 operations to a high of 55,541 in 2017, before easing to 47,261 in 2018.
- Pre-pandemic activity stood at 47,609 operations in 2019.
- Operations fell to 34,704 in 2020, then recovered to 46,460 in 2021 and 48,816 in 2022.
- The latest full-year figures remained steady, with 48,010 operations in 2024 and 48,346 in 2025.
- General aviation was the largest category in 2025, followed by air taxi and air carrier activity.
| Annual Itinerant Aircraft Operations by Type at MRY (2014 – 2026*) | |||||
|---|---|---|---|---|---|
| Year | Air Carrier | Air Taxi | General Aviation | Military | Total |
| 2014 | 1,190 | 13,091 | 25,317 | 949 | 40,547 |
| 2015 | 1,898 | 12,003 | 28,387 | 955 | 43,243 |
| 2016 | 3,720 | 11,185 | 27,280 | 1,619 | 43,804 |
| 2017 | 3,673 | 19,515 | 29,806 | 2,547 | 55,541 |
| 2018 | 3,687 | 11,435 | 30,242 | 1,897 | 47,261 |
| 2019 | 4,483 | 12,289 | 29,719 | 1,118 | 47,609 |
| 2020 | 3,223 | 7,708 | 22,912 | 861 | 34,704 |
| 2021 | 5,160 | 11,774 | 28,316 | 1,210 | 46,460 |
| 2022 | 5,082 | 12,409 | 30,004 | 1,321 | 48,816 |
| 2023 | 6,586 | 10,338 | 25,886 | 1,003 | 43,813 |
| 2024 | 8,277 | 10,263 | 28,274 | 1,196 | 48,010 |
| 2025 | 8,618 | 10,560 | 28,218 | 950 | 48,346 |
| 2026* | 2,462 | 3,154 | 9,120 | 258 | 14,994 |
Source · Note: Itinerant operations exclude local pattern activity. The 2026 row covers January through April only.
Which airlines carry the most passengers at Monterey Regional Airport?
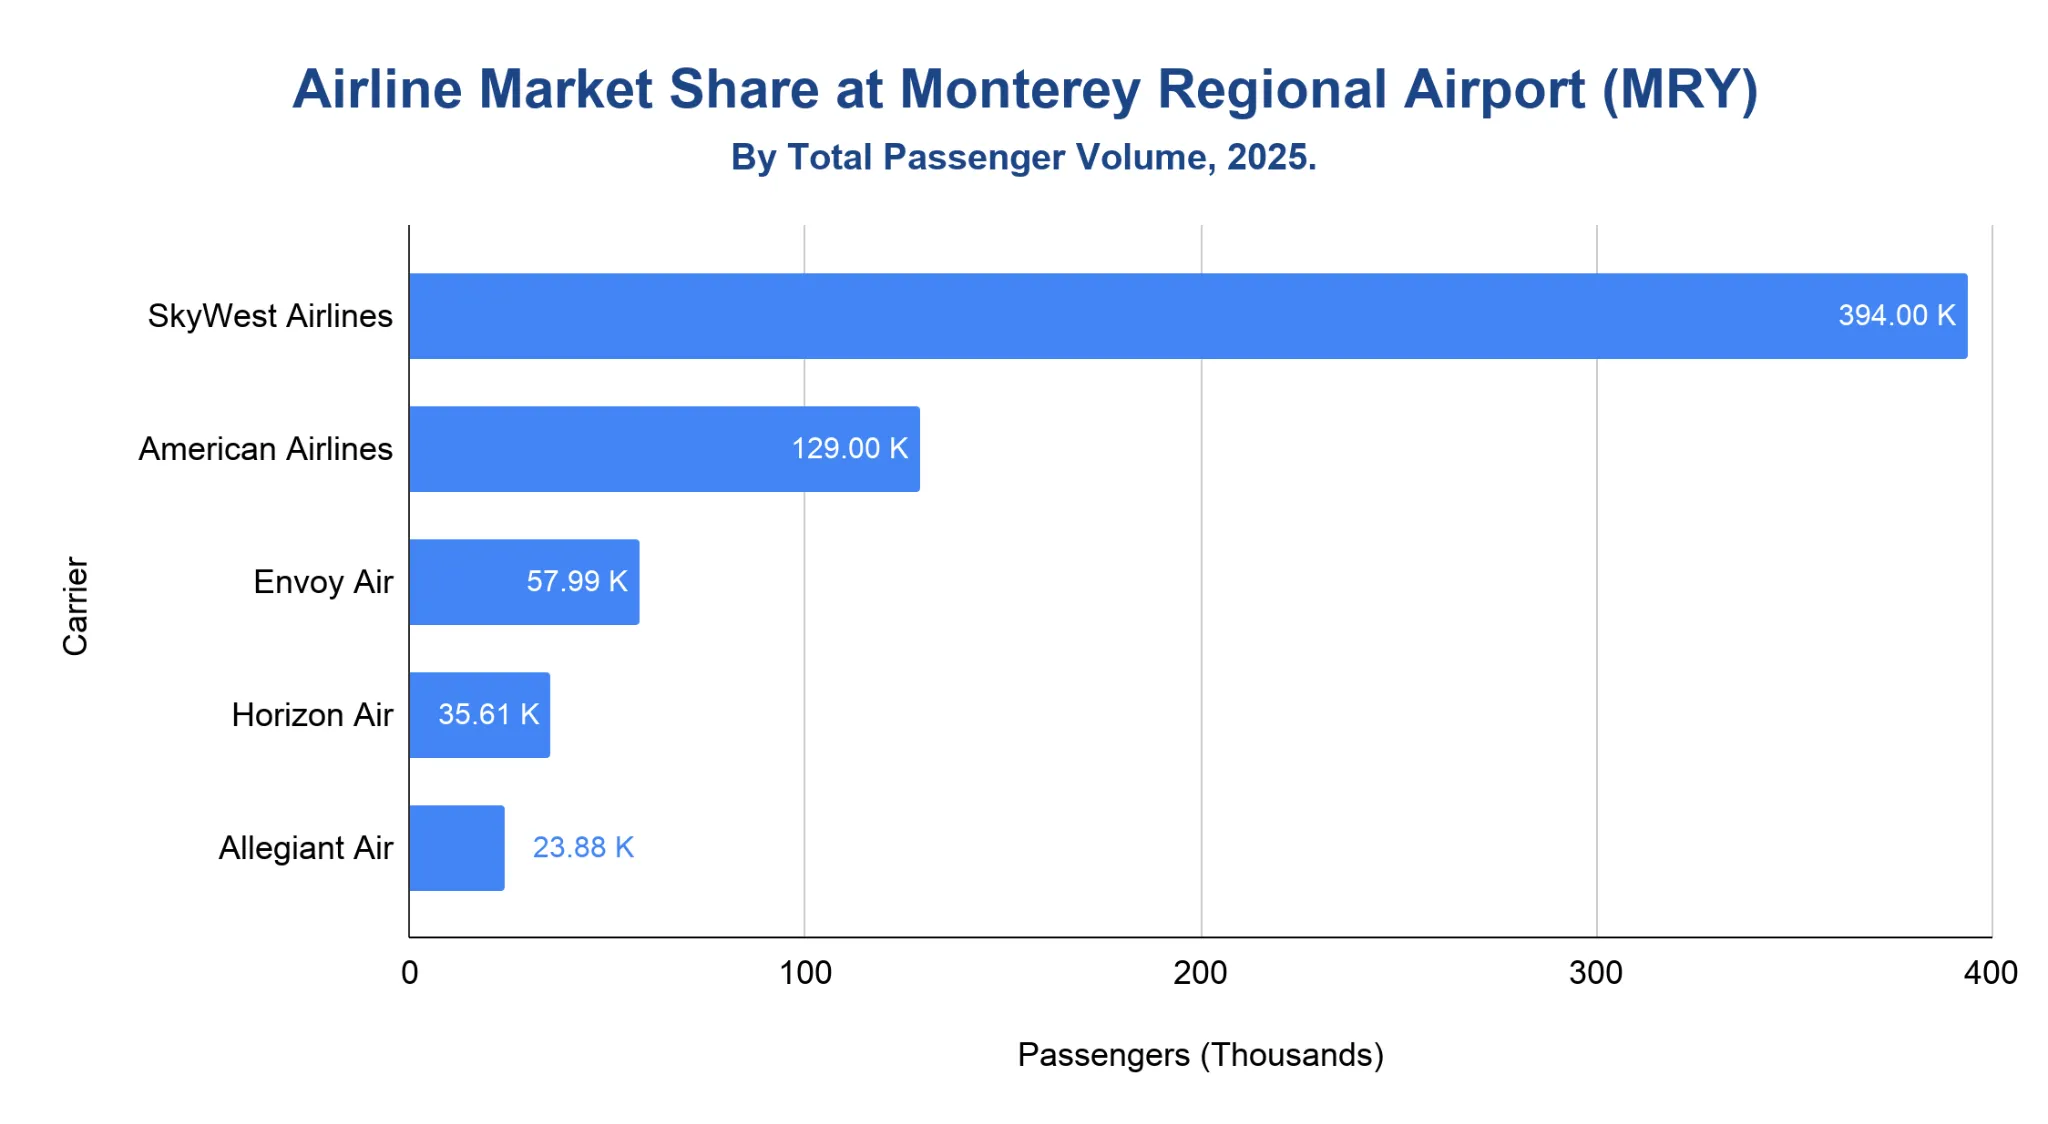
Bureau of Transportation Statistics (BTS) data shows SkyWest Airlines carried the largest share of MRY passengers in 2025.
- SkyWest Airlines led MRY’s carrier market with 394,000 passengers, or 61.56% of the reported carrier market.
- American Airlines was the largest mainline carrier in the table, carrying 129,000 passengers and accounting for 20.09% of the market.
- Envoy Air added 57,990 passengers, reflecting American’s regional service presence at MRY.
- Horizon Air carried 35,610 passengers, while Allegiant Air handled 23,880 passengers.
Note: BTS carrier-share tables may list regional operating carriers separately from the branded airline shown to passengers.
What are the most popular destinations from Monterey Regional Airport?
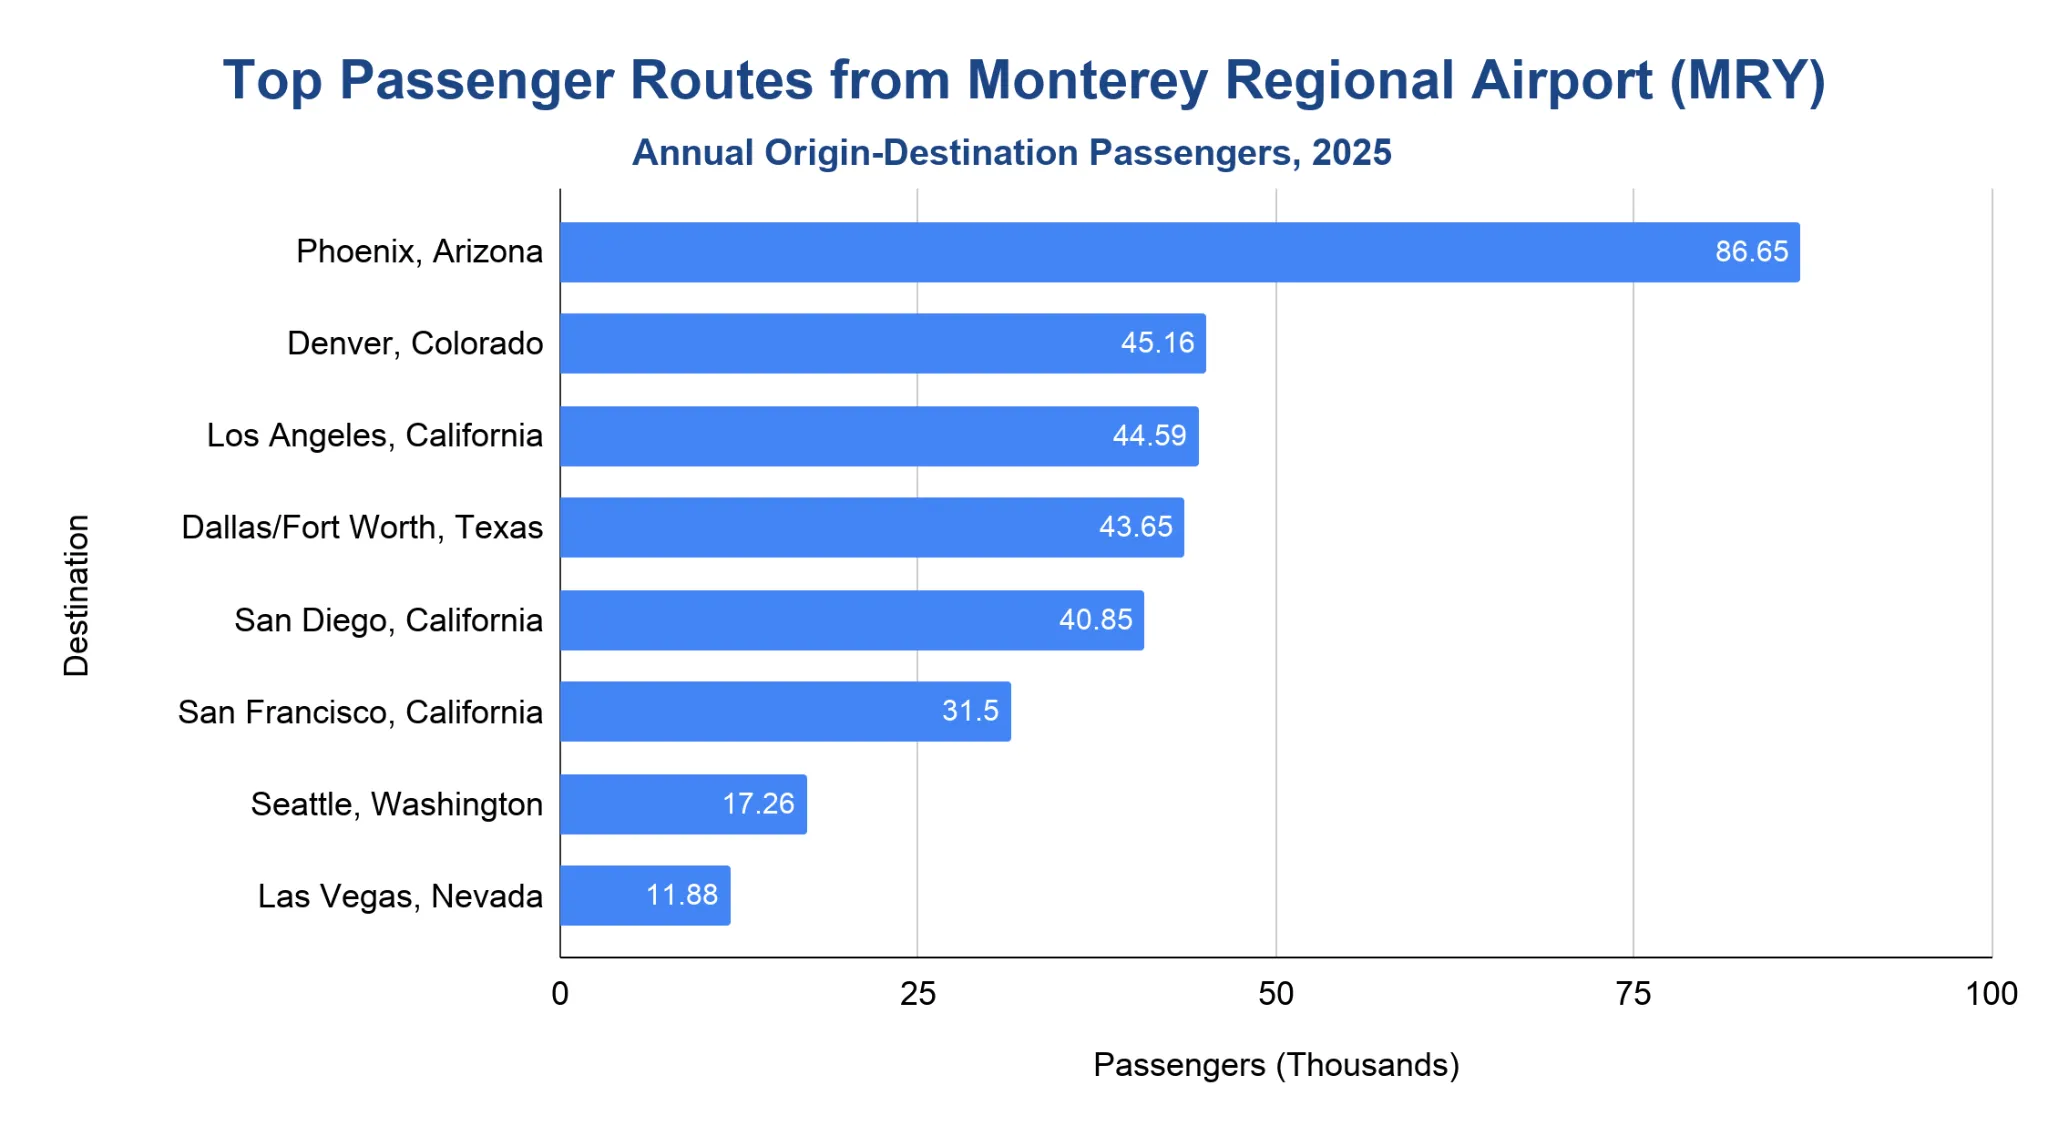
Phoenix was MRY’s busiest listed domestic route in 2025, with 86,650 passengers.
- Phoenix ranked first among listed domestic routes from MRY, with American serving the market.
- Denver and Los Angeles formed the next tier, with 45,160 and 44,590 passengers, respectively.
- Dallas/Fort Worth followed closely at 43,650 passengers, also served by American.
- San Diego, San Francisco and Seattle rounded out the main West Coast and hub markets.
- Las Vegas was the smallest listed top destination, with 11,880 passengers on Allegiant.
Note: BTS route tables report passengers by market and carrier. They should not be blended with total airport passenger counts unless the metric and period match.
Busiest Travel Months at Monterey Regional Airport
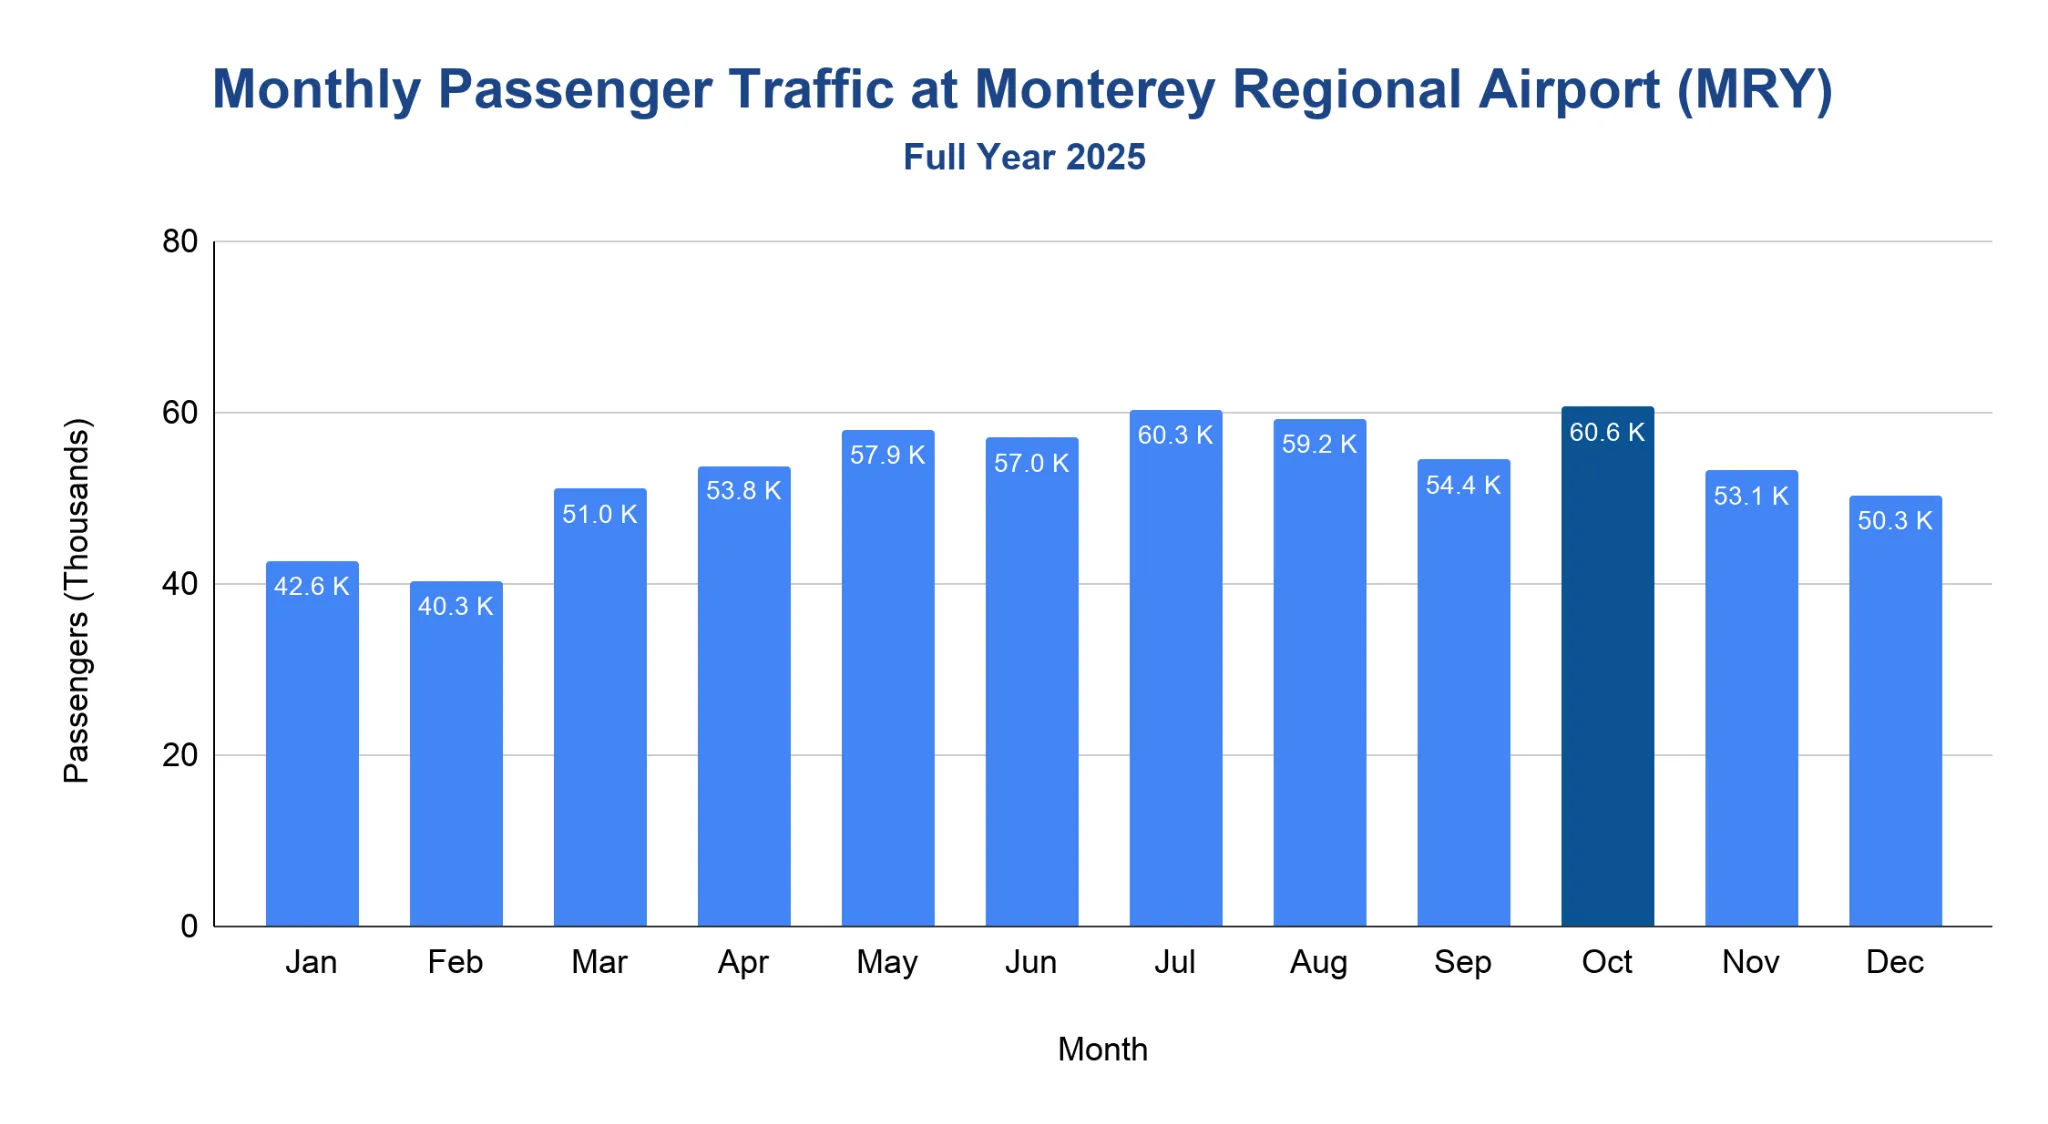
October was MRY’s busiest travel month in 2025, with a calculated 60,607 origin-and-destination passengers.
- Traffic was lowest early in the year, with 42,619 passengers in January and 40,277 in February.
- Spring demand strengthened, rising from 51,016 passengers in March to 57,895 in May.
- Summer stayed busy, with 60,284 passengers in July and 59,200 in August.
- October was the peak month, reaching 60,607 passengers.
- Late-year traffic eased to 53,129 passengers in November and 50,285 in December.
Note: BTS origin passengers represent trips beginning at MRY, while destination passengers represent trips ending at the airport. The total is calculated by adding the two directions for each month in 2025.
How much revenue does Monterey Regional Airport generate?
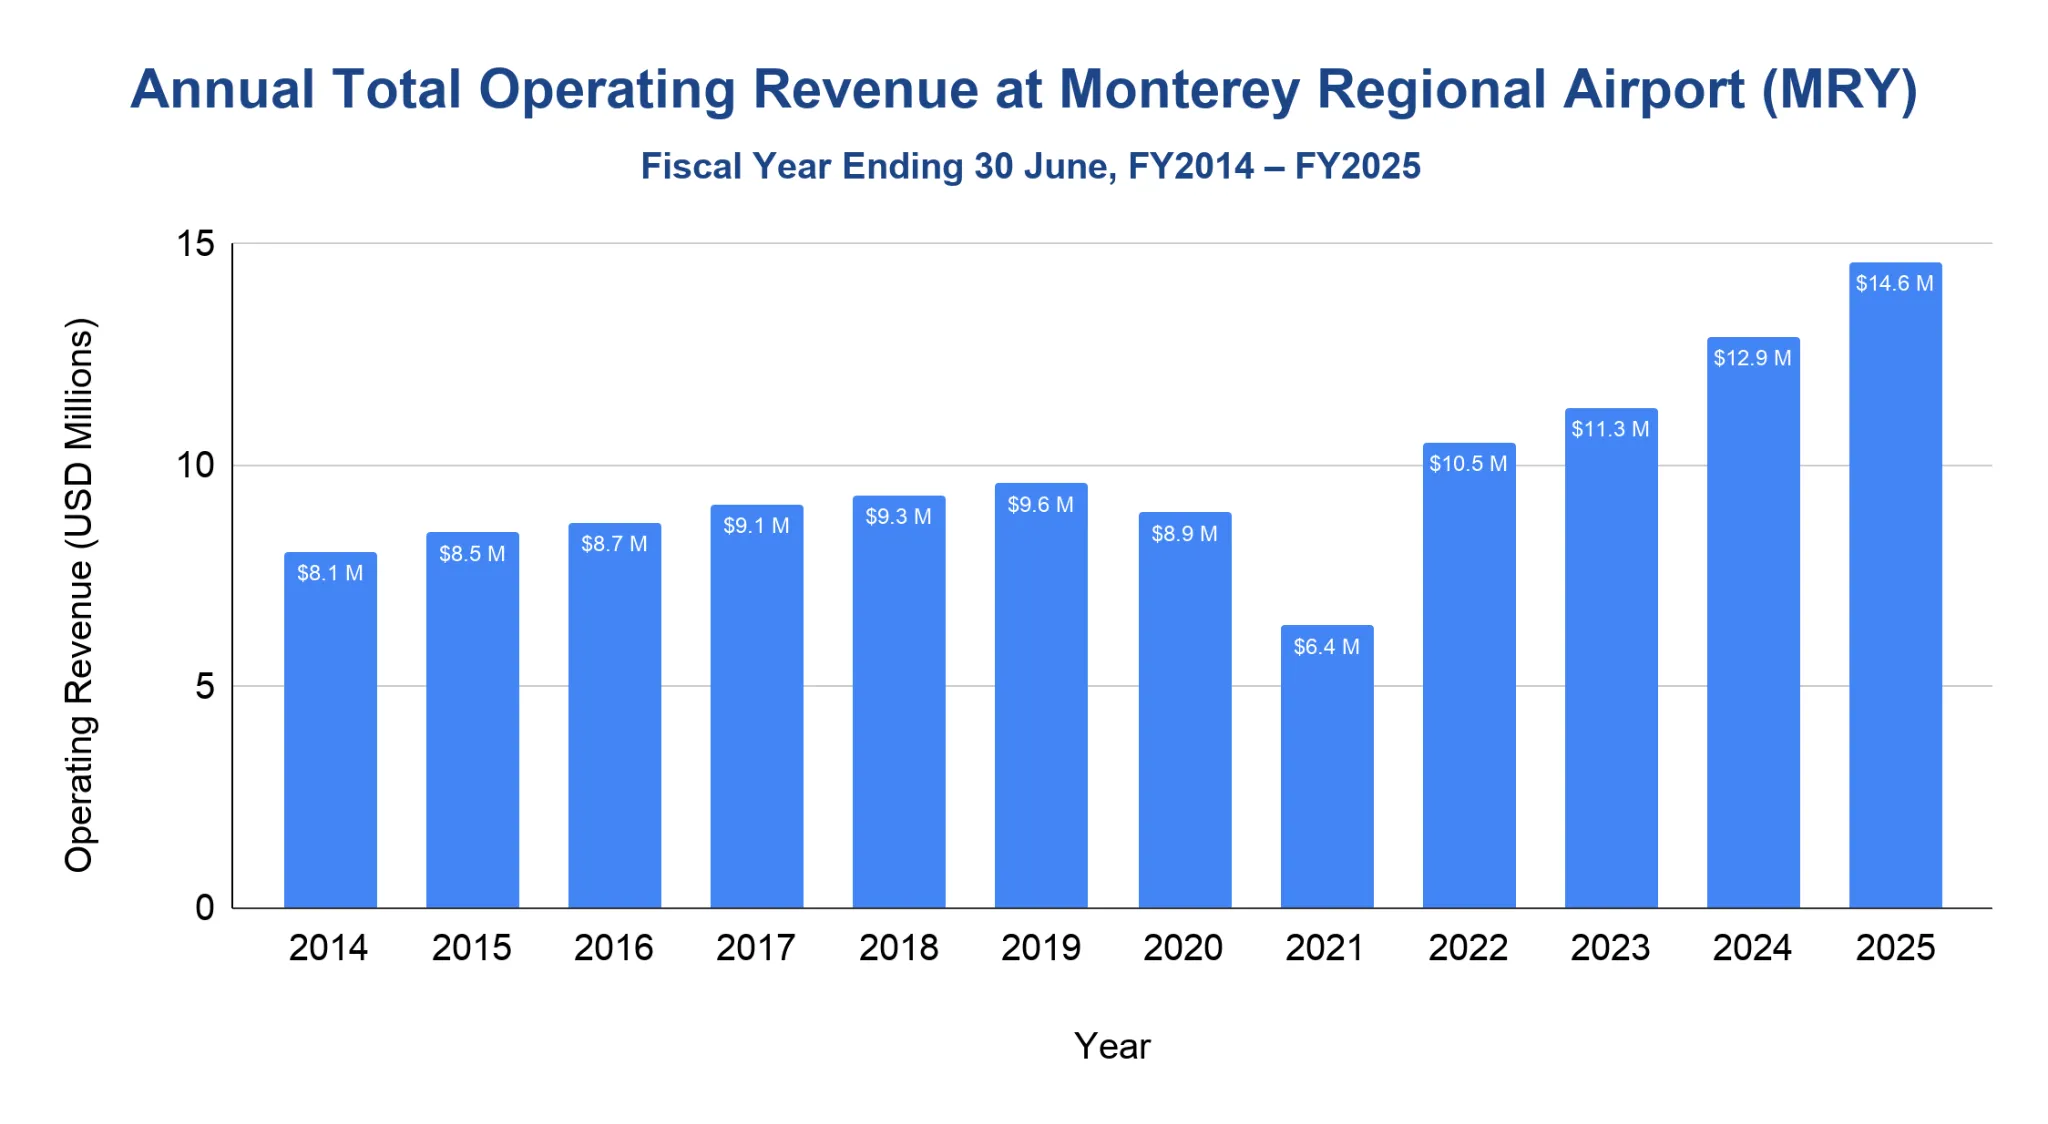
MRY generated $14.58 million in total operating revenue in FY2025.
- From FY2014 to FY2018, total operating revenue rose steadily from $8.05 million to $9.32 million.
- Pre-pandemic revenue reached $9.59 million in FY2019.
- Revenue declined during the pandemic period, falling to $8.92 million in FY2020 and $6.38 million in FY2021.
- The recovery was sharp in FY2022, when revenue climbed to $10.52 million.
- Revenue continued rising through FY2025, reaching $14.58 million, up 13.1% from FY2024.
Note: Figures are from FAA Compliance Activity Tracking System (CATS) Form 127 total operating revenue. Fiscal years are shown by year ending, with each fiscal year ending 30 June.
Monterey Regional Airport’s On-time Performance
MRY flights by major U.S. carriers were 83% on time for departures and 79% on time for arrivals in the latest reported period.
- Departure on-time performance stayed at 83% from 2021 through 2024, improved to 84% in 2025, and returned to 83% for the May 2025–April 2026 period.
- Arrival on-time performance ranged from 79% to 81% across the series, ending at 79% in the latest reported period.
- Average delay among delayed flights was 95.87 minutes for departures and 71.33 minutes for arrivals in the May 2025–April 2026 period.
- The cancellation rate was 1.15% in the latest period, compared with 1.77% in 2021 and 0.90% in 2024.
- Reporting carrier count stayed between 4 and 5 carriers across the series.
| Metric | 2021 | 2022 | 2023 | 2024 | 2025 | 2026* |
|---|---|---|---|---|---|---|
| On-Time Departures | 83% | 83% | 83% | 83% | 84% | 83% |
| On-Time Arrivals | 79% | 81% | 80% | 79% | 79% | 79% |
| Average Departure Delay (Min.) | 87.56 | 97.93 | 99.52 | 97.07 | 94.16 | 95.87 |
| Average Arrival Delay (Min.) | 70.76 | 69.12 | 72.35 | 64.7 | 69.17 | 71.33 |
| Cancelled Flights | 1.77% | 0.99% | 0.96% | 0.90% | 1.05% | 1.15% |
| Total Flights (000's) | 3.67 | 4.13 | 3.96 | 4.69 | 4.87 | 3.22 |
| Reporting Carriers | 5 | 5 | 4 | 4 | 4 | 5 |
Source · Note: This table covers domestic flights by major U.S. carriers only. A flight is considered delayed when it arrives or departs 15 minutes or more after schedule, and average delay minutes are calculated from delayed flights only. The 2026 column covers May 2025 through April 2026. BTS publishes average delays in decimal-minute format. As such, the values have been kept exactly as reported to avoid altering the underlying data.
Related Travel Statistics
- Albuquerque International Sunport Statistics
- Atlantic City International Airport Statistics
- Birmingham Airport (BHM) Statistics
- Buffalo Airport (BUF) Statistics
- Cincinnati Airport (CVG) Statistics
- Denver International Airport Statistics
- George Bush Airport (IAH) Statistics
- Grand Rapids Airport (GRR) Statistics
- Myrtle Beach Airport (MYR) Statistics
- Newark Airport (EWR) Statistics
- Westchester County Airport (HPN) Statistics
- Wichita Airport (ICT) Statistics
How does Monterey Regional Airport rank nationally?
FAA ranked MRY 171st among U.S. commercial service airports in 2024.
- MRY recorded 305,434 commercial passenger enplanements in 2024.
- FAA classified the airport as a primary, non-hub commercial service airport in the 2024 passenger boarding dataset.
- The airport covers 507 acres and has 2 parallel runways.
- Its primary runway measures 7,175 feet by 150 feet, while the secondary runway measures 3,503 feet by 60 feet.
Note: FAA commercial-service rankings are based on passenger boardings, or enplanements, not total passengers.
References
- Monterey Regional Airport — Annual Comprehensive Financial Report (FY2024) · montereyairport.specialdistrict.org
- FAA Passenger Boarding and All-Cargo Data Master · faa.gov
- Monterey Regional Airport — Official Airport Website · montereyairport.com
- FAA OPSNET — Airport Operations Report (Jan 2014–Apr 2026) · aspm.faa.gov
- Bureau of Transportation Statistics Airport Summary Database (2016–2025) · transtats.bts.gov
- FAA CATS — Form 127 Operating and Financial Summary (FY2014–FY2025) · cats.airports.faa.gov

