

 Popular Countries
 24/7 Support
Published
Arizona continues to rank among the top tourism destinations in the United States, showing strong post-pandemic recovery and record-setting performance. Its wide range of natural landmarks, resorts and cultural sites draws millions of visitors each year.
How many people visit Arizona each year?
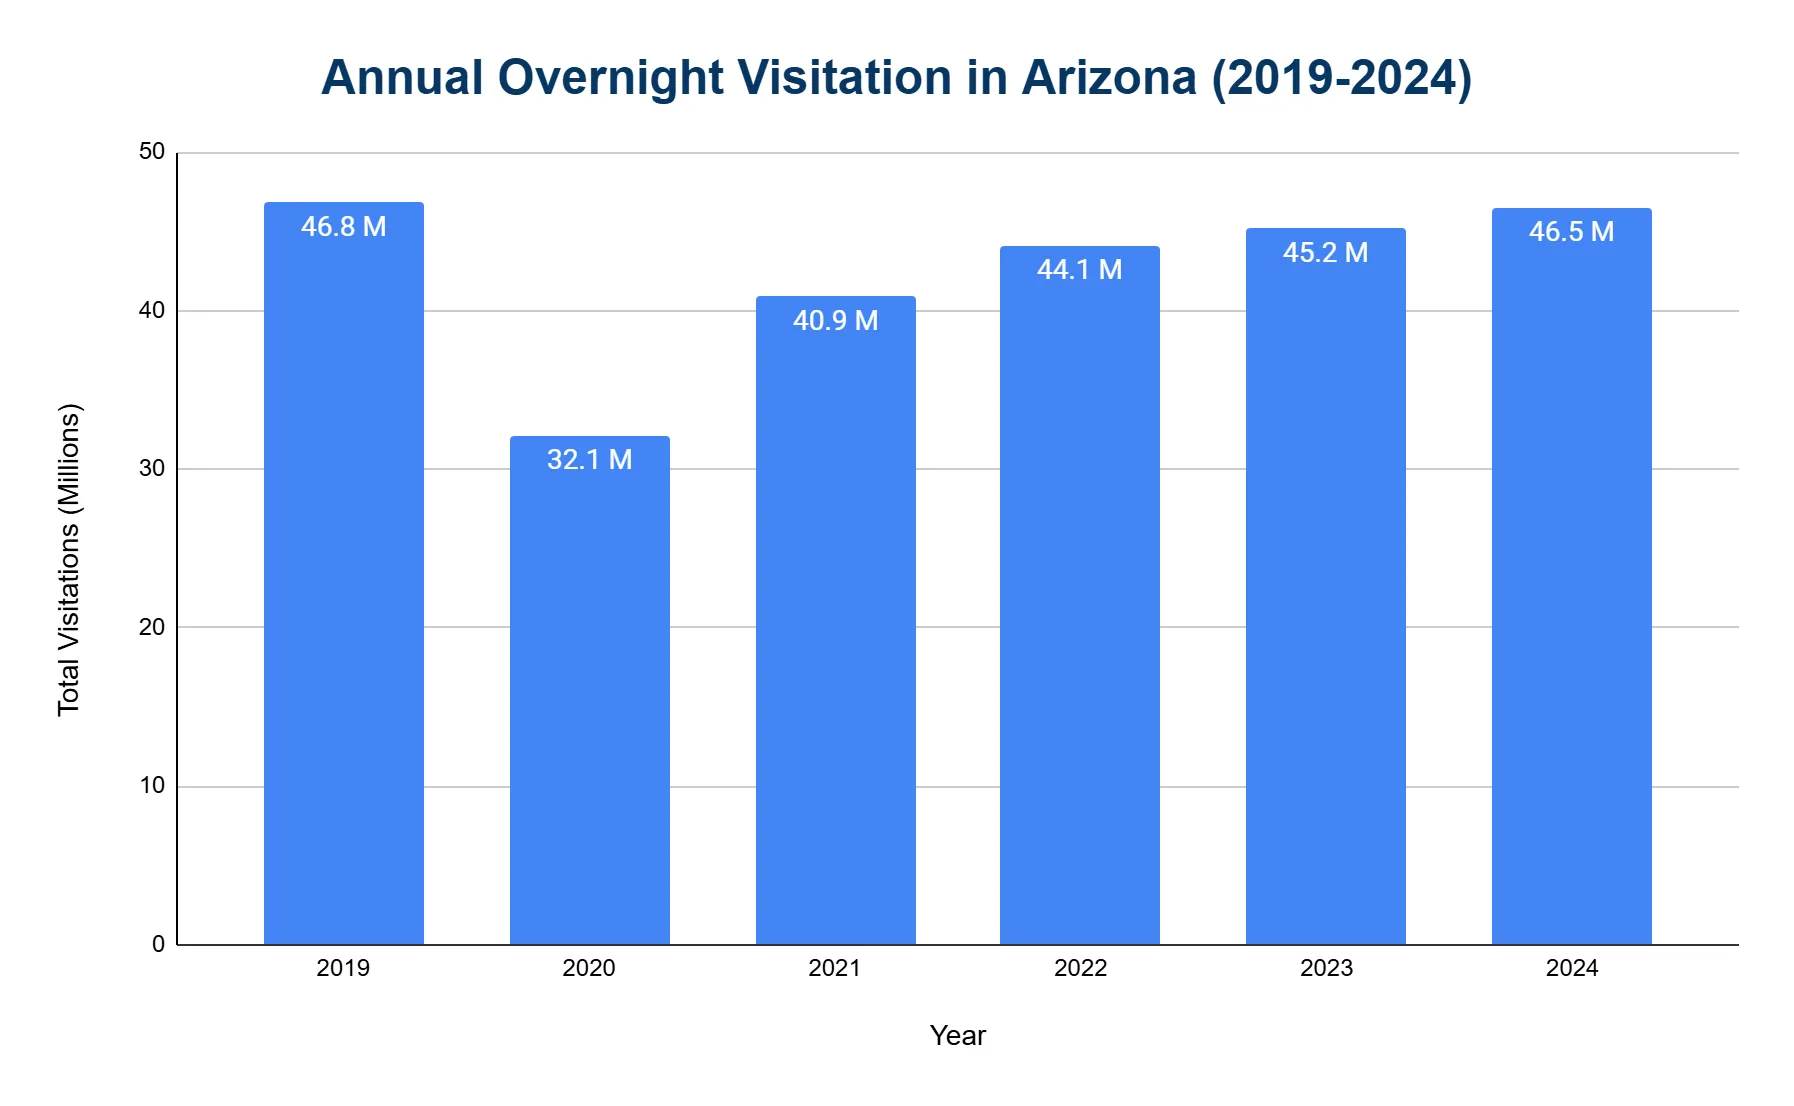
Arizona receives over 45 million overnight visitors annually, making it a leading tourism hub in the American Southwest.
- The state welcomed 46.5 million overnight visitors in 2024, a 2.9% increase from 2023.
- In 2019, before the pandemic, Arizona saw 46.8 million overnight visitors.
- 2020 brought a steep drop to 32.1 million, due to global travel restrictions.
- A rebound began in 2021 with 40.9 million visitors, about 87% of 2019 levels.
- Visitation further increased to 44.1 million in 2022.
- By 2023, visits had climbed to 45.2 million, nearing full recovery.
How many people visited Arizona in 2024?
- Arizona saw a post-pandemic high of 46.5 million overnight visitors in 2024, nearing the record levels set in 2019.
- This was a 2.9% rise over 2023 and nearly matched pre-pandemic levels.
- Domestic overnight visitors made up the majority, totaling 41.16 million.
How many people visited Arizona in 2023?
- Arizona recorded 45.2 million overnight visitors in 2023, showing a strong return to near pre-pandemic volumes.
- Domestic visitors accounted for 40.88 million of the total.
How many people visit Arizona each day?
- Arizona averaged around 127,400 overnight visitors per day in 2024, reflecting its appeal as a year-round destination.
- During peak winter months (December through March), daily numbers often rose, especially in southern cities like Phoenix and Scottsdale.
How much do visitors spend each year?
Tourism is Arizona’s largest export industry, generating more than $25 billion annually.
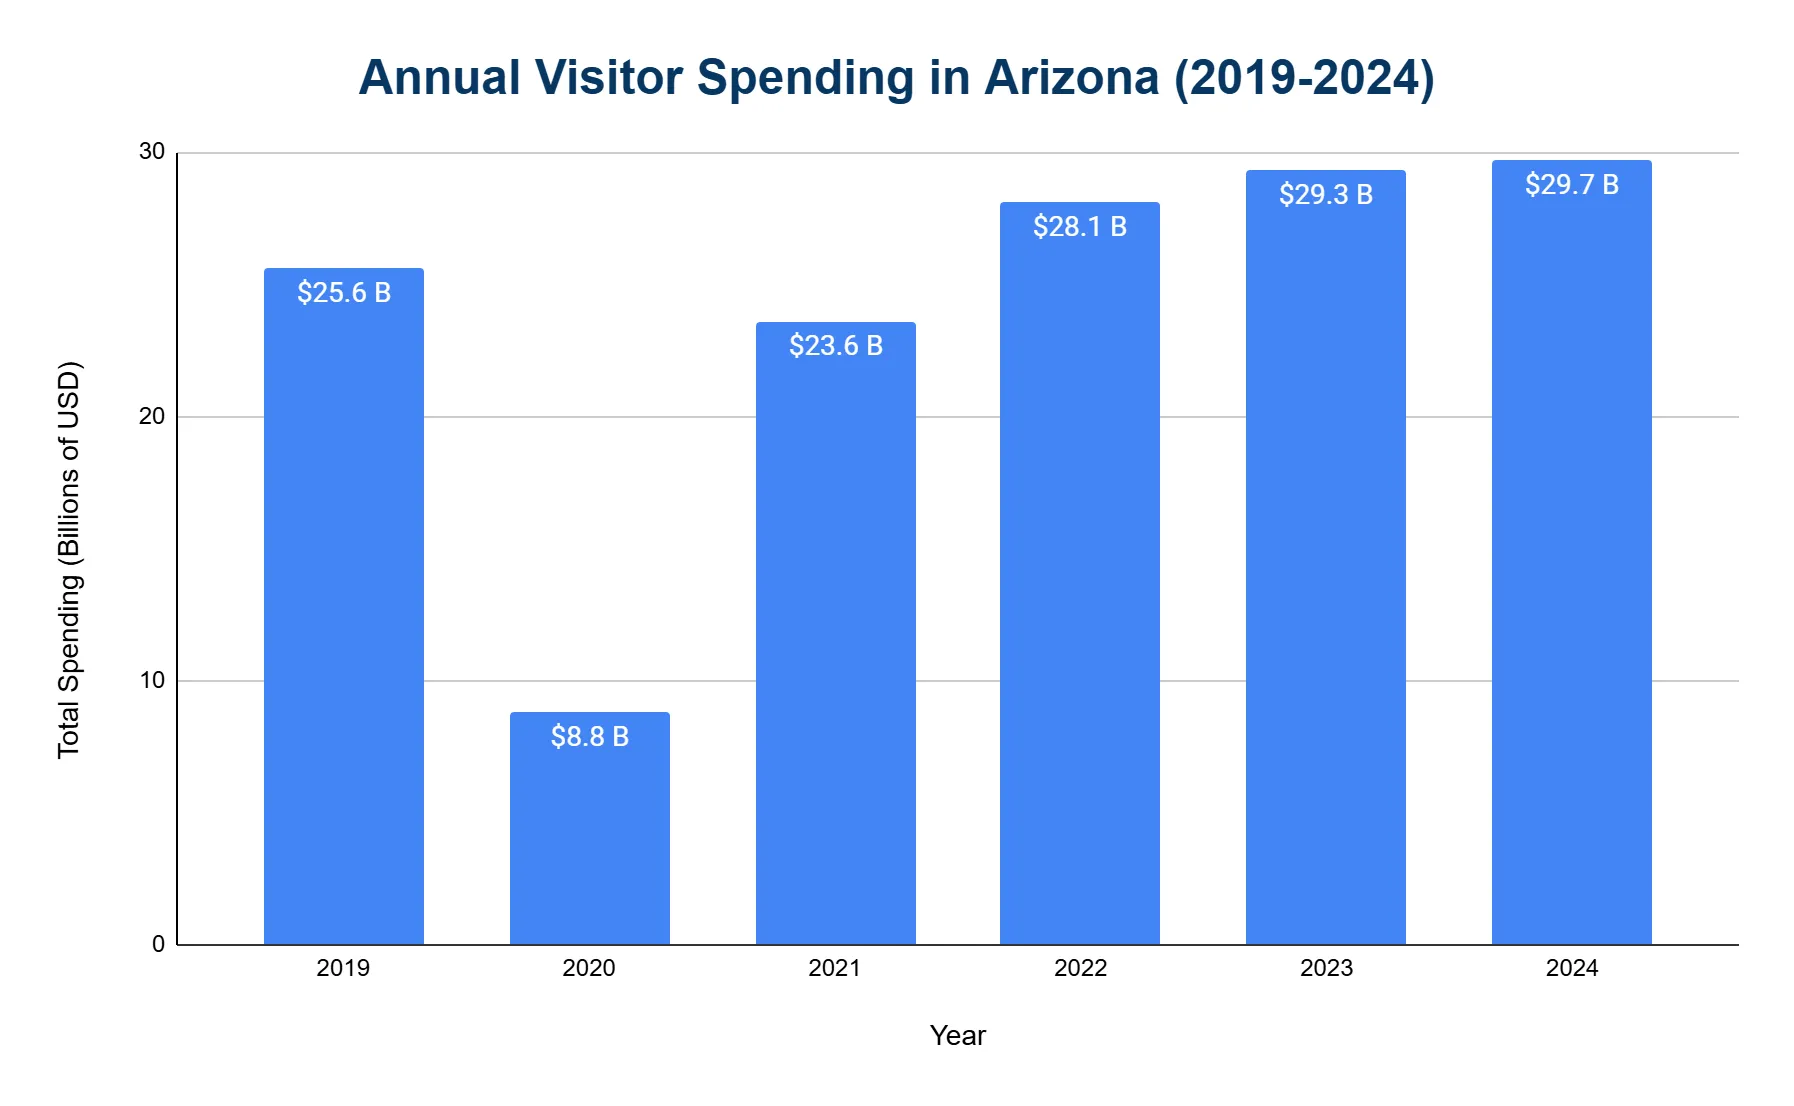
- In 2024, visitor spending hit a record $29.7 billion, up 1.4% from 2023.
- In 2019, spending was $25.6 billion.
- It dropped to $8.8 billion in 2020 due to COVID-19 impacts.
- A recovery started in 2021 with $23.6 billion, or 92% of 2019 levels.
- 2022 saw further growth to $28.1 billion.
- Spending reached $29.3 billion in 2023, reinforcing the sector’s economic strength.
How much did visitors spend in 2024?
- Tourists spent a record $29.7 billion in Arizona in 2024, setting a new high for tourism’s economic impact.
- Daily visitor spending averaged $81 million, up from $80 million in 2023.
How much did visitors spend in 2023?
- Visitors spent $29.3 billion in Arizona in 2023, a 4.3% increase over 2022.
- This marked the first time spending exceeded pre-pandemic levels.
Who spends most in Arizona?
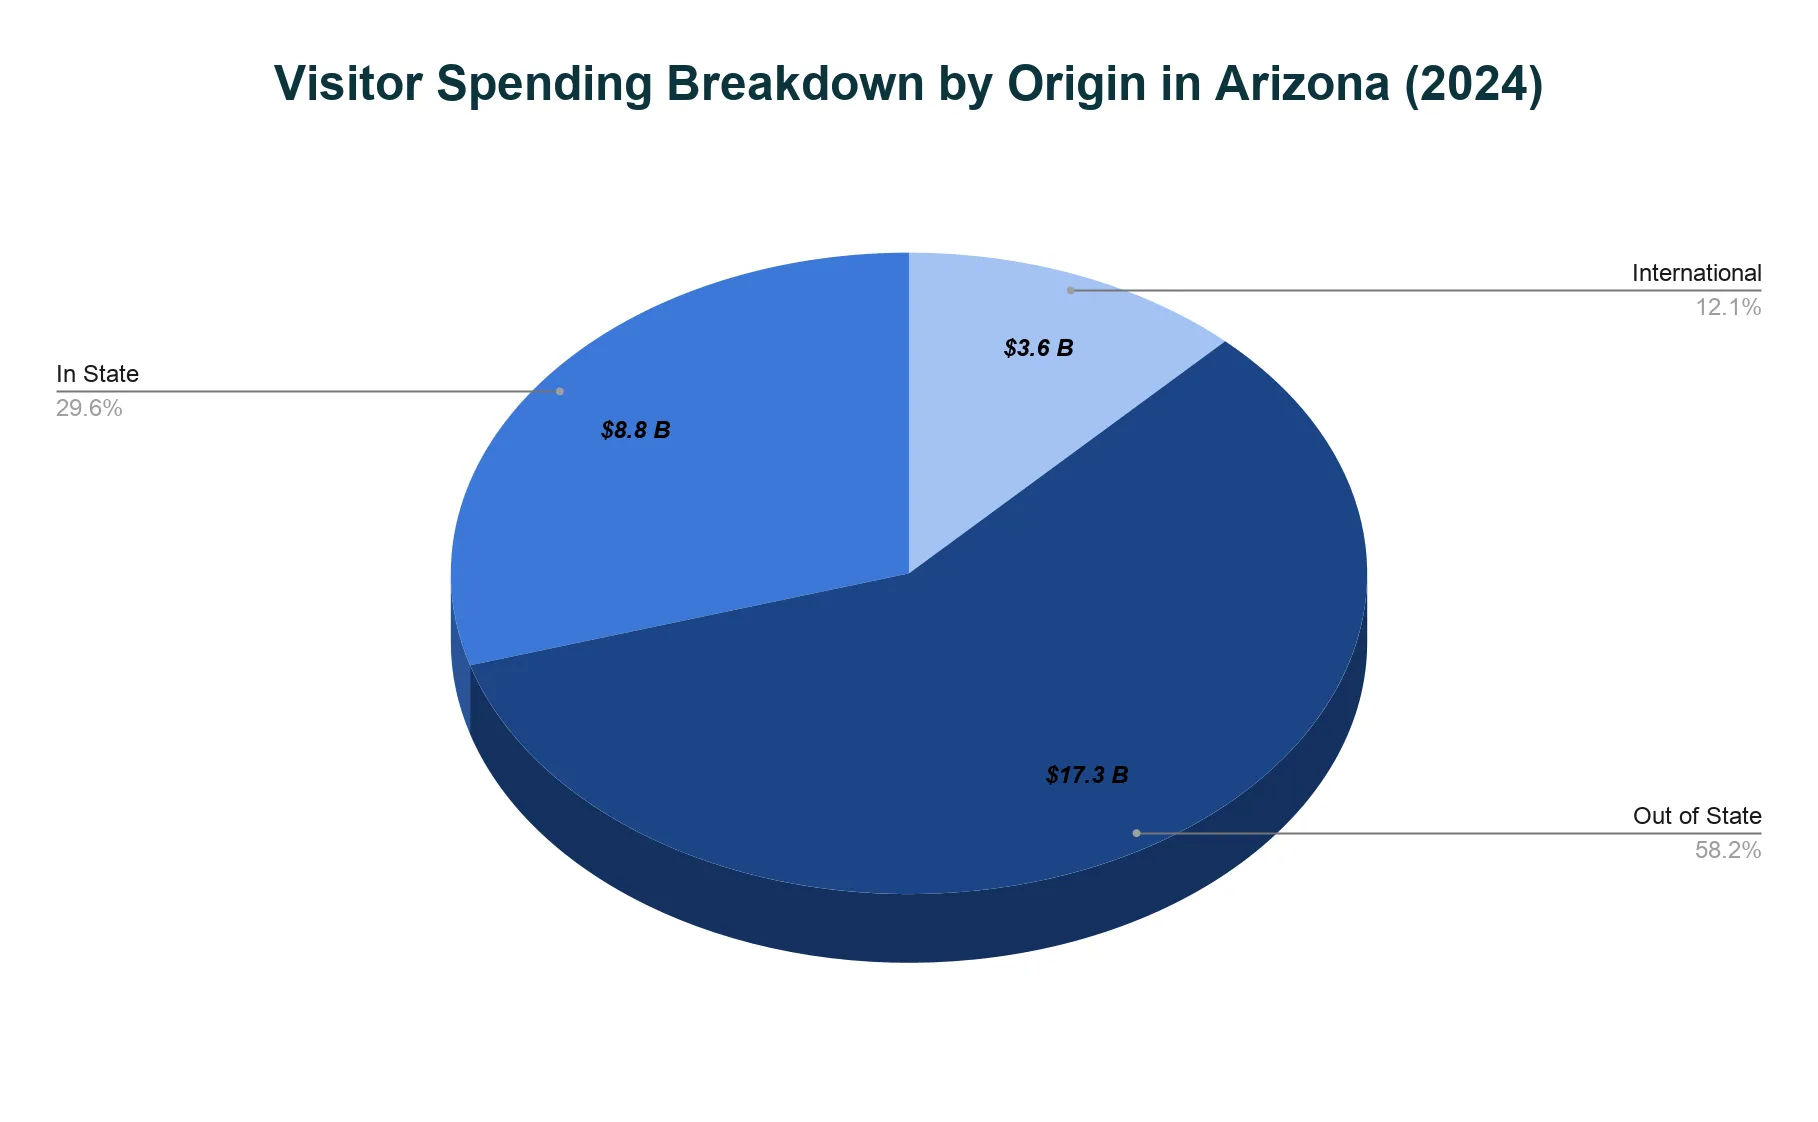
- Out-of-state visitors contributed the most with $17.3 billion (58.2%)
- In-state residents spent $8.8 billion (29.6%)
- International visitors spent $3.6 billion (12.1%)
Visitor Spending Breakdown
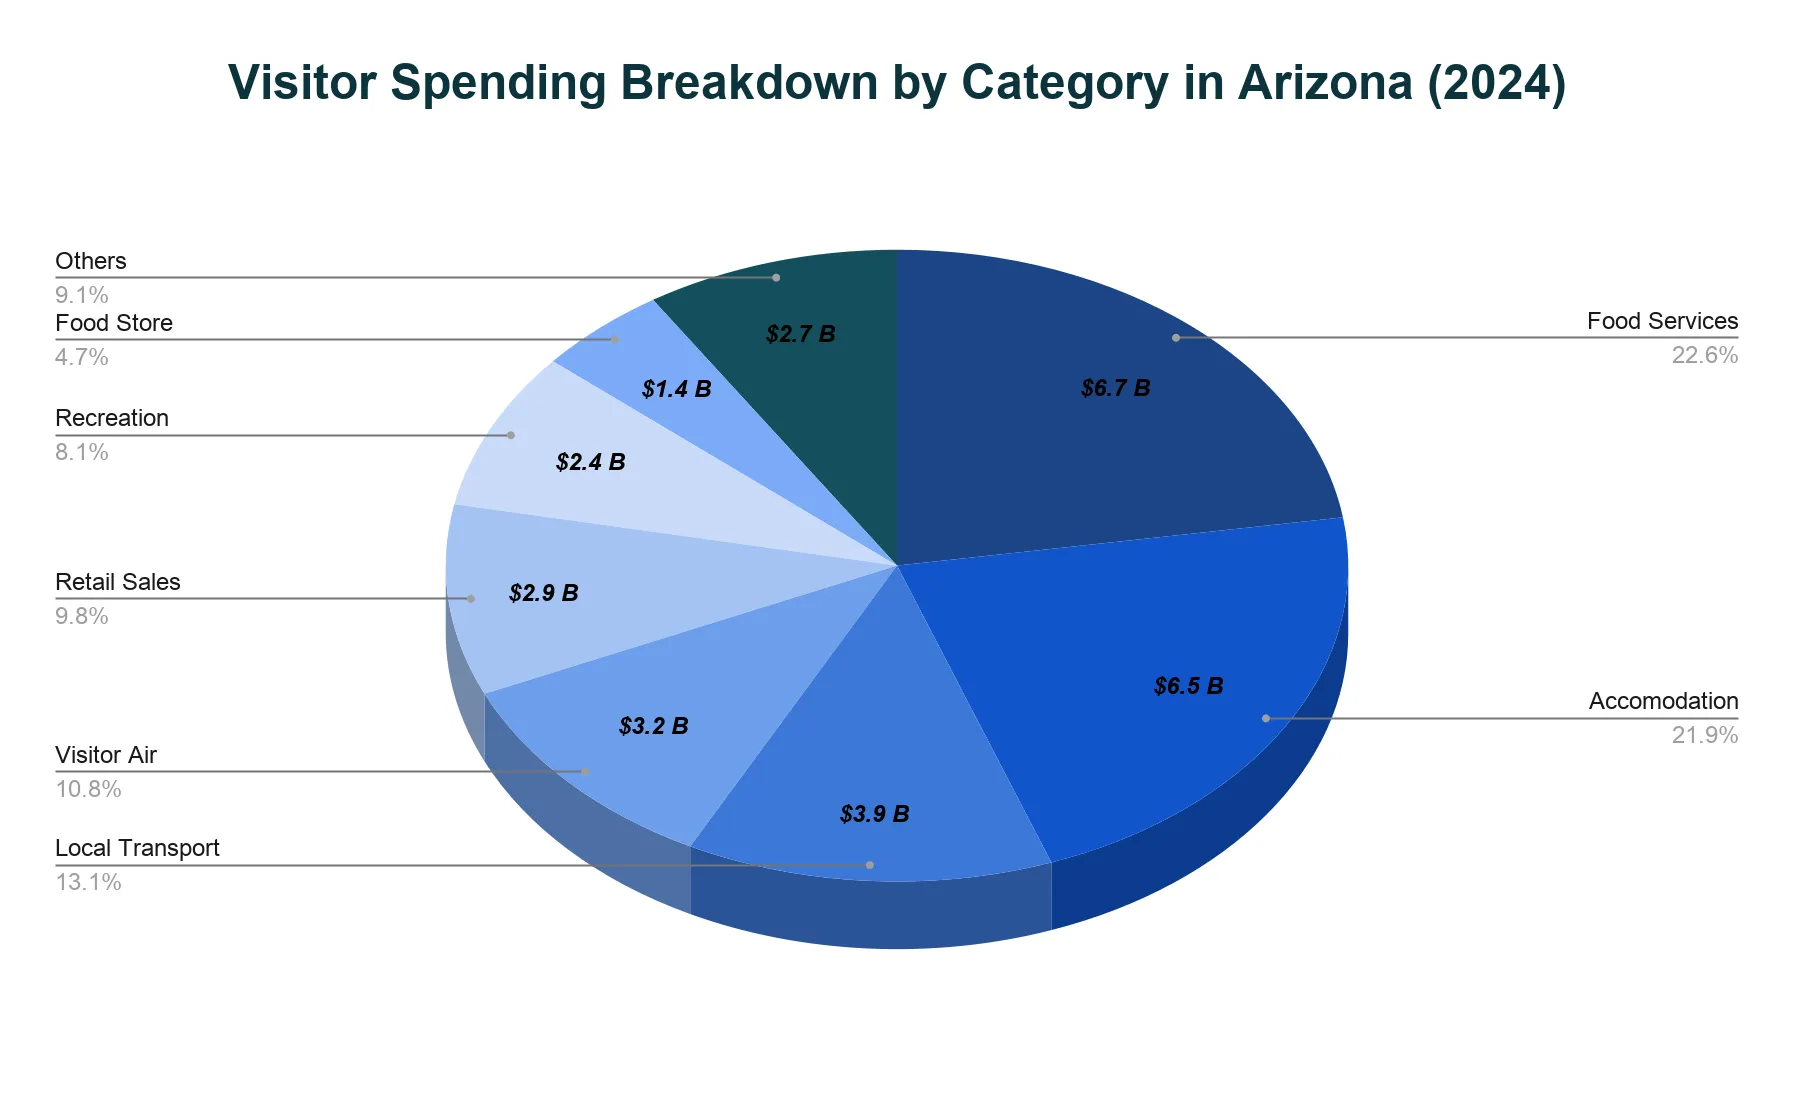
- Food services represented the largest share of visitor spending in Arizona at $6.7 billion (22.6%).
- Accommodation was the second largest at $6.5 billion (21.9%).
- Local transport accounted for $3.9 billion (13.1%).
- Retail spending reached $3.2 billion (10.8%), while recreation contributed $2.9 billion (9.8%).
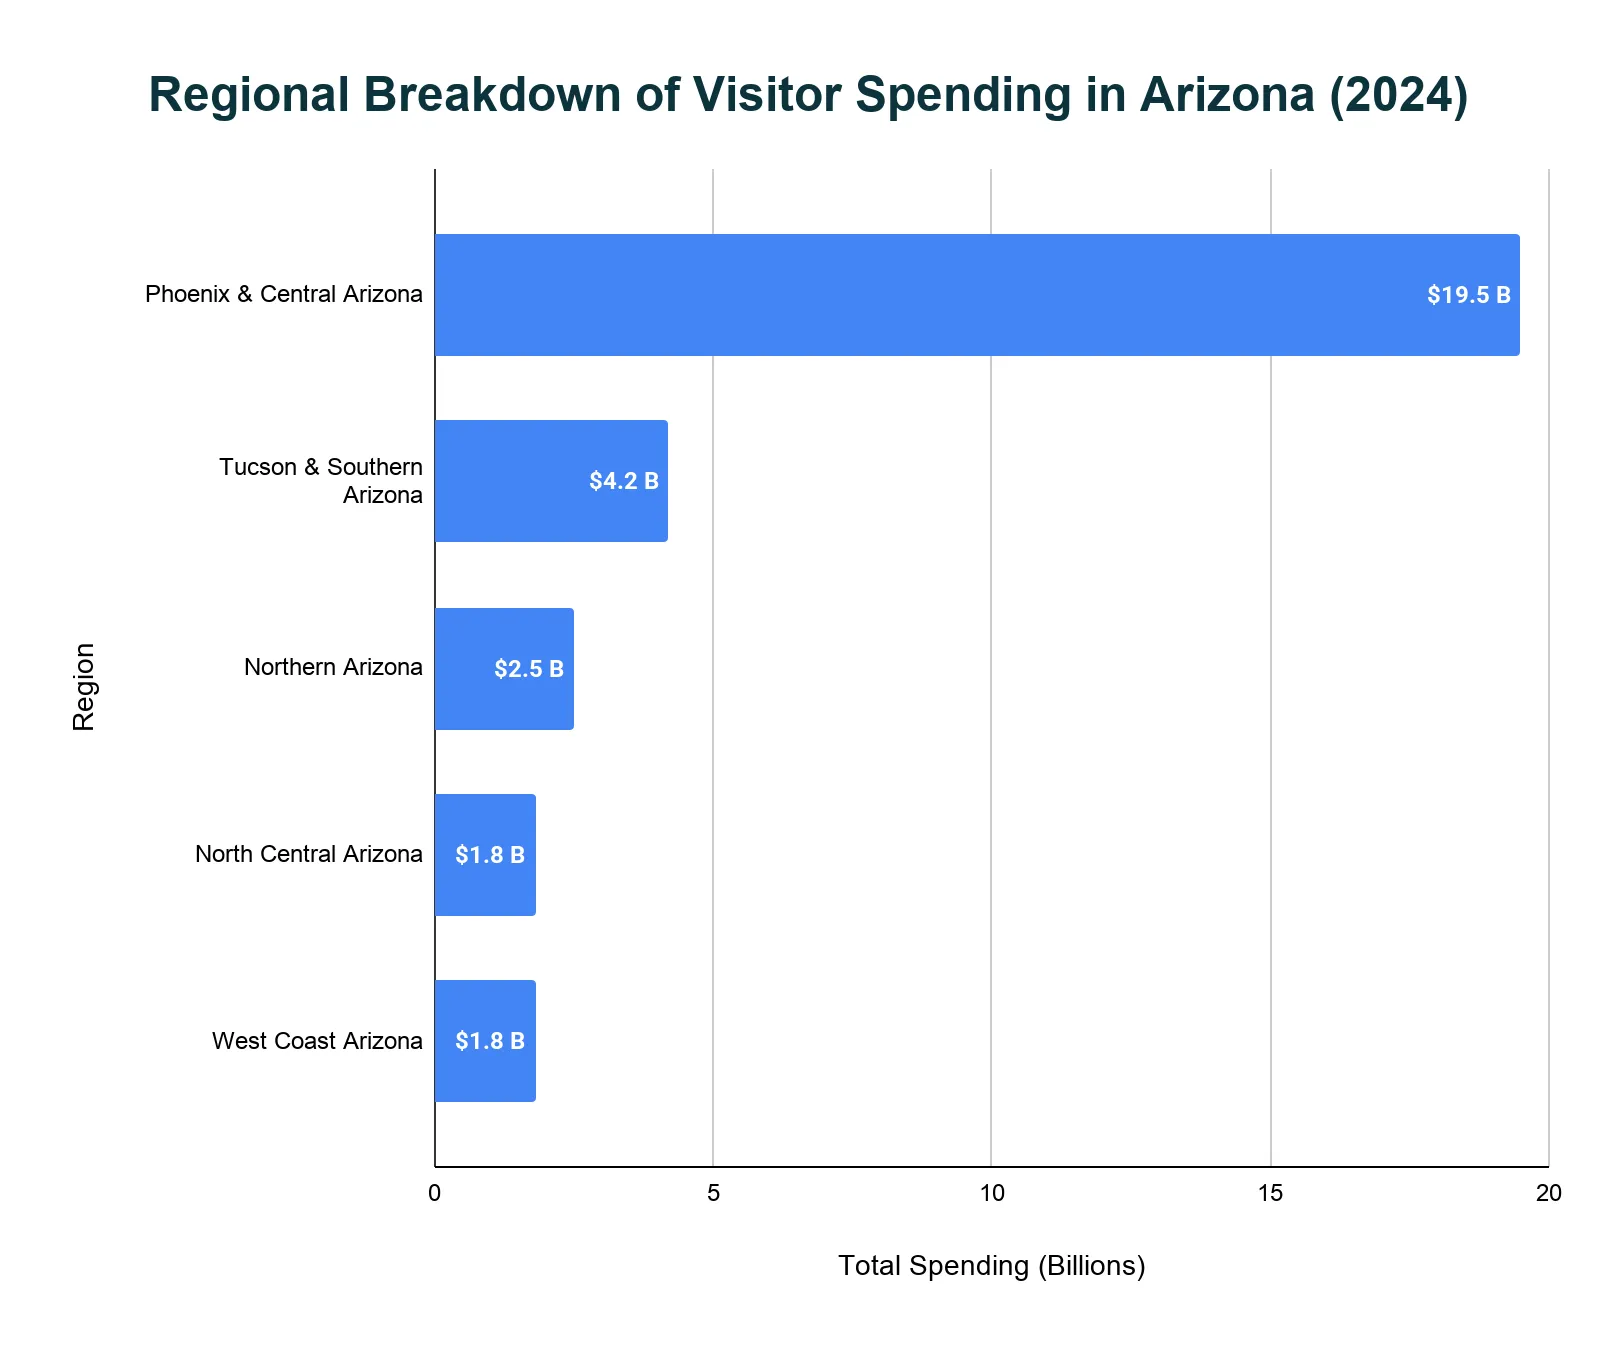
How much do visitors spend across different regions of Arizona?
- The Phoenix and Central Arizona region led in visitor spending with approximately $19.5 billion.
- Tucson and Southern Arizona followed, seeing around $4.2 billion in spending.
- Northern Arizona visitors contributed about $2.5 billion.
- Both North Central Arizona and West Coast Arizona each accounted for $1.8 billion in travel spending.
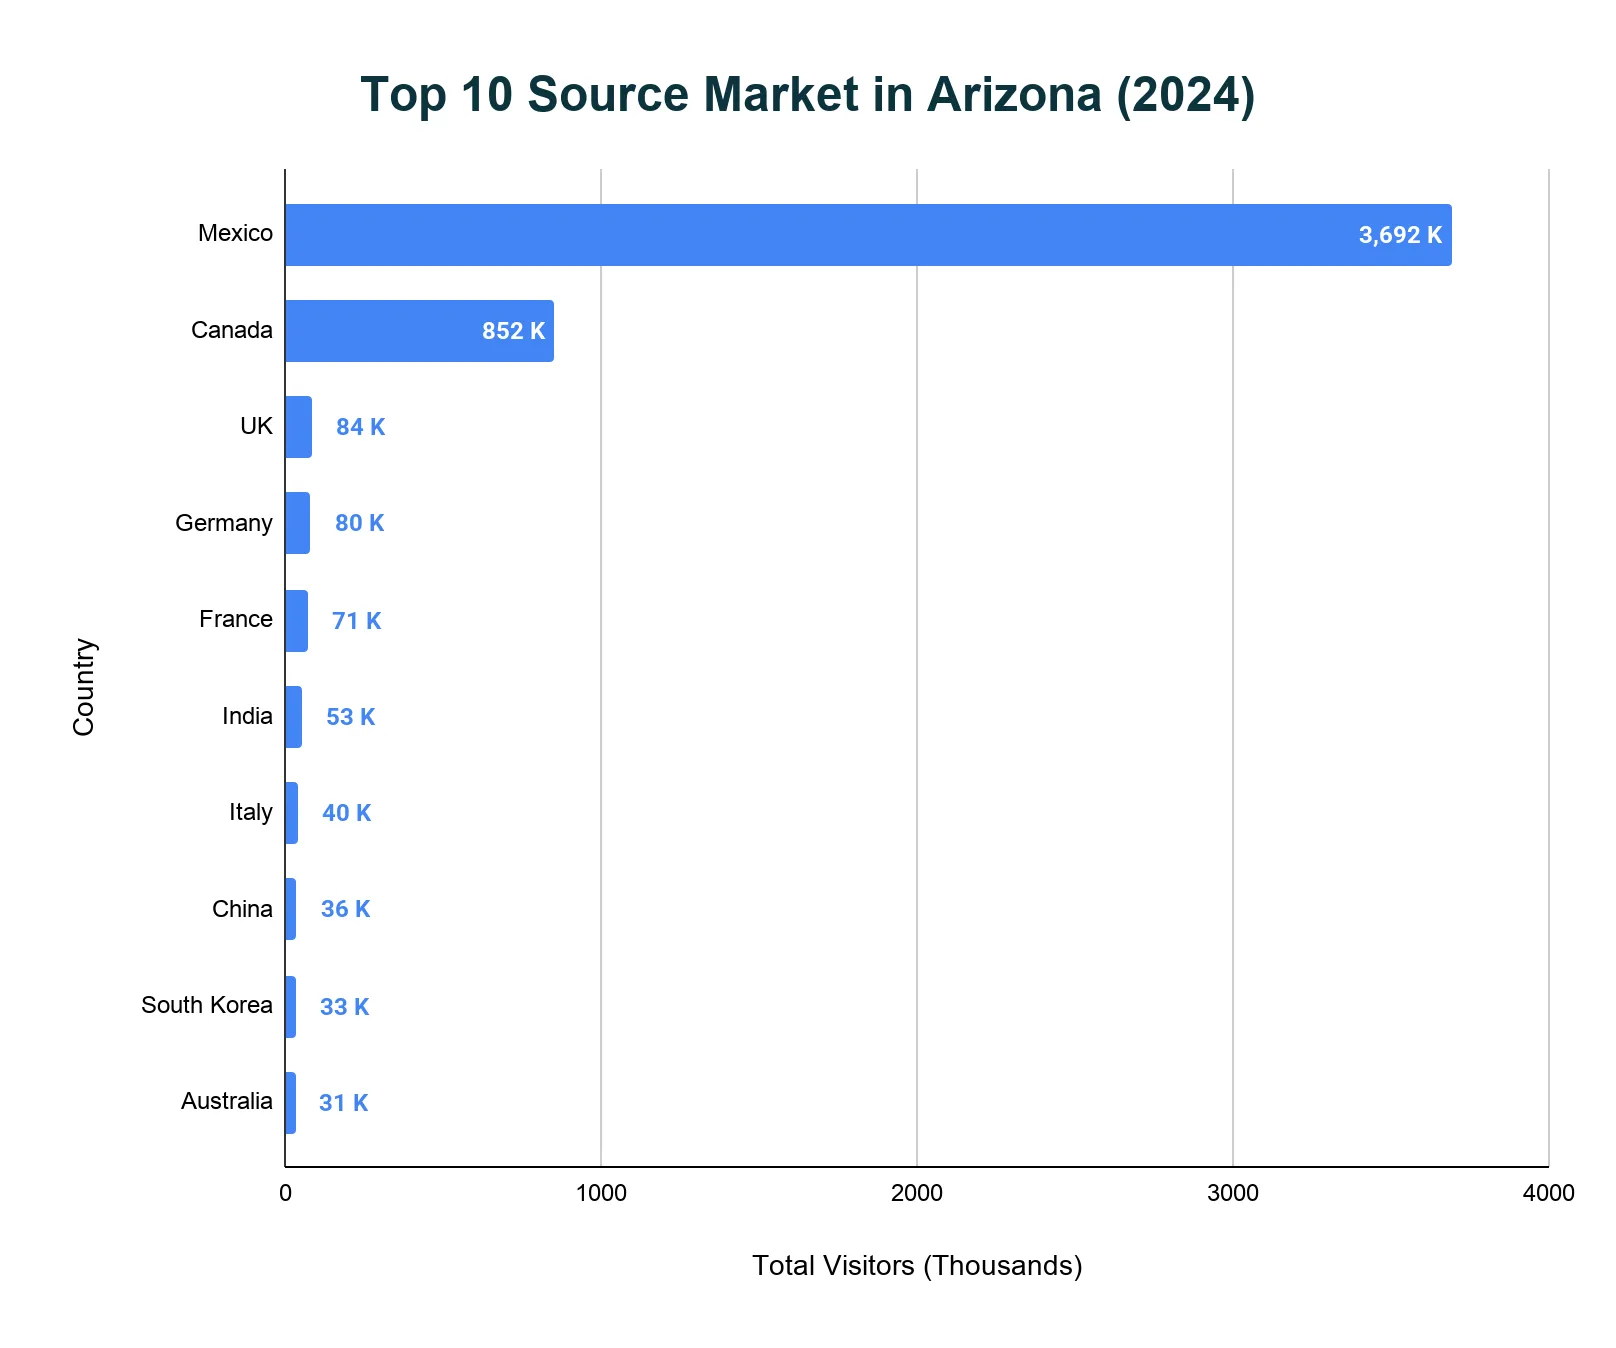
Which countries visit Arizona the most?
Arizona's international visitor base is dominated by its North American neighbors, followed by key markets in Europe and Asia.
- Mexico was by far the largest international market in 2024 with nearly 3.69 million visitors.
- Canada ranked second with approximately 852,000 visitors in 2024.
- The United Kingdom contributed 84,000 visitors in 2024.
- Germany sent 80,000 visitors to Arizona in 2024.
- France rounded out the top five with 71,000 visitors in 2024.
How long do tourists stay in Arizona?
When is the best time to visit Arizona?
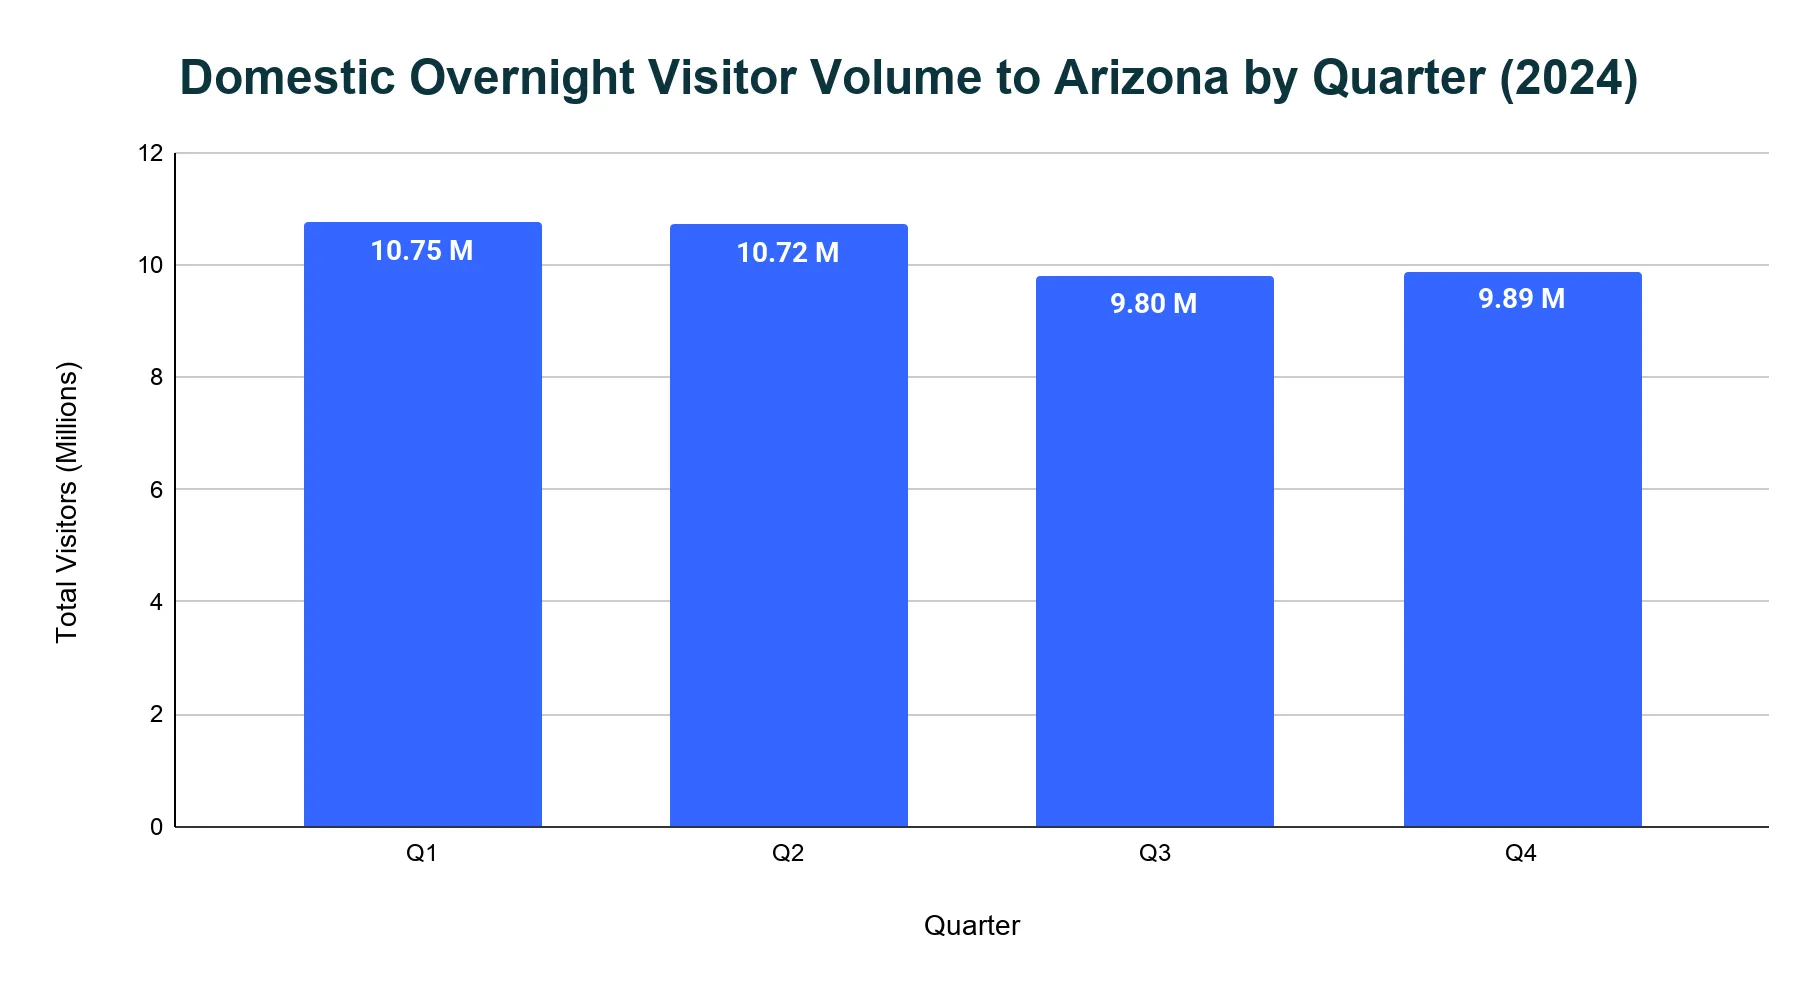
Arizona’s seasonal appeal varies by region, with 2024 visitation trends showing:
- Q1 (Jan–Mar): 10.75 million domestic visitors - peak season in southern Arizona.
- Q2 (Apr–Jun): 10.72 million, showing strong spring travel.
- Q3 (Jul–Sep): 9.8 million, the lowest volume, with more travel to cooler northern areas.
- Q4 (Oct–Dec): 9.89 million, the start of southern Arizona's high season.
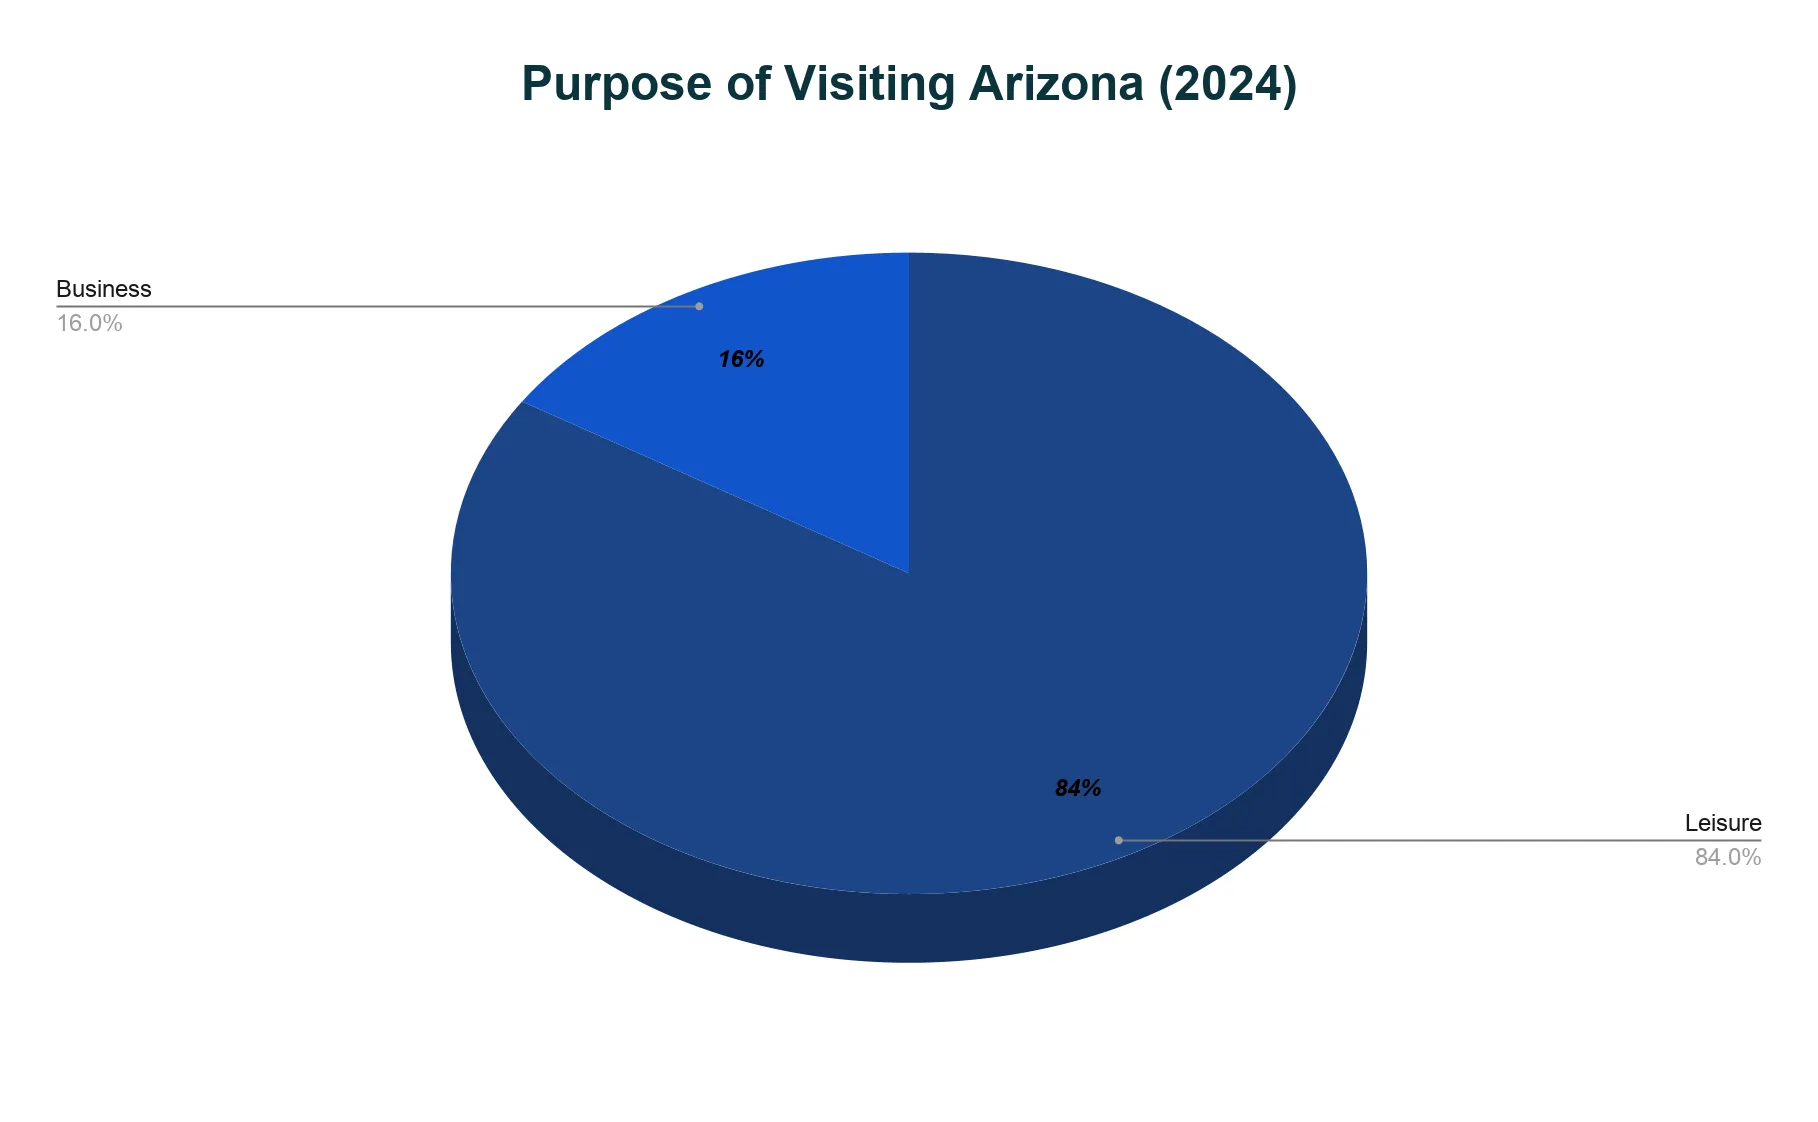
Why do people visit Arizona?
- Leisure travel: 84% of domestic overnight visits, including recreation and entertainment.
- Business travel: 16%.
Related Travel Statistics
- Chicago Tourism Statistics
- Colorado Tourism Statistics
- Dallas Tourism Statistics
- Disneyland Tourism Statistics
- Florida Tourism Statistics
- Grand Canyon Tourism Statistics
- Illinois Tourism Statistics
- Niagara Falls Tourism Statistics
- Pennsylvania Tourism Statistics
- Seattle Tourism Statistics
- Washington Tourism Statistics
- Washington DC Tourism Statistics
What are the main attractions in Arizona?
- Scottsdale: 11.6 million visitors in 2024.
- Tucson & Southern Arizona: 6.2 million in FY 2024 (year ending June 30).
- Grand Canyon National Park: 4.92 million, Arizona’s top natural attraction.
- Tempe: 4.5 million in 2024, aided by proximity to Phoenix and ASU.
- Sedona: about 3.1 million in 2022, known for its red rocks and wellness retreats.
Economic Impacts of Tourism In Arizona
- Tourism supported 193,860 direct jobs in 2024, up 3.2% from 2023.
- Travel-related earnings reached $9.3 billion, a 6.6% increase.
- Tax revenue rose to $4.3 billion, a 1.3% increase from 20234.
References
- Arizona Office of Tourism — Domestic Visitor Profile 2024 · tourism.az.gov ↑
- Arizona Office of Tourism — 2024 International Market Profile: Canada · tourism.az.gov ↑
- Arizona Office of Tourism — 2024 International Market Profile: Germany · tourism.az.gov ↑
- Arizona Office of Tourism — Economic Impact of Travel in Arizona (2024p) · tourism.az.gov ↑
- Arizona Office of Tourism — Annual Visitation Data · tourism.az.gov
- Scottsdale Visitor Statistics Report (2024) · scottsdaleaz.gov
- Tempe Tourism — Visitor Spending in 2024 · tempetourism.com
- National Park Service — Grand Canyon Visitation Statistics · nps.gov
- Visit Tucson — Annual Report FY24 · assets.simpleviewinc.com
- Red Rock News — Sedona Tourism Totals (2022) · redrocknews.com

