

 Popular Countries
 24/7 Support

Updated
Niagara Falls is one of the world’s best-known sights, shared by twin cities on either side of the border: Niagara Falls, Ontario, in Canada, and Niagara Falls, New York, in the U.S.
How many people visit Niagara Falls each year?
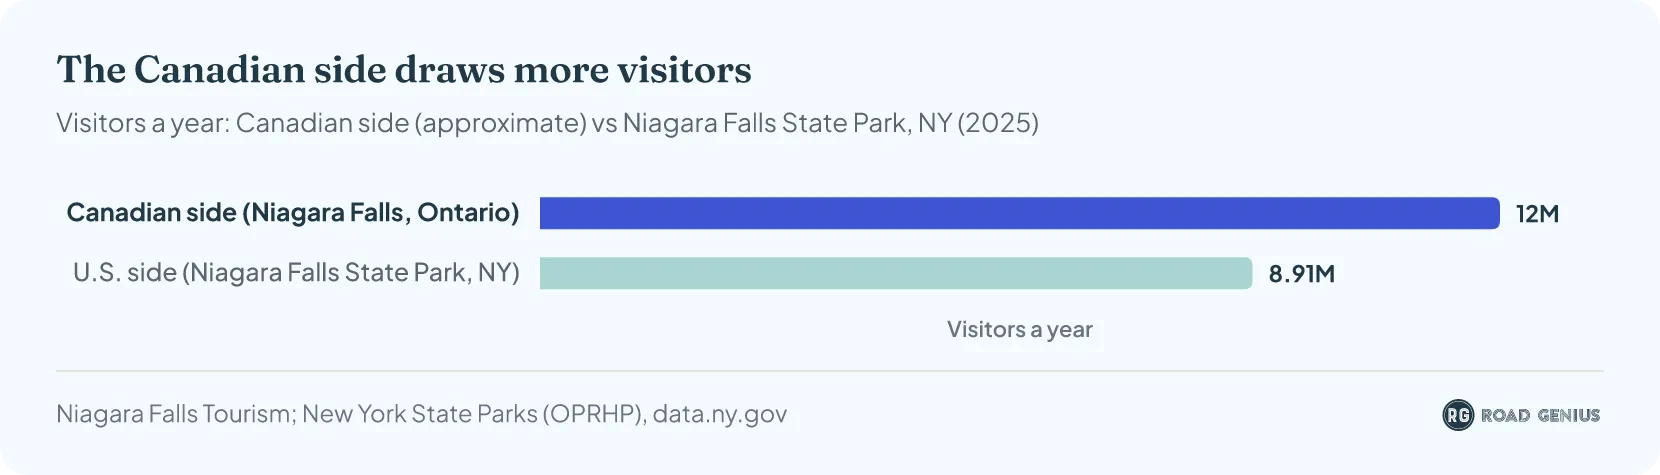
Niagara Falls draws roughly 21 million visits a year across both sides of the border. The city of Niagara Falls, Ontario, welcomes about 12 million visitors a year1, and Niagara Falls State Park, NY, recorded 8.91 million in 20252.
- In 2019, Niagara Falls State Park, NY, recorded 9.6 million visitors2.
- COVID-19 cut attendance in 2020 to just 5.97 million visitors2.
- Attendance rebounded to 9.38 million in 20222.
- In 2023, the U.S. side welcomed approximately 9.5 million visitors, slightly below the 2019 peak2.
- The park recorded 9.52 million visitors in 2024 and 8.91 million in 2025.2
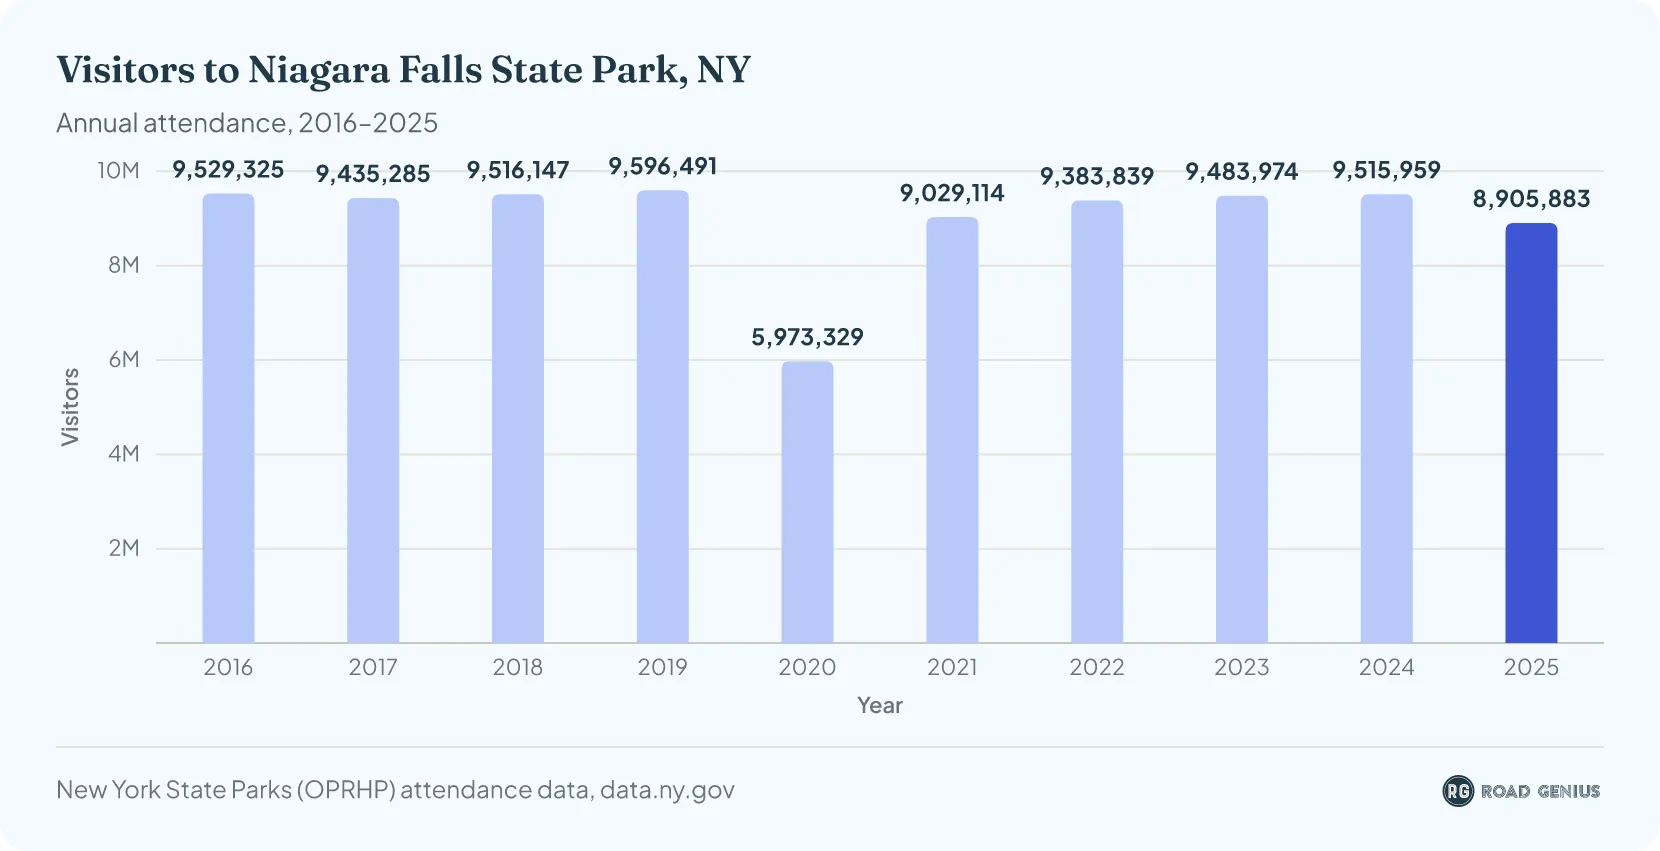
| Niagara Falls State Park visitors by year (2016–2025) | |
|---|---|
| Year | Niagara Falls State Park, NY (visitors) |
| 2,016 | 9,529,325 |
| 2,017 | 9,435,285 |
| 2,018 | 9,516,147 |
| 2,019 | 9,596,491 |
| 2,020 | 5,973,329 |
| 2,021 | 9,029,114 |
| 2,022 | 9,383,839 |
| 2,023 | 9,483,974 |
| 2,024 | 9,515,959 |
| 2,025 | 8,905,883 |
Source · State Park Annual Attendance Figures by Facility: Beginning 2003 — Niagara Reservation (Niagara Falls State Park), NYS OPRHP via data.ny.gov · retrieved 2026-11-04 from data.ny.gov 2
Which side of Niagara Falls gets more visitors?
Did Niagara Falls tourism drop in 2025?
Yes, on the U.S. side and among American visitors to Canada.
- Niagara Falls State Park, NY, recorded 8.91 million visitors in 2025, down 6.4% from 9.52 million in 2024 and its lowest count since 20202.
- Spending by U.S. visitors in the Niagara Region, Ontario, fell 10% in 2025 to about CA$1.5 billion, even as total visitor spending rose 16.5% to CA$3.8 billion4.
- Hotels in Niagara Falls, Ontario, averaged 59.5% occupancy from January to July 2025, down from 61.2% a year earlier, and the average nightly rate fell 7.6% to CA$206.284.
How much do tourists spend at Niagara Falls?
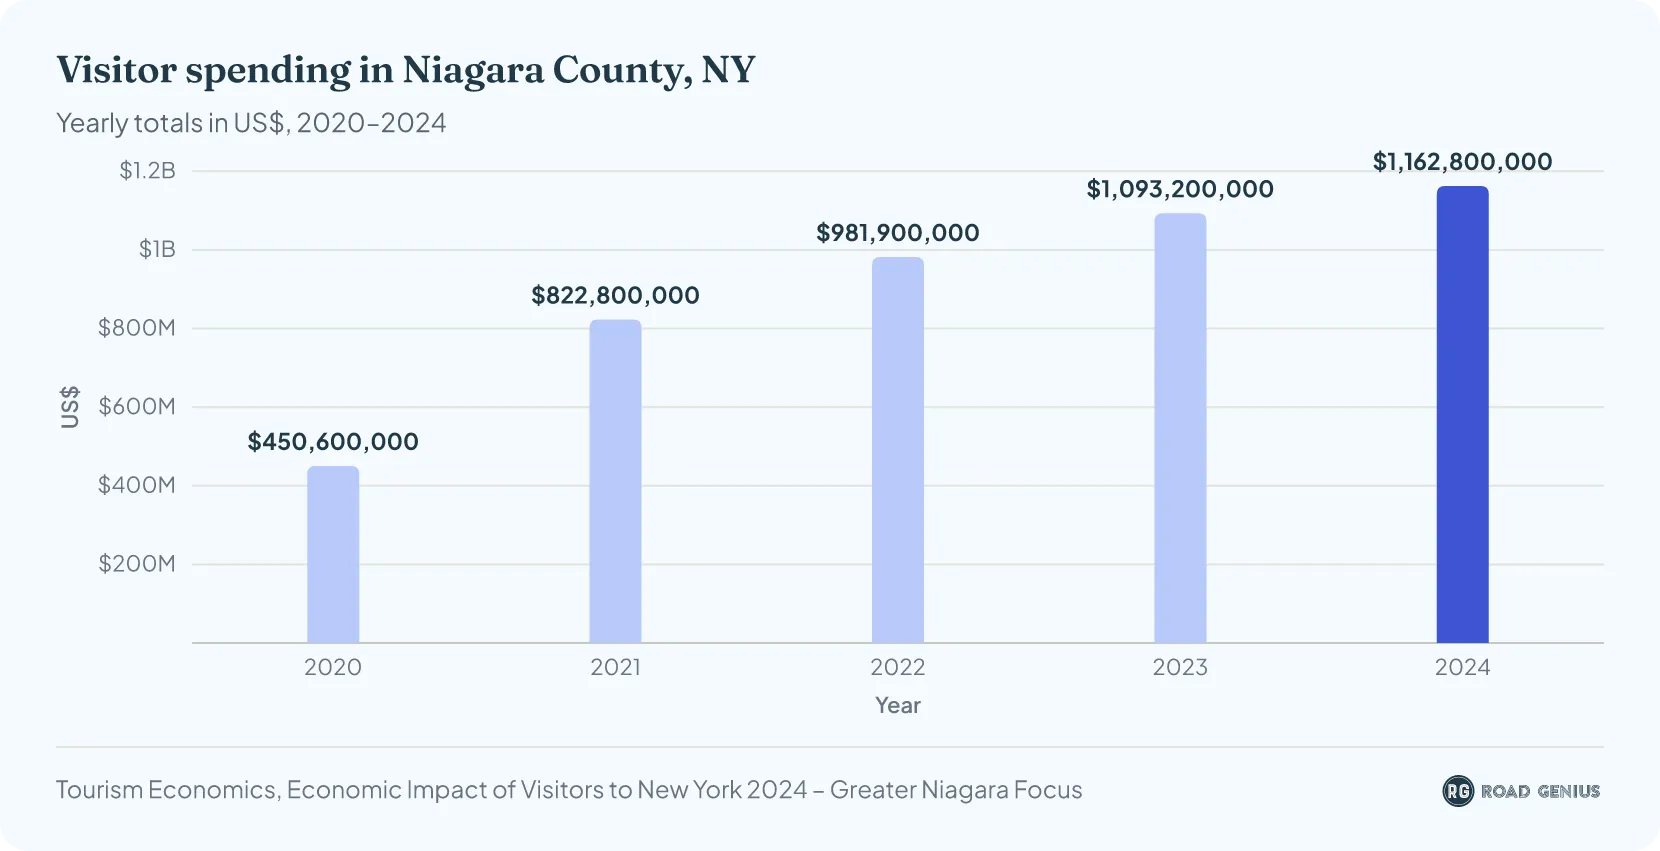
Visitors spend about CA$3.8 billion a year in the Niagara Region, Ontario (2025)4, and US$1.16 billion in Niagara County, NY (2024).5
- Visitor spending in Niagara County, NY, was US$761 million in 20196.
- The pandemic cut Niagara County visitor spending by about 38% in 2020, to US$475 million6.
- By 2022, spending in Niagara County recovered to US$969 million7.
- Spending climbed to US$1.08 billion in 2023, up 11.7% on 20228.
- In 2024, spending reached a new high of US$1.16 billion, up 6.4% on the revised 2023 figure of US$1.09 billion9.5
How much did visitors spend in Niagara County, NY, in 2024?
- Visitors spent US$1.16 billion in Niagara County, NY, in 2024, a 6.4% increase from 2023 and a new record.5
How much did visitors spend in Niagara County, NY, in 2023?
- Visitors spent US$1.08 billion in Niagara County, NY, in 2023, an 11.7% increase from 2022.8 This was the highest recorded visitor spending in the area at the time. New York's 2024 tourism report later revised the 2023 figure to US$1.09 billion9.
How much did visitors spend in Niagara County, NY, in 2022?
- In 2022, visitor spending in Niagara County, NY, reached US$969 million, a 16.5% increase from 2021.7
How much does it cost to go to Niagara Falls?
The boat tours to the foot of the falls are the main fixed cost of a visit, and each side has its own operator.
- Maid of the Mist, which sails from the U.S. side, costs US$30.25 per adult and US$19.75 for children aged 6 to 12 in 202610.
- Niagara City Cruises runs the Voyage to the Falls boat tour from the Canadian side for CA$47.9511.
- Hotel, food and daily budgets vary widely by season and side of the border, so check current rates when you book.
Which country sends the most visitors to Niagara Falls?
Most visitors come from Canada and the United States.
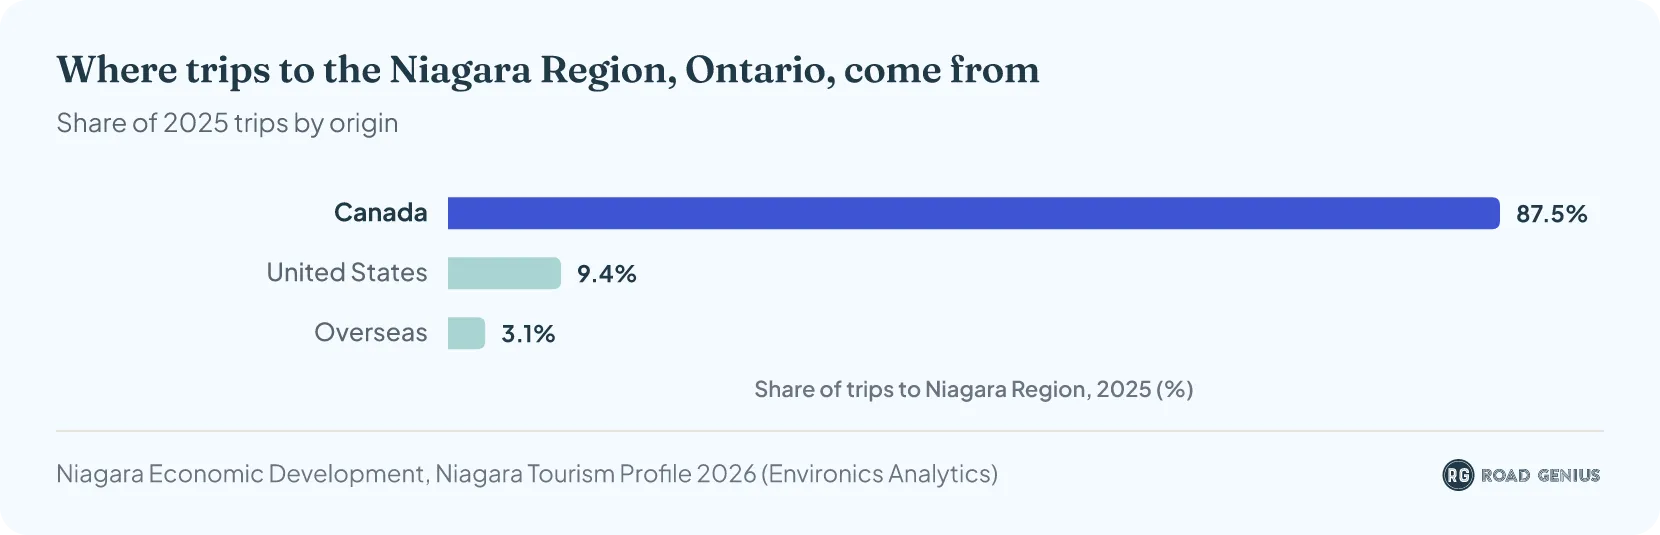
- In 2025, about 87% of the 7.53 million trips to the Niagara Region, Ontario, came from within Canada, about 9% from the United States and about 3% from overseas4.
- The top overseas markets for the Niagara Region, Ontario, in 2025 were the United Kingdom, Germany, South Korea, France and Mexico4.
How many international visitors does Niagara Falls get?
U.S. visitors make up the largest share of the international market on the Canadian side. In 2025, the Niagara Region, Ontario, recorded 709,118 trips from the United States and 234,224 from overseas, out of 7.53 million in total.4 In 2017, the Niagara Region, Ontario, counted about 3.2 million visits from Americans.12
How popular is Niagara Falls as a tourist destination?
Niagara Falls ranked the world’s best-loved landmark in a 2022 global analysis by luggage-storage firm Bounce13.
Car and Campervan Rental Near Niagara Falls
- Buffalo, NY
- Car Rental Buffalo Airport (BUF)
- Campervan Rental New York
- Niagara Falls, NY
- Toronto
- Car Rental Toronto Airport (YYZ)
- Toronto
- Car Rental Buffalo to Niagara Falls (One-Way)
- Car Rental New York to Niagara Falls (One-Way)
- Car Rental Toronto to Niagara Falls (One-Way)
- Car Rental Buffalo to Toronto (One-Way)
When is the best time to visit Niagara Falls?
The best all-round time to visit Niagara Falls is September. It is still part of Niagara's busiest season, but crowds start to thin once the summer holidays end, while the weather stays warm and every attraction is still open.
- Summer (July – September): Niagara's busiest season, with large crowds, warm weather, and all attractions open1.
- Spring (April – June): The second-busiest season1, with mild weather and spring scenery.
- Fall (October – December): Fewer crowds and fall foliage; the Winter Festival of Lights begins in November.
- Winter (January – March): Least crowded, with lower hotel rates.
References
- Tourism Research – Niagara Falls Tourism · niagarafallstourism.com ↑ b c d e
- State Park Annual Attendance Figures by Facility: Beginning 2003 — Niagara Reservation (Niagara Falls State Park), NYS OPRHP via data.ny.gov · New York State Office of Parks, Recreation and Historic Preservation ↑ b c d e f g h i j k l
- State Park Annual Attendance Figures by Facility — all facilities, 2025 (NYS OPRHP via data.ny.gov) · New York State Office of Parks, Recreation and Historic Preservation ↑
- Niagara Tourism Profile 2026 (Niagara Economic Development) · niagaracanada.com ↑ b c d e f g
- Visitor Spending in Niagara County Reaches $1.16 Billion in 2024, Boosting Local Economy · niagarafallsusa.com ↑ b c
- Economic Impact of Visitors in New York 2023 – Greater Niagara Focus · esd.ny.gov ↑ b
- Tourism Spending Reaches $969 Million in Niagara County for 2022 · niagarafallsusa.com ↑ b
- Record-Breaking Year for Tourism Spending in Niagara County · niagarafallsusa.com ↑ b
- Economic Impact of Visitors to New York 2024 – Greater Niagara Focus · esd.ny.gov ↑ b
- Maid of the Mist — 2026 Rates (Niagara Falls State Park) · niagarafallsstatepark.com ↑
- Niagara City Cruises — Voyage to the Falls Boat Tour · niagaracitycruises.com ↑
- Niagara Tourism Profile – March 2019 (Niagara Economic Development) · niagaracanada.com ↑ b
- Best-Loved Landmarks – Bounce · bounce.com ↑
- Maid of the Mist Sets the Standard for Modern Zero-Emission Vessel Operations · maidofthemist.com ↑
- Niagara Canada — Tourism (key sectors) · niagaracanada.com
More Statistics
- Florida Tourism Statistics
- Grand Canyon Tourism Statistics
- Houston Tourism Statistics
- Illinois Tourism Statistics
- Florida Keys and Key West Tourism Statistics
- Los Angeles Tourism Statistics
- Massachusetts Tourism Statistics
- New Jersey Tourism Statistics
- Oahu Tourism Statistics
- Statue of Liberty Tourism Statistics
- Washington Tourism Statistics
- Yellowstone National Park Tourism Statistics
