

 Popular Countries
 24/7 Support
Published
Also known as the Garden State, New Jersey is a varied tourist destination on the U.S. East Coast, and is known for its Atlantic beaches, boardwalk towns, and historic places. Different regions offer different attractions, with the state’s 130 miles of shoreline being a particular point of interest.
How many people visit New Jersey each year?
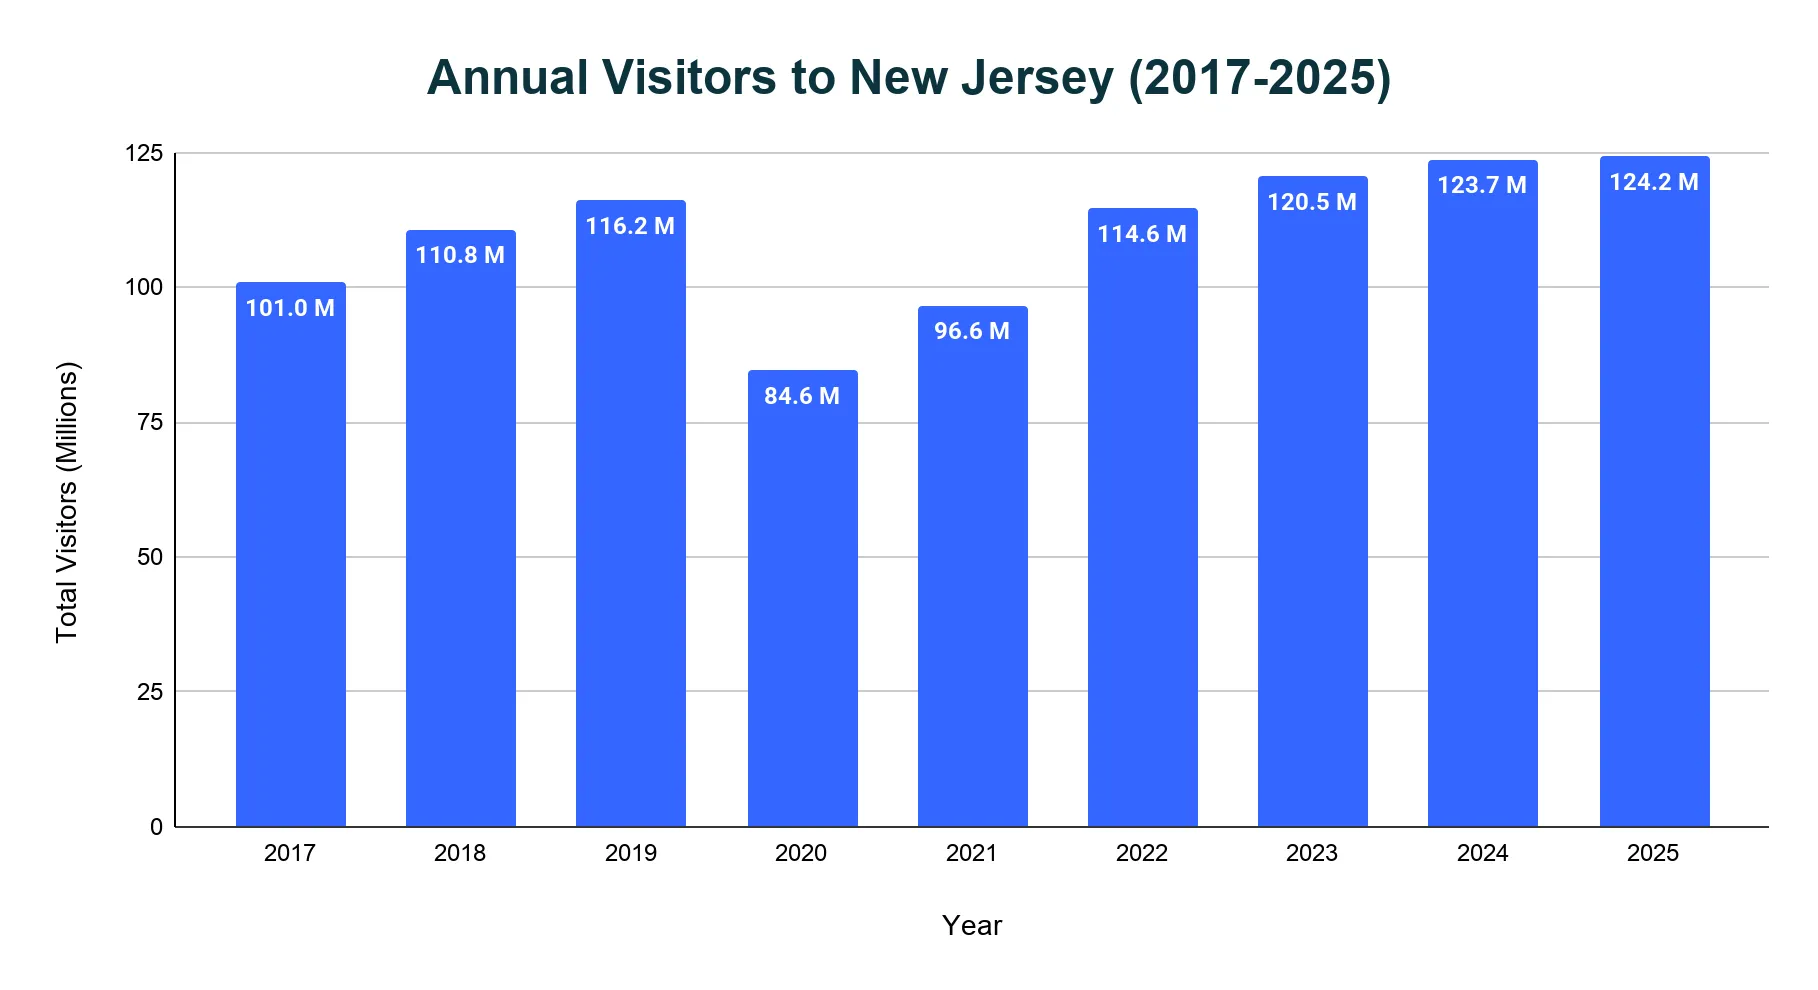
New Jersey draws over 120 million visitors annually, maintaining its appeal to both domestic and international travelers.
- Total visitation reached a record 124.2 million in 2025, a 0.4% increase from 123.7 million in 2024.
- In 2019, the pre-pandemic benchmark stood at 116.2 million.
- Visitor numbers dropped sharply to 84.6 million in 2020, a 27% decline due to global travel restrictions and closures.
- Visitation rose to 96.6 million in 2021, marking the beginning of recovery.
- Growth continued in 2022 with 114.6 million visitors, nearing pre-pandemic levels.
- New Jersey saw 120.5 million visitors in 2023, surpassing 2019 levels.
How many people visited New Jersey in 2025?
- The state attracted 124.2 million visitors in 2025, marking significant progress in the tourism rebound.
- This was a 0.4% increase over 2024 and a 6.9% increase from 2019.
How many people visited New Jersey in 2024?
- New Jersey welcomed 123.7 million visitors in 2024, setting a new all-time high for the state.
- This represented a 2.7% increase from 2023 and a 6.5% increase compared to 2019.
How many people visit New Jersey each day?
- In 2025, an average of 340,200 people visited New Jersey each day, underscoring its year-round appeal.
- The daily average was approximately 338,000 in 2024.
- During peak summer months, especially in July and August, daily visitors can exceed 400,000.
- Even in winter, daily visitation remains above 250,000.
How much do visitors spend each year?
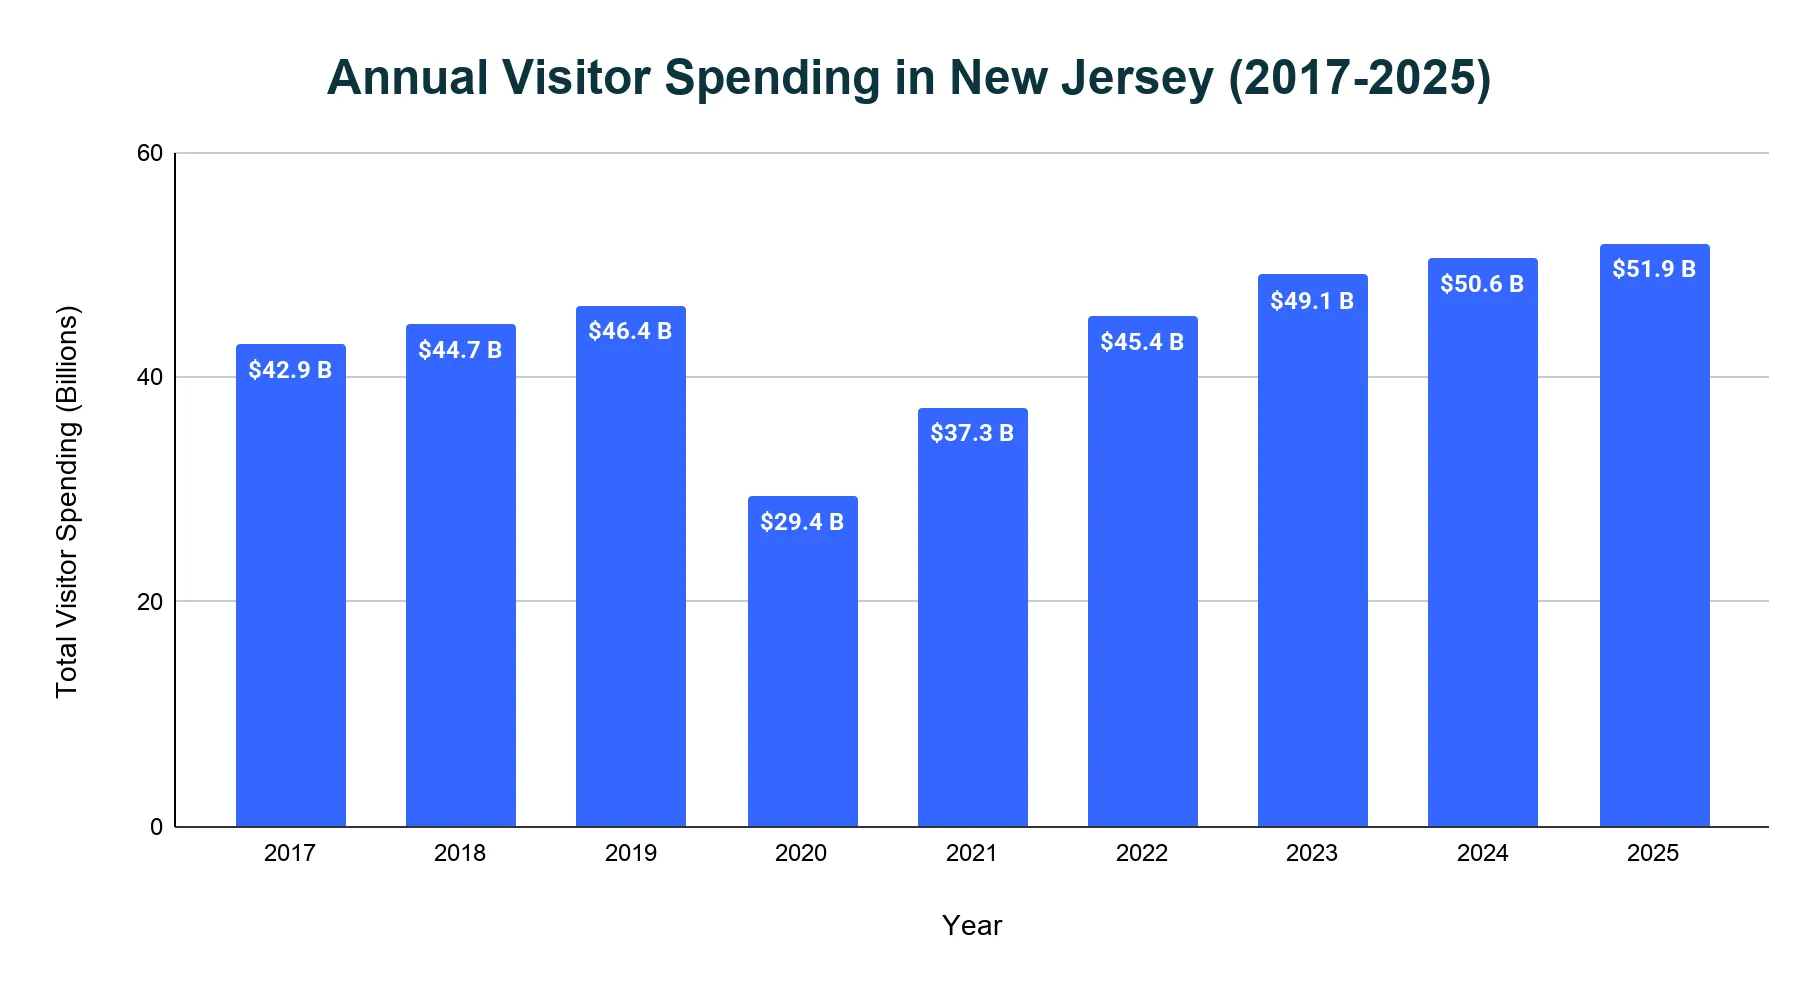
Tourism is a key part of New Jersey’s economy, with total spending surpassing $50 billion for the first time in 2024.
- In 2025, visitor spending reached $51.9 billion, a 2.6% increase from $50.6 billion in 2024.
- In 2023, visitor spending totaled $49.1 billion, reflecting strong recovery momentum.
- Pre-pandemic spending in 2019 was $46.4 billion, which dropped to $29.4 billion in 2020.
- Recovery began in 2021 with $37.3 billion, followed by $45.4 billion in 2022.
How much did visitors spend in 2025?
- Visitors spent $51.9 billion in New Jersey in 2025, marking substantial growth in tourism revenue.
- This figure represented a 2.6% increase compared to 2024 and an 11.9% increase over pre-pandemic 2019 levels.
How much did visitors spend in 2024?
- In 2024, visitors spent a record $50.6 billion in New Jersey.
- This was a 3.1% increase over 2023 and a 9.1% increase compared to 2019.
Visitor Spending Breakdown
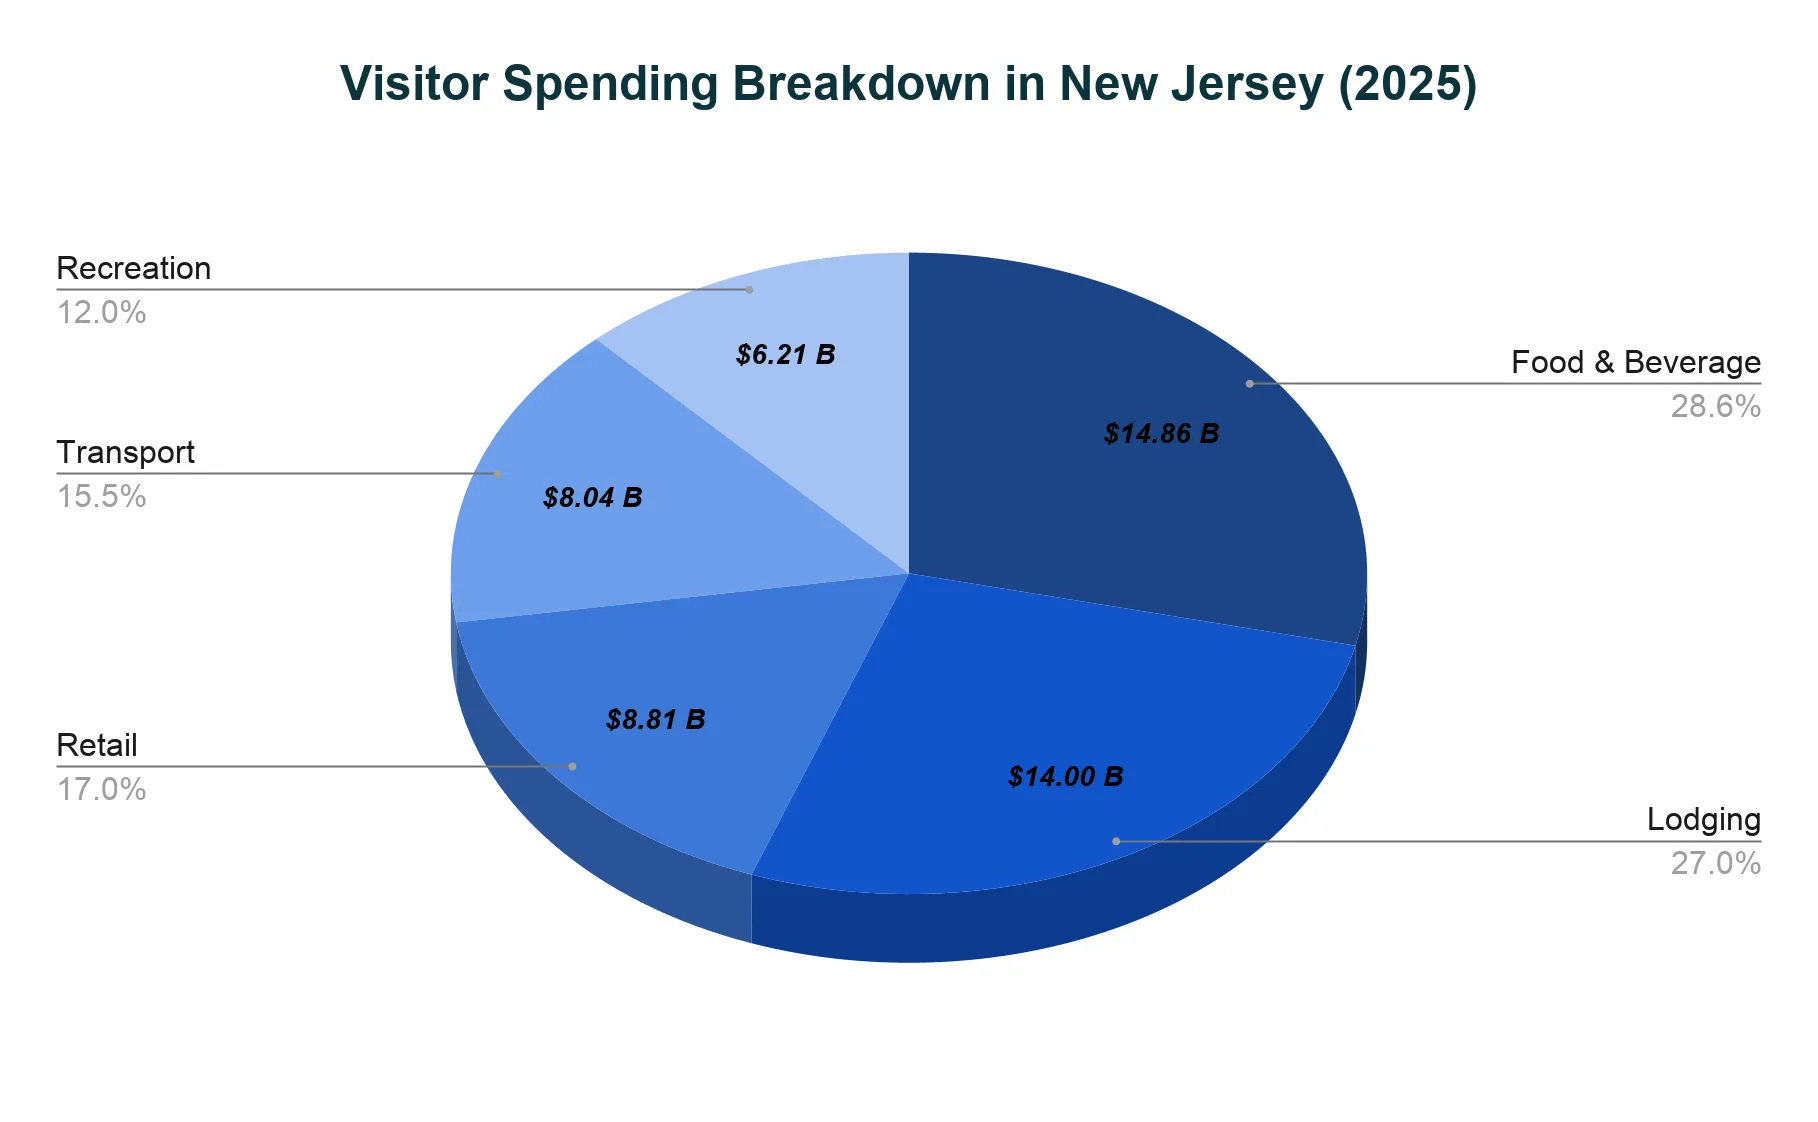
- Food and beverage spending totaled $14.86 billion in 2025, representing the largest share of visitor spending in New Jersey at 28.6%.
- Lodging followed with $14 billion, representing 27%.
- Retail spending tallied $8.81 billion or 17.0% of visitor spending.
- Transportation and Recreation accounted for $8.04 billion (15.5%) and $6.21 billion (12%), respectively.
How much does it cost to visit New Jersey?
The cost of visiting New Jersey varies widely based on travel style and chosen destinations, with the state offering options for budget, mid-range, and luxury travelers.
- In FY 2025 (Q4 2024 to Q3 2025), The average daily spending for an overnight leisure visitor was approximately $189 per person, broken down into lodging (26%), food and beverage (26%), transportation (17%), entertainment (15%), and shopping (10%).
- Day-trip visitors spent about $142 per person per day, with a higher share going to food (32%) and transportation (22%).
- Budget travelers typically spend $75-150 per day, including affordable stays and local dining.
- Mid-range travelers spend around $150-300 daily, choosing standard hotels and mid-tier restaurants.
- Luxury travelers spend $300+ per day, opting for high-end lodging and upscale dining.
International vs. domestic visitors
New Jersey tourism is driven mostly by domestic travel, but international visitors contribute more per person.
- In 2025, domestic visitors made up 122.32 million of the 124.2 million total visitors (98.5%).
- International visitors totaled 1.89 million (1.5%) but had higher per-capita spending.
| Visitor Breakdown: Domestic vs International | ||
|---|---|---|
| Year | Domestic | International |
| 2019 | 114.63 M | 1.52 M |
| 2020 | 84.21 M | 0.34 M |
| 2021 | 96.14 M | 0.50 M |
| 2022 | 113.23 M | 1.35 M |
| 2023 | 118.56 M | 1.90 M |
| 2024 | 121.63 M | 2.08 M |
| 2025 | 122.32 M | 1.89 M |
Overnight vs. Day-trip Visitors
- Overnight visitors totaled 52.61 million (42.4%) in 2025, generating $44.45 billion (85.6%) of total spending.
- Day-trip visitors accounted for 71.59 million (57.6%) but contributed just $7.48 billion (14.4%).
| Total Visitors | Total Visitor Spending | Per Visitor Spending | ||||
|---|---|---|---|---|---|---|
| Year | Day-trip | Overnight | Day-trip | Overnight | Day-trip | Overnight |
| 2019 | 61.46 M | 54.69 M | $4.49 B | $41.96 B | $73 | $767 |
| 2020 | 46.13 M | 38.43 M | $3.54 B | $25.81 B | $77 | $672 |
| 2021 | 51.56 M | 45.07 M | $4.18 B | $33.16 B | $81 | $736 |
| 2022 | 62.42 M | 52.16 M | $5.70 B | $39.68 B | $91 | $761 |
| 2023 | 67.07 M | 53.39 M | $6.37 B | $42.68 B | $95 | $799 |
| 2024 | 69.98 M | 53.72 M | $6.92 B | $43.64 B | $99 | $812 |
| 2025 | 71.59 M | 52.61 M | $7.48 B | $44.45 B | $105 | $845 |
Visitor Volume and Spending by County
- Visitor activity varied across counties, with Atlantic leading in visitor volume in 2025 at 23.89 million, followed by Cape May (12.03 million), Ocean (10.88 million), and Monmouth (10.16 million).
- In terms of spending, Cape May ranked highest with $8.44 billion, closely trailed by Atlantic at $8.40 billion. Ocean recorded $5.98 billion, while Essex stood out with $4.07 billion in visitor spending.
| New Jersey’s County-Level Visitor Trends (2025) | ||||
|---|---|---|---|---|
| County | Total Visitors | % Share | Visitor Spending | % Share |
| Atlantic County | 23.89 M | 19.2% | $8,403.4 M | 16.18% |
| Bergen County | 10.14 M | 8.2% | $3,527.4 M | 6.79% |
| Burlington County | 3.83 M | 3.1% | $1,706.8 M | 3.29% |
| Camden County | 4.11 M | 3.3% | $1,009.0 M | 1.94% |
| Cape May County | 12.03 M | 9.7% | $8,440.8 M | 16.25% |
| Cumberland County | 1.00 M | 0.8% | $407.0 M | 0.78% |
| Essex County | 6.23 M | 5.0% | $4,065.2 M | 7.83% |
| Gloucester County | 1.48 M | 1.2% | $649.4 M | 1.25% |
| Hudson County | 8.54 M | 6.9% | $2,987.9 M | 5.75% |
| Hunterdon County | 1.34 M | 1.1% | $325.8 M | 0.63% |
| Mercer County | 3.21 M | 2.6% | $1,301.5 M | 2.51% |
| Middlesex County | 6.27 M | 5.0% | $2,835.4 M | 5.46% |
| Monmouth County | 10.16 M | 8.2% | $3,193.3 M | 6.15% |
| Morris County | 6.11 M | 4.9% | $2,416.5 M | 4.65% |
| Ocean County | 10.88 M | 8.8% | $5,976.7 M | 11.51% |
| Passaic County | 2.22 M | 1.8% | $762.1 M | 1.47% |
| Salem County | 0.39 M | 0.3% | $198.9 M | 0.38% |
| Somerset County | 3.06 M | 2.5% | $1,291.9 M | 2.49% |
| Sussex County | 3.32 M | 2.7% | $608.6 M | 1.17% |
| Union County | 3.39 M | 2.7% | $1,628.6 M | 3.14% |
| Warren County | 2.58 M | 2.1% | $195.2 M | 0.38% |
When is the best time to visit New Jersey?
New Jersey tourism follows clear seasonal patterns.
- Peak Season (June–August): Highest visitor volumes and hotel prices. Popular for beach trips and summer festivals.
- Shoulder Seasons (April–May, September–October): Milder weather, fewer crowds and moderate pricing. Ideal for outdoor events and local festivals.
- Low Season (November–March): Lower prices and visitor numbers. While cold weather limits outdoor options, indoor attractions and cultural events remain active.
Related Travel Statistics
- Disneyland Tourism Statistics
- Houston Tourism Statistics
- Los Angeles Tourism Statistics
- Louisiana Tourism Statistics
- Miami Tourism Statistics
- Mount Rushmore Tourism Statistics
- New Orleans Tourism Statistics
- Niagara Falls Tourism Statistics
- Seattle Tourism Statistics
- Tennessee Tourism Statistics
- Universal Orlando Tourism Statistics
- Washington DC Tourism Statistics
What are the main attractions in New Jersey?
- Atlantic County (Atlantic City): The most visited area in 2025 with 23.89 million visitors, driven by casino resorts and beach towns.
- Cape May County: Second most visited with 12.03 million visitors, known for its Victorian architecture, family beaches and towns like The Wildwoods and Ocean City.
- Liberty State Park & Statue of Liberty/Ellis Island: While 2025 data for the park alone isn’t available, the National Park Service recorded 3.54 million visitors to the Statue of Liberty and Ellis Island.
- Grounds for Sculpture: This 42-acre sculpture park in Hamilton welcomed 231,000+ guests in 2024.
Economic Impact of New Jersey Tourism
- In 2025, tourism generated $83.2 billion in business sales and contributed $44.7 billion in value added to the state’s economy.
- The industry supported 514,581 jobs, producing $26.8 billion in labor income.
- It also generated $5.5 billion in state and local taxes.
References
- Economic Impact & Leisure Visitor Profile of New Jersey · visitnj.org
- Best Time to Visit New Jersey · getdirecto.com

