Page last updated: 12 November 2025
Disneyland in Anaheim, California stands as one of the top tourist destinations in the world and a beacon of imagination and fun, captivating millions of visitors each year with its two major parks: Disneyland Park and Disney California Adventure Park.
How many people visit Disneyland each year?
Disneyland in California attracts over 28 million visitors annually.1
- This figure includes the combined attendance of both Disneyland Park and Disney California Adventure Park.
Breaking Down the Magic: Attendance Per Park
How many people visit Disneyland Park every year?
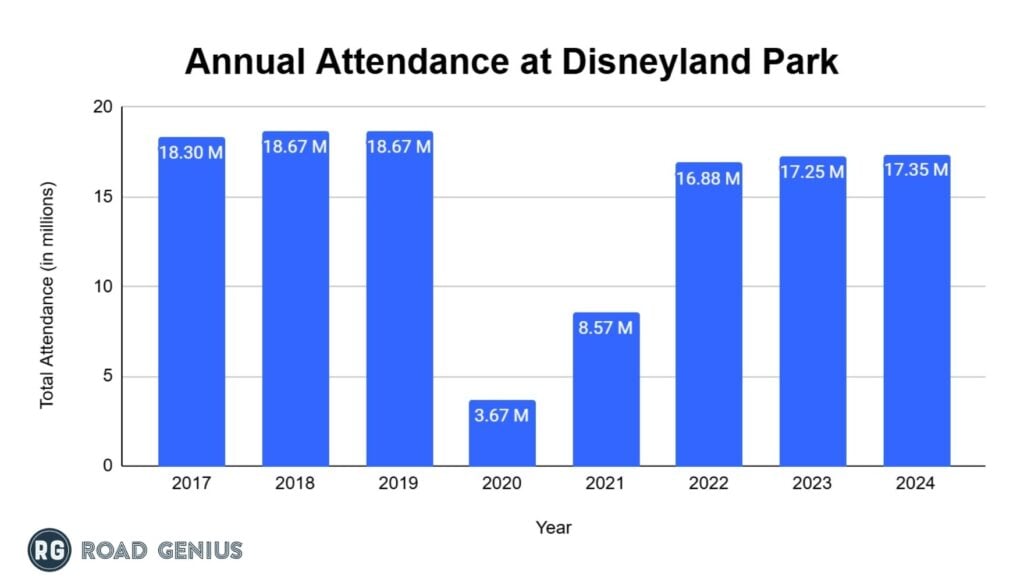
Disneyland Park welcomed approximately 18 million visitors annually before the pandemic and consistently attracts more visitors than its sister park, Disney California Adventure.
- Before the Pandemic (2019): 18.67 million
- During the Pandemic (2020): 3.67 million, 80.3% decrease
- Recovery Phase Begins (2021): 8.57 million, a 133.5% jump
- After the Pandemic (2022): 16.88 million, a 96.8% increase
- In 2023, there was a 2.2% increase in visitor numbers (17.2 million visits).
- The park recorded almost the same number of visitors as the previous year in 2024 (17.35 million visits).
How many people visit Disney California Adventure every year?
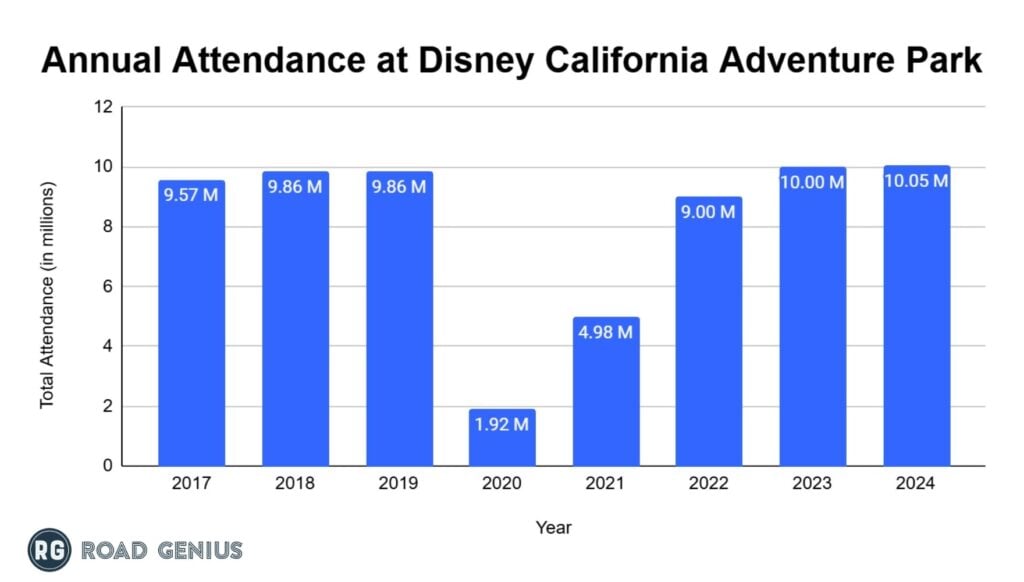
Disney California Adventure also maintained a strong visitor count, reaching nearly 10 million visitors annually before the COVID-19 pandemic.
- Before the Pandemic (2019): 9.86 million
- During the Pandemic (2020): 1.92 million, reflecting an 80.5% decline
- Recovery Phase Begins (2021): 4.98 million, showcasing a 159.3% increase
- After the Pandemic (2022): 9 million, rose by 80.9%
- In 2023, 10 million people visited Disney California Adventure Park.
- Visitor volume increased only slightly to 10.05 million in 2024.
How many people visited Disneyland in 2024?
Disneyland California, which includes Disneyland Park and Disney California Adventure Park, welcomed 27.35 million visitors in 2024.
- This marked a less than 1% increase from 2023’s 27.25 million visitors but remained 4.1% below the 2019 attendance of 28.53 million.
How many people visit Disneyland every day?
Below are the average daily visitor numbers calculated from annual attendance data:
Disneyland Park:
- 2024: Approximately 47,397 visitors per day
- 2023: Approximately 47,260 visitors per day
- 2022: Approximately 46,249 visitors per day.
- 2021: Approximately 23,488 visitors per day.
- 2020: Approximately 10,066 visitors per day
- 2019: Approximately 51,140 visitors per day.
Disney California Adventure:
- 2024: Approximately 27,534 visitors per day
- 2023: Approximately 27,397 visitors per day
- 2022: Approximately 24,658 visitors per day.
- 2021: Approximately 13,636 visitors per day.
- 2020: Approximately 5,258 visitors per day.
- 2019: Approximately 27,016 visitors per day.
How much do visitors spend in Disneyland?
- In 2018, Disneyland generated an estimated $8.5 billion in annual economic activity, impacting the Southern California economy through direct park operations and local business engagement.2
- The resort’s direct annual revenue is estimated to be between $2 billion and $3 billion, including ticket sales, in-park spending, and hotel income. These figures can vary based on attendance, pricing, and special events.
Economic Impact of Disneyland in California
- In 2024, Disneyland generated over $279 million in annual tax revenue for Anaheim, supporting local city services and programs.
- 102,000 direct and indirect jobs were supported in Southern California.
- 1 in 20 jobs in Orange county is supported as a result of the Disneyland Resort.
- Disneyland resort generated nearly $2.6 billion in total tax revenue3
How much did visitors spend in Disneyland in 2022?
Visitor spending in 2022 saw a 40% increase compared to pre-pandemic levels, according to Disney’s 2022 second-quarter report.
- This increase was driven by several factors, including a 6% average ticket price increase in October 2022, with some tickets seeing up to an 8% rise.4
- Additionally, Disney reported increased expenditure on food, beverages, and merchandise, bolstered by the popularity of new attractions like the Star Wars-themed experiences.
- In December 2022, Disneyland introduced Genie+ and Lightning Lanes, which contributed to the increased revenue. Genie+ allows guests to fast-track queues on select rides for a fee of $15 to $20 in California. Lightning Lane access, also available for a fee, lets visitors select an arrival time to skip lines at popular attractions.
How much does Disneyland make a day?
- Disneyland earns an estimated $5 to $6 million per day. This figure is based on annual revenue estimates ranging from $2 billion to $3 billion.
Impact of Coronavirus – Disneyland Tourism Statistics 2020 & 2021
The 2020 and 2021 tourism statistics highlighted $4 billion in revenue loss.5 The COVID-19 pandemic affected global tourism, and Disneyland Resort was no exception.
- In 2020, the total attendance for both parks was 5.59 million but this began to rebound to 13.55 million in 2021, marking a nearly 142% increase.
Where do visitors to Disneyland come from?
- Disneyland attracts visitors locally and from around the world. Though detailed data isn’t publicly disclosed, trends suggest many visitors are likely from within the state, and countries like Mexico, Canada, the UK, and Australia, which represent the top inbound markets.6
Many of these international and domestic travelers include Disneyland as a key stop during their road trips in the US, exploring other famous attractions along the way such as the Grand Canyon, Las Vegas, and the Pacific Coast Highway.
When is the best time to visit Disneyland?
The best time to visit Disneyland depends on the visitor’s preferences for crowd levels, weather, and events.
Crowd Levels:
- January to mid-February: After the holiday season, crowds are generally lower, making it a good time for shorter wait times and less congestion in the park.
- Mid-September to mid-November: This period offers moderate crowds as schools are in session, and the summer rush has ended.
Weather:
- March to May: The weather is mild, with temperatures ranging from the mid-60s to low 70s (°F). Spring also brings blooming flowers, adding to the park’s beauty.
- September to October: Early fall provides pleasant weather with temperatures in the 70s (°F), making it comfortable to explore the park all day.
Events and Special Celebrations:
- Halloween Season (mid-September to October): The park is decorated with Halloween-themed attractions and events, including the popular “Oogie Boogie Bash.”
- Holiday Season (mid-November to early January): Disneyland is transformed with festive decorations and special holiday shows, though it is also one of the busiest times of the year.
To avoid the largest crowds, it’s advisable to visit on weekdays during the off-peak periods mentioned above.
California Travel Resources
Price Comparison
Rental cars in California & the USA
- Rental cars in Anaheim
- Rental cars in Costa Mesa
- Rental cars in Disneyland
- Rental cars in Garden Grove
- Rental cars in Glendale
- Rental cars in Huntington Beach
- Rental cars in Irvine
- Rental cars in Long Beach
- Rental cars in Los Angeles
- Rental cars in Pasadena
- Rental cars in Santa Ana
- Rental cars in Torrance
RV rental costs
One Way
One-way car rentals in California:
- Anaheim to Las Vegas rental cars
- Anaheim to San Diego
- Anaheim to San Francisco rental cars
- Los Angeles to Las Vegas
- Los Angeles to San Diego rental cars
- Los Angeles to San Francisco
- Los Angeles to Palm Springs rental cars
- Los Angeles to Seattle
- Orange County to Los Angeles rental cars
- Bakersfield to Los Angeles
Airports
Car rental prices at California airports
How much does it cost to go to Disneyland?
The cost of a visit to Disneyland can vary depending on the length of stay, ticket options, and additional expenses. Here’s a breakdown of typical costs7:
Tickets:
- Single-Day Tickets: Prices range from $104 to $209, depending on the date and demand.
- Multi-Day Tickets: Start at $310 for a 2-day ticket, with prices increasing for longer stays.
- Park Hopper Tickets: Add $65 to $75 to a ticket for the option to visit both Disneyland Park and Disney California Adventure on the same day.
- Magic Key Pass: Annual passes start at $399, offering various levels of access and perks depending on the tier.
Additional Expenses:
- Food and Drinks: Expect to spend between $10 and $20 per person for quick service meals and $15 to $60 per person for sit-down dining experiences.
- Parking: The standard parking fee is $35 per day, with oversized vehicles charged $40.
- Souvenirs: Prices range from $10 for small items to $100 or more for premium merchandise.
- Genie+ and Lightning Lane Passes: These services start at $20 to $30 per adult per day, providing quicker access to popular attractions.
Estimated Costs for a Family of Four (Three-Day Visit):
- Tickets (3-day Park Hopper): Approximately $1,790.
- Food and Drinks: Around $900.
- Parking: $105 total for three days.
- Genie+ Service: About $360 for faster access to rides.
- Souvenirs: Estimated at $200.
- Total Estimated Cost: Approximately $3,355.
This estimate does not include accommodation or travel expenses to and from the resort. Costs can vary based on personal preferences and spending habits.
America and USA Travel Statistics Resources
- Arizona Statistics (incl. Grand Canyon National Park)
- California Statistics (incl. Los Angeles, San Diego, San Francisco, Universal Studios Hollywood)
- Canada Statistics (incl. Montreal, Toronto, Vancouver)
- Colorado Statistics (incl. Denver)
- Florida Statistics (incl. Destin, Key West, Miami, Orlando, Universal Orlando)
- Hawaii Statistics (incl. Kauai, Maui, Oahu)
- Illinois Statistics (incl. Chicago)
- Louisiana Statistics (incl. New Orleans)
- Massachusetts Statistics (incl. Boston)
- Mexico Statistics (incl. Cancun)
- Nevada Statistics (incl. Las Vegas)
- New York Statistics (incl. New York City, Statue of Liberty)
- Panama Statistics
- Peru Statistics (incl. Machu Picchu)
- South Dakota Statistics (incl. Mount Rushmore)
- Tennessee Statistics (incl. Memphis, Nashville)
- Texas Statistics (incl. Dallas, Houston, San Antonio)
- Utah Statistics
- Washington Statistics (incl. Seattle)
- Yellowstone National Park Statistics
References
- AECOM: Theme Index and Museum Index Reports ↩︎
- CSUF: Total Economic Impact Of Disneyland Resort In Southern California ↩︎
- DCC: Economic Impact of Disneyland CA ↩︎
- OCRegister: Disney’s Second – Quarter Earnings Report ↩︎
- OCRegister: Impact of COVID-19 pandemic to Disneyland Resort ↩︎
- TMCA: 2018 International Travel to California – Top Market ↩︎
- Disneyland: Theme Park Tickets ↩︎