

 Popular Countries
 24/7 Support
Published Mar 13, 2024 · Updated Sep 28, 2026
California, known as “The Golden State”, consistently attracts tourists worldwide. With its sprawling beaches, iconic cities, and diverse landscapes, it’s no surprise that the state has continued to draw in millions of visitors each year.
California tourism at a glance
- 271.4 million people visited California in 2025, including 16.41 million international visitors.1
- Visitors spent $158.86 billion in 2025, of which international visitors spent $25.4 billion.1
- Tourism generated $13.6 billion in state and local taxes in 2025 and supported 1,167,473 jobs.2
- 2026 so far: 3.85 million international air arrivals from January to July, 4.3% fewer than a year earlier.3
- 2026 forecast: 275.5 million visitors (up 1.5%) spending $166.5 billion (up 4.8%).1
How many people visit California every year?
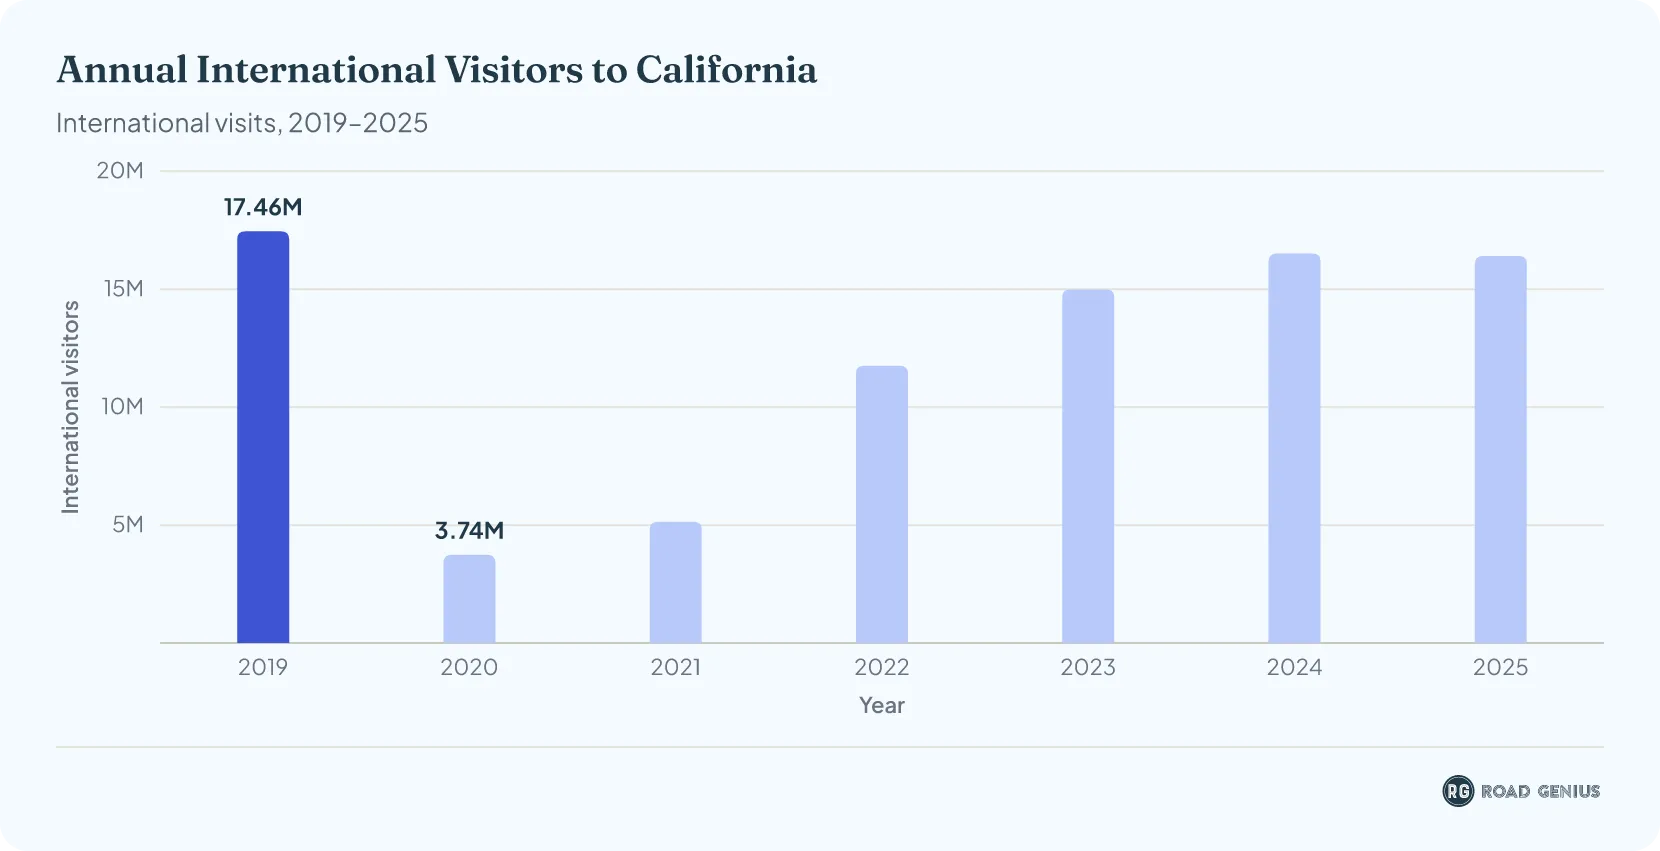
In 2025, California welcomed a total of 16.41 million international tourists.1
- The Golden State welcomed 17.46 million international visitors in 20191.
- However, like other states, California experienced a decline in tourist numbers due to the COVID-19 pandemic, hitting lows of 3.74 million in 2020 and 5.14 million in 2021.4
- In 2022, the visitor count made a remarkable turnaround, reaching upwards of 11.76 million. Following this trend, California received 14.99 million visitors in 2023.4
- California welcomed 16.52 million international visitors in 20241, 1.52 million (10.2%) more than 2023 yet 5.4% below the pre-pandemic 2019 total.
- In 2025, international visits dipped 0.7% to 16.41 million, 6.0% below the 2019 total.
How many people have visited California in 2026 so far?
- From January to July 2026, California recorded 3.85 million nonresident international air arrivals, 4.3% fewer than in the same months of 2025.3
- July was the busiest month so far, with 629,100 arrivals, down 3.4% on July 2025.3
- Canada was the largest source of air arrivals year to date with 564,542 (down 11.5%), while Mexico grew 10.4% to 420,250 and Japan rose 11.4% to 228,002.3
- France (down 19.0%) and South Korea (down 12.5%) posted some of the steepest drops.3
- California's ten busiest airports handled 124.2 million passengers from January to July 2026, 0.4% fewer than a year earlier.5
- These counts cover air arrivals only, so they are not directly comparable with the full-year totals above, which also include travelers crossing by land.
| Month | Air arrivals | Change vs 2025 |
|---|---|---|
| January | 496,265 | −9.1% |
| February | 498,645 | +3.3% |
| March | 561,203 | +3.1% |
| April | 537,218 | −14.2% |
| May | 570,584 | −7.5% |
| June | 560,364 | +0.1% |
| July | 629,130 | −3.4% |
| January–July | 3,853,409 | −4.3% |
Source · NTTO, CIC Research, via Visit California
How many people visited California in 2025?
- California saw 16.41 million international visitors in 2025, a dip of 0.7% from 16.52 million arrivals in 2024.
- This figure remained 6.0% below the pre-pandemic year, 2019.
How many people visited California in 2024?
- The state welcomed 16.52 million international visitors in 2024. This marked a 10.2% increase from 2023 (14.99 million).
How much do tourists spend in California every year?
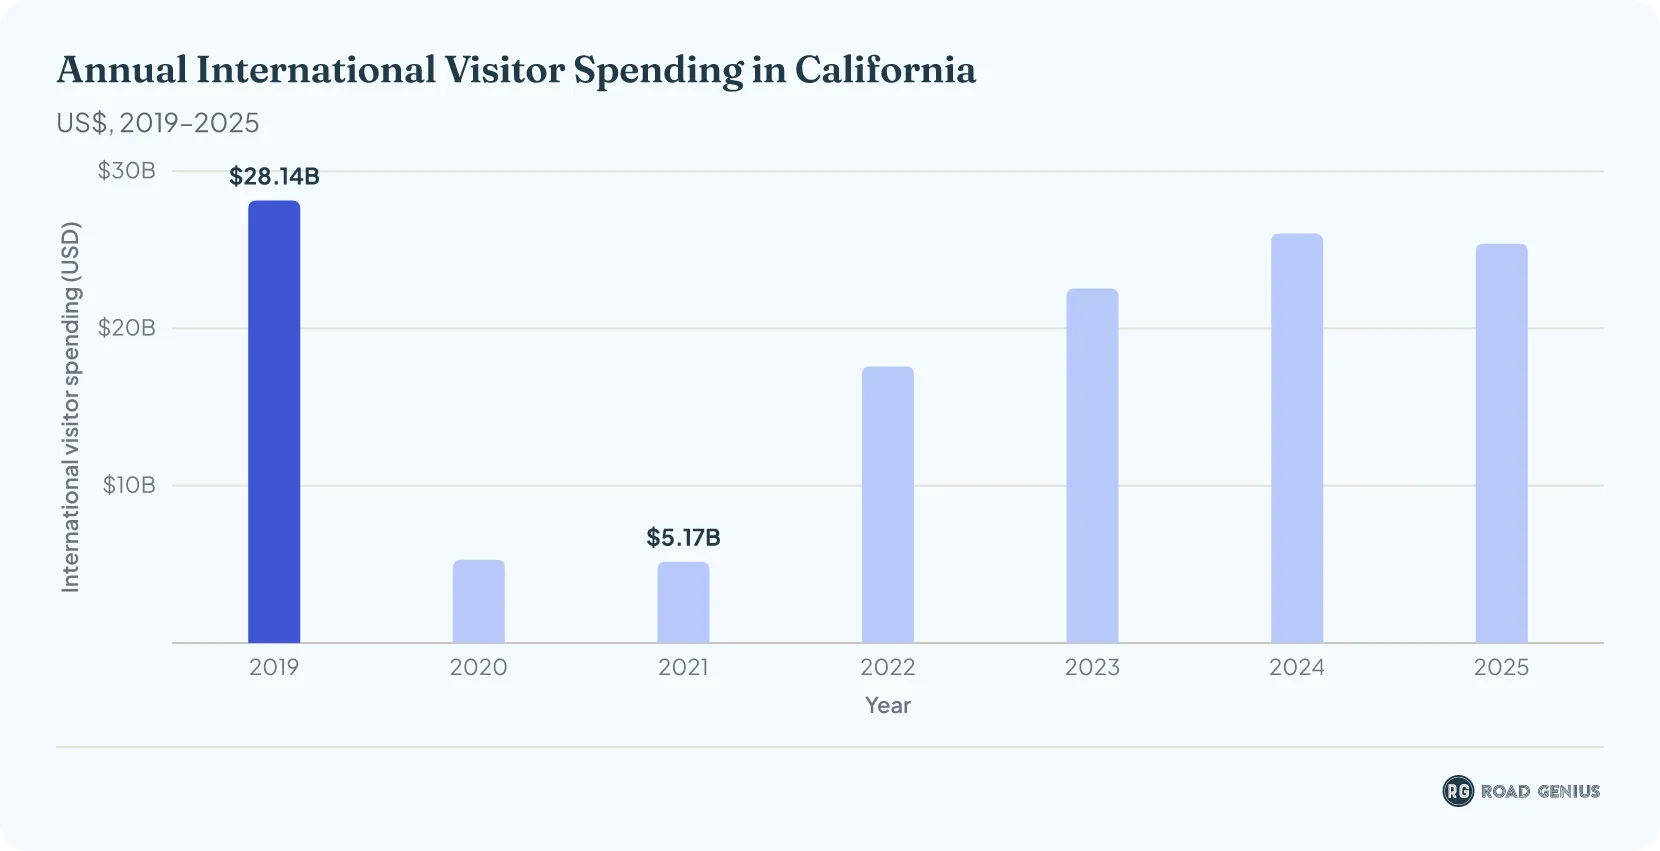
In 2025, international tourists visiting California spent about $25.4 billion.1
- Before the pandemic, international visitors spent $28.14 billion in 2019.4
- The years 2020 and 2021 saw a downturn in spending due to COVID-19, with expenditures falling to $5.3 billion and $5.17 billion, respectively.4
- By 2022, spending rebounded to approximately $17.59 billion but had yet to reach pre-pandemic levels.4
- In 2023, international spending increased by 28% and reached $22.55 billion.4 International visitor spending increased to $26.04 billion in 2024, 15.5% more than 2023 yet 7.5% below the pre-pandemic 2019 level.1
- In 2025, international visitor spending slipped to $25.4 billion, 9.7% below the 2019 level.
How much do tourists spend in California in 2025?
- International visitors in California spent $25.4 billion in 2025, down from $26.04 billion in 2024 and 9.7% below the pre-pandemic level (2019).
- Mexican and Canadian visitors spent the most, at $5.4 billion and $3.0 billion, respectively.1
Where do international visitors to California come from?
Which California cities get the most visitors?
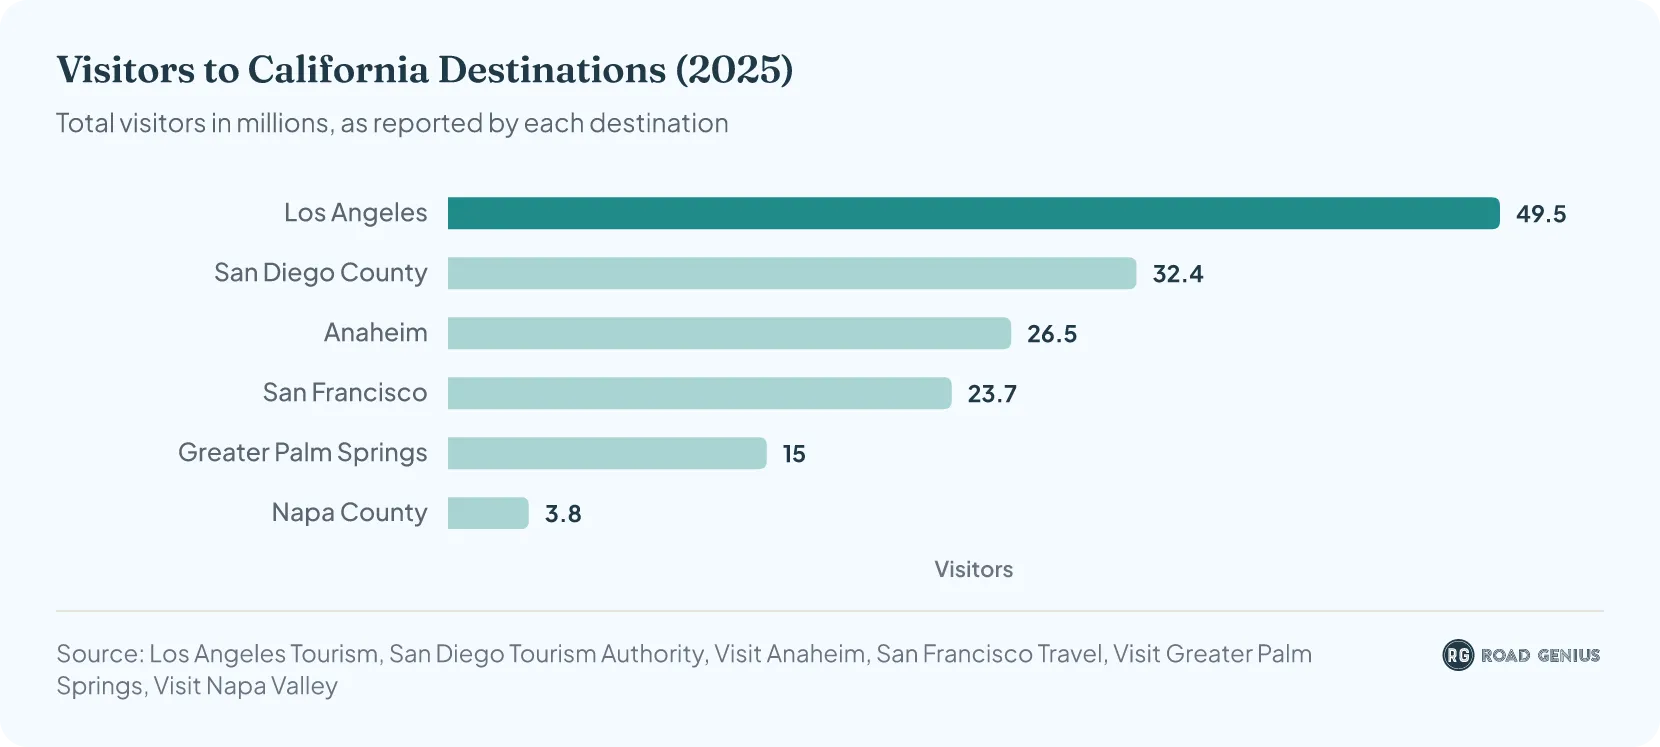
Los Angeles draws the most visitors of any California destination, with 49.5 million in 2025.6
- Los Angeles welcomed 49.5 million visitors in 2025, including 6.4 million international visitors.6
- San Diego County welcomed about 32.4 million visitors in 2025, who spent an estimated $14.4 billion.7
- Anaheim had a record 26.5 million visitors in 2025, who generated $6.8 billion in visitor spending.8
- San Francisco welcomed 23.7 million visitors who spent $9.4 billion in 2025.9
- Greater Palm Springs drew 15.0 million visitors, who spent $7.8 billion in 2025.10
- Napa County welcomed 3.8 million visitors, who spent $2.2 billion in 2025.11
- Each destination counts its own visitors, including day trips, so these totals overlap and cannot be added together.
Impact of Coronavirus on California Tourism
The pandemic cut California’s international visitor numbers by 79% to 3.74 million in 2020, and their spending by 81% to $5.3 billion.
Economic Impacts of Tourism in California
- The tourism sector generated $13.6 billion in state and local tax revenue in 2025, a 3.6% increase from $13.2 billion in 2024.2
- Direct travel-generated employment grew by about 4,350 jobs (0.4%) in 2025, reaching 1,167,473 jobs.2
- Direct travel-generated earnings reached about $66.7 billion in 2025.2
- Travel accounted for about 2.4% of California's GDP in 2025.12
When is the best time to visit California?
- The best time to visit California is April to June and September to October, when temperatures are mild, crowds are smaller, and outdoor conditions are ideal.
- Spring (April–June) brings wildflower blooms and comfortable weather, while autumn (September–October) offers warm days and vineyard harvests.
- Summer (July–August) is popular but often hot and crowded, and winter (December–February) is best for skiing and quieter travel in Southern California.
What are the main reasons people visit California?
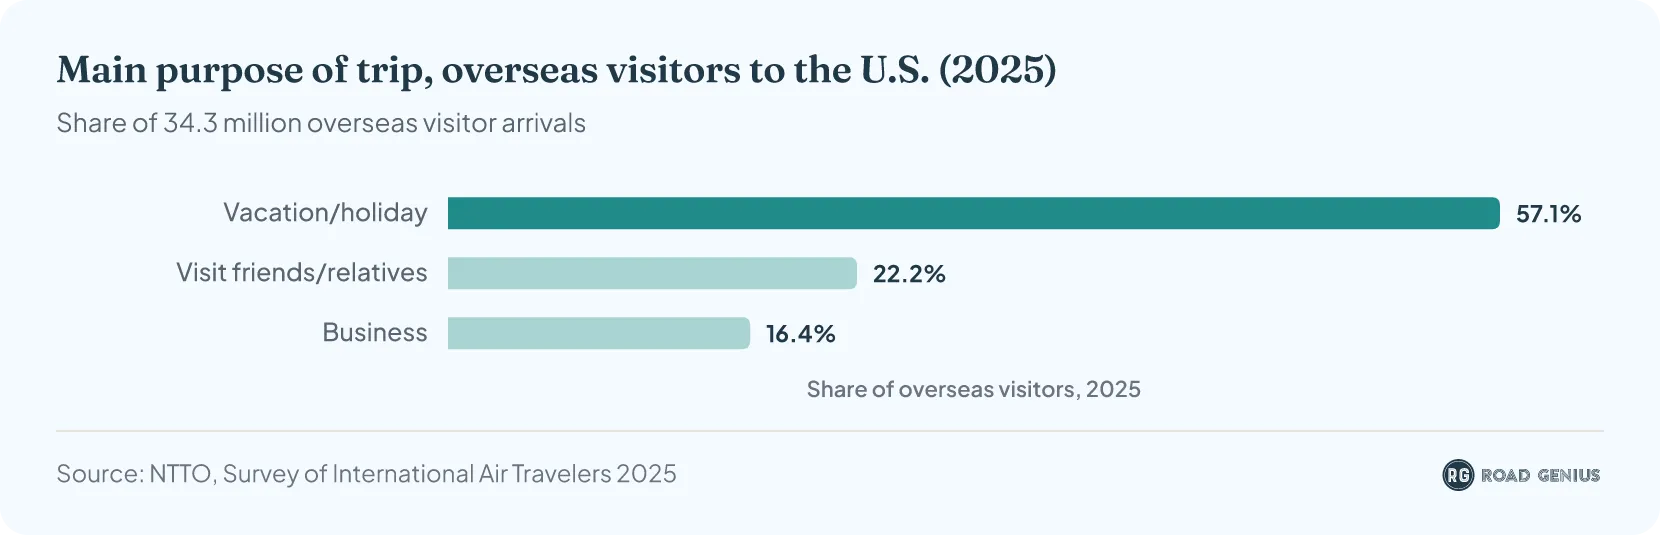
- In 2025, 57.1% of the 34.3 million overseas visitors to the U.S. came mainly for a vacation or holiday, 22.2% to visit friends or relatives and 16.4% for business.13
- Shopping (82.9%) and sightseeing (77.8%) were their most popular activities, followed by national parks and monuments (33.9%).13
- California drew 6.6 million of these overseas visitors, the third-most of any state after Florida and New York.13
- These shares cover overseas visitors to the whole U.S.; the survey's published results do not break trip purpose down for California alone.
- What draws visitors to California varies by market. Mexican travelers are increasingly motivated by sports, entertainment and multi-generational trips.14
- Australians come for iconic Hollywood moments, U.S. major league sports and the classic road trip.15
- For Japanese visitors, Major League Baseball is a major draw, with the "Ohtani Effect" turning Los Angeles into a place of pilgrimage for fans.16
What are the most visited national parks and attractions in California?
Added together, California's nine national parks recorded almost 13 million recreation visits in 2025, up from about 12.2 million in 2024.17
- Golden Gate National Recreation Area was the most visited National Park Service site in California in 2025, with 15,748,676 recreation visits.18
- Yosemite was the state's busiest national park, with 4,278,413 visits in 202518, followed by Joshua Tree with 2.93 million.17
- Sequoia (up 5.3%) and Kings Canyon (up 11.5%) grew in 2025, while Death Valley fell 8.4% to 1.32 million visits.17
- Among theme parks, Disneyland Park in Anaheim was the most visited in California in 2024, with about 17.3 million visitors, followed by Disney California Adventure with 10.1 million.19
- Universal Studios Hollywood drew 8.7 million visitors in 2024, down almost 10% on 2023.19
- Knott's Berry Farm (4.5 million) and SeaWorld San Diego (4.0 million) were next.19
| Recreation visits to California's national parks, 2025 | |||
|---|---|---|---|
| National park | Visits 2025 | Visits 2024 | Change |
| Yosemite National Park | 4,278,413 | 4,121,807 | +3.8% |
| Joshua Tree National Park | 2,932,644 | 2,991,874 | −2.0% |
| Sequoia National Park | 1,378,337 | 1,309,573 | +5.3% |
| Death Valley National Park | 1,320,134 | 1,440,484 | −8.4% |
| Redwood National Park | 1,202,480 | 622,883 | +93.1% |
| Kings Canyon National Park | 779,791 | 699,389 | +11.5% |
| Lassen Volcanic National Park | 504,777 | 357,651 | +41.1% |
| Pinnacles National Park | 343,208 | 354,076 | −3.1% |
| Channel Islands National Park | 227,186 | 262,581 | −13.5% |
Source · National Park Service, NPS Stats
How popular is California as a tourist destination?
California is one of the most popular tourist destinations in the world, consistently recognized for its diverse attractions and travel excellence.
- National Geographic Traveler China Golden Award (2024) – Most Anticipated Destination, the only U.S. destination to receive this honor.20
- Trip.com Group Awards (2024) – Won multiple titles, including Strategic Partnership Destination of the Year and Best Global Partner.20
- Travel + Leisure World’s Best Awards (2025) – The Inn at Mattei’s Tavern in Los Olivos was voted the No. 2 resort in the continental U.S. and the No. 12 hotel in the world.21
- Top U.S. tourism destination (2025) – Still the country’s top tourism destination, with about $159 billion in travel spending.12
Car and campervan rental in California
- Car Rental California
- Campervan Rental California
- Car Rental Los Angeles
- Campervan Rental Los Angeles
- Car Rental San Diego
- Car Rental San Francisco
- Campervan Rental San Francisco
- Car Rental San Francisco to Los Angeles (One-Way)
- Car Rental San Francisco to Las Vegas (One-Way)
- Car Rental San Francisco to San Diego (One-Way)
- Car Rental Los Angeles to Las Vegas (One-Way)
- Car Rental Los Angeles to Palm Springs (One-Way)
California Tourism Statistics: International and Domestic
- International visitor numbers peaked in 2019 at 17.46 million and declined during the pandemic to 3.74 million in 2020. In 2025, international visits stood at 16.41 million.1
- Domestic visitation, which was at 268.1 million in 2019, also dropped in 2020 to 136.9 million but rebounded to 255.0 million in 20251.
- Total visitor numbers, combining international and domestic, followed a similar trend, with a decrease to 140.6 million in 2020 and a recovery to 271.4 million in 20251.
| International and Domestic Visitors in California | |||
|---|---|---|---|
| Year | International | Domestic | Total |
| 2019 | 17,457,200 | 268,100,000 | 285,600,000 |
| 2020 | 3,743,600 | 136,900,000 | 140,600,000 |
| 2021 | 5,141,200 | 208,300,000 | 213,400,000 |
| 2022 | 11,756,400 | 247,300,000 | 259,100,000 |
| 2023 | 14,994,400 | 249,100,000 | 264,100,000 |
| 2024 | 16,516,400 | 253,000,000 | 269,500,000 |
| 2025 | 16,407,100 | 255,000,000 | 271,400,000 |
How does California compare with other states?
California welcomed 271.4 million visitors in 20251, who spent $158.86 billion2, the most visitor spending of any state compared here.
- New York State counted more visitors, 321.2 million in 2025, but they spent $97.6 billion.22
- Florida welcomed 143.3 million visitors in 202523, and out-of-state visitors spent $134.9 billion in 2024.24
- In Texas, direct travel spending reached $98.7 billion in 2025.25
- Nevada welcomed 49.0 million visitors, who spent $54.8 billion in 2025.26
- Hawaii had about 9.64 million visitors in 2025, who spent $21.75 billion, according to preliminary figures.27
- States count visitors differently. Some include day trips and Texas publishes out-of-state and in-state travelers separately, so the totals are not strictly comparable.
| Visitors and visitor spending by state | |||
|---|---|---|---|
| State | Visitors | Visitor spending | Year |
| California | 271.4 million | $158.86 billion | 2025 |
| Florida | 143.3 million | $134.9 billion | 2025 (spending 2024) |
| Texas | 52 million+ out-of-state and international | $98.7 billion | 2025 |
| New York | 321.2 million | $97.6 billion | 2025 |
| Nevada | 49.0 million | $54.8 billion | 2025 |
| Hawaii | 9.64 million | $21.75 billion | 2025 (preliminary) |
Source · Sources: Visit California, Dean Runyan Associates, VISIT FLORIDA, Travel Texas, Empire State Development, Travel Nevada, Hawaii DBEDT
International and Domestic Tourists Spending
- International spending in California was $28.14 billion in 2019, but due to the pandemic, it fell to $5.3 billion in 2020. It rose again to $26.04 billion in 2024 and stood at $25.4 billion in 2025.1
- Domestic spending showed a similar trend. Domestic visitors spent $116.71 billion in 2019, but this dropped to $63 billion in 20204 and climbed back to $133.4 billion in 2025.1
- Overall, total spending, which includes both international and domestic, hit a low of $68.26 billion in 20204 but reached $158.86 billion in 2025.2
| International and Domestic Spending in California (US$) | |||
|---|---|---|---|
| Year | International | Domestic | Total |
| 2019 | $28,140,000,000 | $116,710,000,000 | $144,850,000,000 |
| 2020 | $5,300,000,000 | $62,960,000,000 | $68,260,000,000 |
| 2021 | $5,170,000,000 | $99,850,000,000 | $105,030,000,000 |
| 2022 | $17,590,000,000 | $124,920,000,000 | $142,280,000,000 |
| 2023 | $22,550,000,000 | $130,150,000,000 | $151,110,000,000 |
| 2024 | $26,040,000,000 | $130,200,000,000 | $156,190,000,000 |
| 2025 | $25,400,000,000 | $133,400,000,000 | $158,860,000,000 |
More Statistics
- Colorado Tourism Statistics
- Disneyland Tourism Statistics
- Massachusetts Tourism Statistics
- Maui Tourism Statistics
- Nashville Tourism Statistics
- Oregon Tourism Statistics
- Texas Tourism Statistics
- Universal Orlando Tourism Statistics
- United States Tourism Statistics
- Utah Tourism Statistics
- Virginia Tourism Statistics
- Washington Tourism Statistics
Top Attractions in California
California is home to a variety of must-see attractions that cater to all sorts of travelers.
- Disneyland: The iconic theme park in Anaheim offers entertainment for the whole family.
- Yosemite National Park: Known for stunning waterfalls, immense sequoias, and majestic rock formations like El Capitan.
- Golden Gate Bridge: A marvel of engineering and an iconic symbol of San Francisco.
- Universal Studios Hollywood: A theme park that offers an experience of the magic of filmmaking with a behind-the-scenes look at Hollywood.
- San Diego: Known for its lovely sunny weather, San Diego Zoo, Balboa Park, and numerous beaches.
Frequently asked questions
How many tourists visit California each year?
About 271.4 million people visited California in 2025, including 16.41 million international visitors.1
Which country sends the most tourists to California?
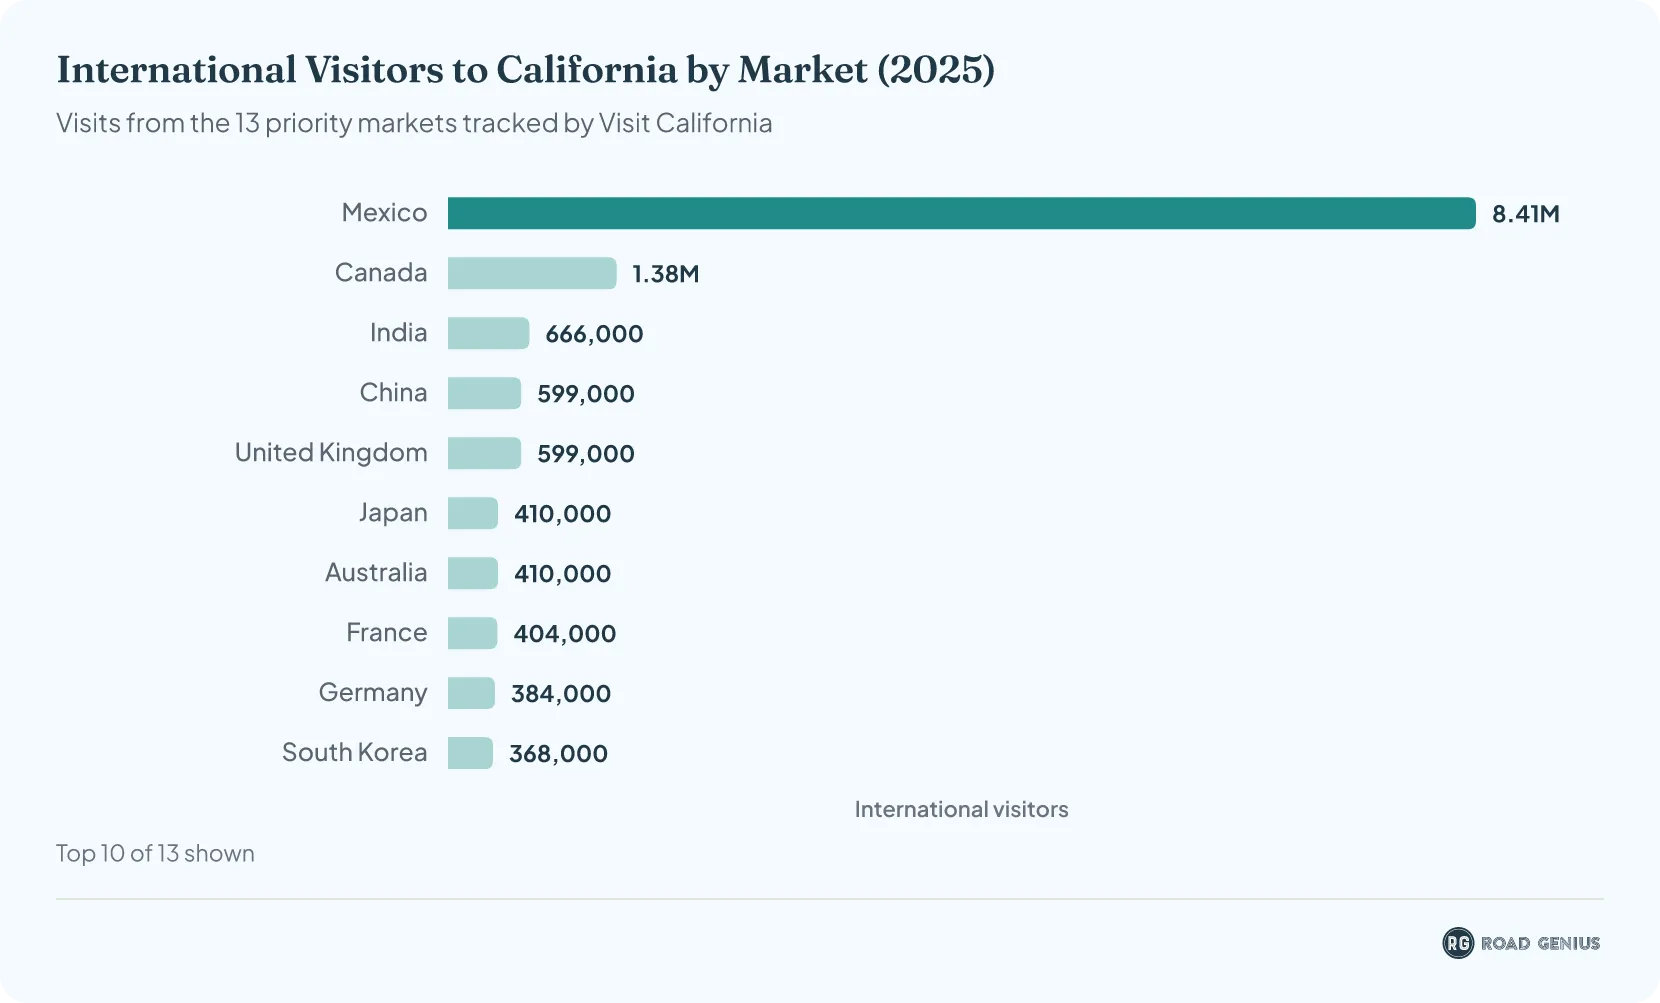
Mexico, with 8.41 million visitors in 2025, followed by Canada with 1.38 million.1
What is the most visited city in California?
Los Angeles, with 49.5 million visitors in 2025.6
What is the most visited national park in California?
Yosemite, with 4,278,413 recreation visits in 2025.18
References
- Visit California / Tourism Economics — California Visitation and Spend Forecast (May 2026) · industry.visitcalifornia.com ↑ b c d e f g h i j k l m n o p q r s t
- Visit California / Dean Runyan Associates — Economic Impact of Travel in California (2025) · industry.visitcalifornia.com ↑ b c d e f g
- Visit California / NTTO — International Arrivals to California (July 2026) · industry.visitcalifornia.com ↑ b c d e f
- Visit California / Tourism Economics — California Visitation and Spend Forecast (May 2025) · industry.visitcalifornia.com ↑ b c d e f g h
- Visit California — Airport Passenger Traffic, California's Top 10 Airports (July 2026) · industry.visitcalifornia.com ↑
- Los Angeles Tourism — Visitors to Los Angeles Generated $42.6 Billion in Business Sales and Supported More Than 530,000 Jobs in 2025 (press release, 29 July 2026) · discoverlosangeles.com ↑ b c
- San Diego Tourism Fast Facts · sandiego.org ↑
- Anaheim's Record Tourism Year Reflects Rise of the "Always-On" Destination · Visit Anaheim ↑
- San Francisco Travel Reports Visitor Spending Milestone and Projects Continued Growth in 2026 (2025 results) · sftravel.com ↑
- Economic Impact of Visitors to Greater Palm Springs 2025 · assets.simpleviewinc.com ↑
- Visit Napa Valley Releases 2025 Visitor Profile and Economic Impact Data · Visit Napa Valley ↑
- FOX40 — California still top tourist destination in U.S. (Visit California / Dean Runyan 2025 report) · aol.com ↑ b
- 2025 Survey of International Air Travelers Results (NTTO) · trade.gov ↑ b c
- Visit California — Mexico Market Profile (July 2026) · industry.visitcalifornia.com ↑
- Visit California — Australia Market Profile (July 2026) · industry.visitcalifornia.com ↑
- Visit California — Japan Market Profile (July 2026) · industry.visitcalifornia.com ↑
- National Park Visitation Statistics · irma.nps.gov ↑ b c
- National Park Service Records More Than 323 Million Recreation Visits in 2025 (NPS news release, 13 March 2026) · nps.gov ↑ b c
- TEA Global Experience Index 2024 — Global Attractions Attendance Report (full report PDF) · Themed Entertainment Association ↑ b c
- California shines in China, winning five prestigious awards, including National Geographic Traveler's Golden Award · industry.visitcalifornia.com ↑ b
- Auberge Collection Triumphs on Travel + Leisure's 2025 World's Best Awards List (press release) · auberge.com ↑
- Empire State Development / Tourism Economics: Economic Impact of Visitors in New York 2025 — Statewide (published August 2026) · esd.ny.gov ↑
- VISIT FLORIDA — Q1 2026 Florida Tourism Remains Strong; Updated Data Shows Higher-Than-Previously-Estimated Canadian Visitation in 2025 (revised 2025 estimates: 143.33 million visitors, 3.17 million Canadians) · VisitFlorida ↑
- Executive Office of the Governor of Florida — Tourism in Florida Delivers $133.6 Billion in Economic Impact, Nearly $2,000 per Household in Tax Savings in 2024 · flgov.com ↑
- Travel Spending in Texas 2025 · gov.texas.gov ↑
- 2025 Economic Impact of Visitors to Nevada · travelnevada.biz ↑
- December 2025 Visitor Statistics, with 2025 year-to-date totals (Hawaii DBEDT, preliminary) · files.hawaii.gov ↑

