

 Popular Countries
 24/7 Support

Updated
Maui welcomed 2.53 million visitors in 2025, up 7.6% on 2024, and they spent $6.07 billion.1 On an average day, about 54,500 visitors were on the island. From January to September 2026, arrivals rose 6.4% to 2.01 million.2 Known as the “Valley Isle,” Maui is the second most visited of the Hawaiian islands after Oʻahu.
How many people visit Maui each year?
In 2025, about 2.53 million international and domestic tourists visited Maui1. From January to September 2026, arrivals reached 2.01 million, up 6.4% on the same months of 2025.2
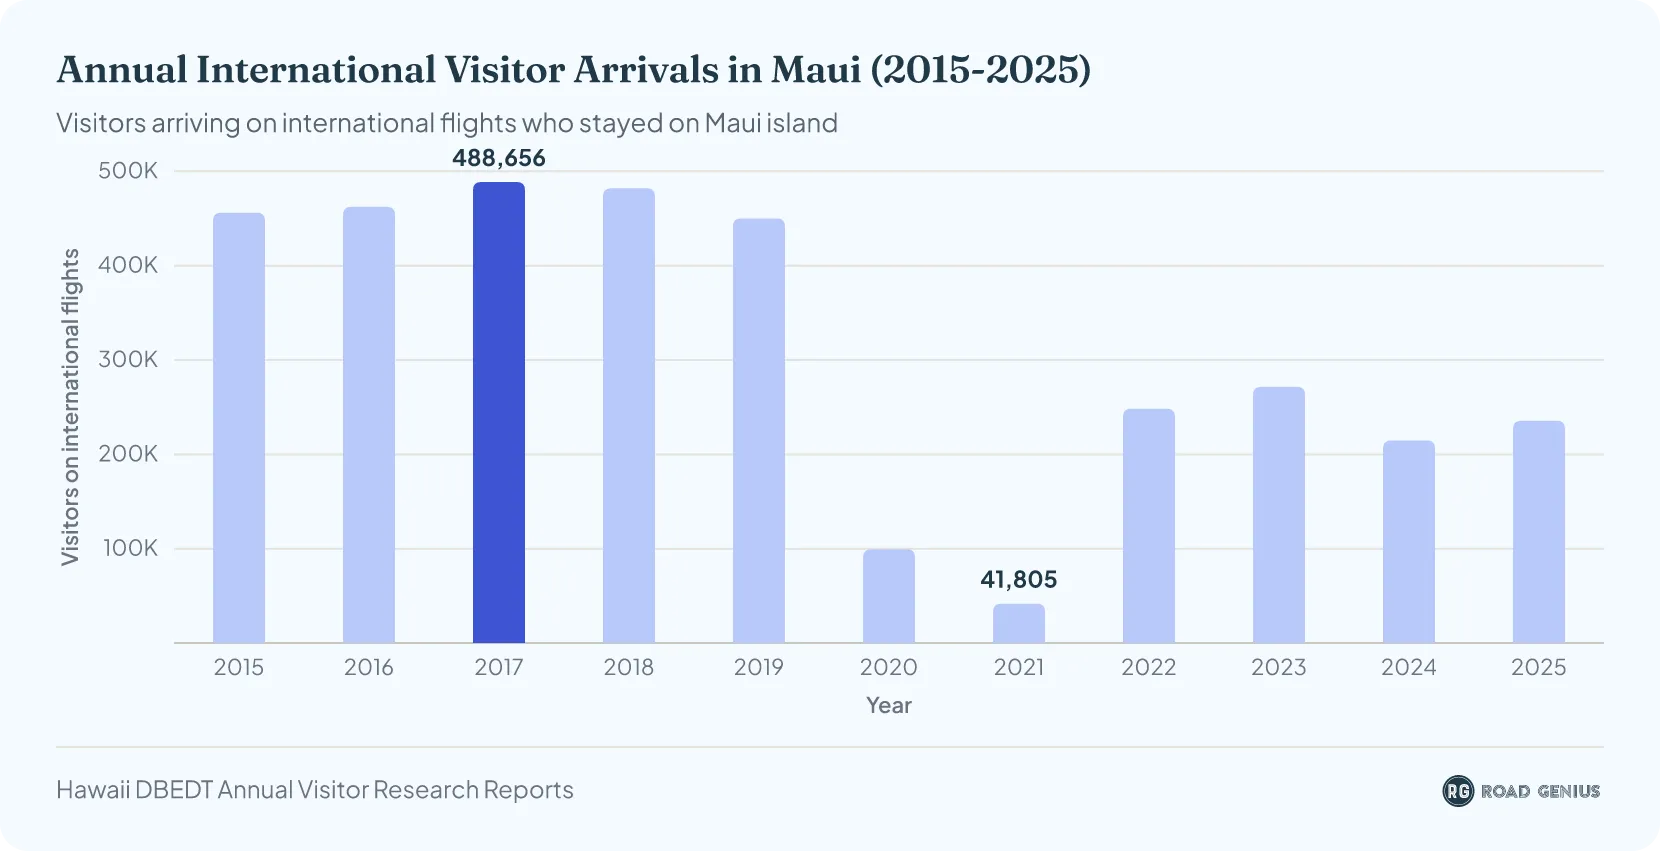
- Maui attracted 450,107 international visitors in 2019. When the pandemic hit in 2020, that number fell 78% to 99,404.3
- International arrivals fell further to 41,805 in 2021, then recovered to 248,449 in 2022.4
- They rose again to 271,565 in 2023,5 though that was still 40% below the pre-pandemic level of 2019.3
- In 2024, international arrivals fell 20.9% to 214,787.5
- In 2025, international arrivals rose 9.7% to 235,634.1
How many tourists have visited Maui in 2026 so far?
- Maui welcomed 2.01 million visitors in the first nine months of 2026, 6.4% more than in the same period of 2025.2
- September 2026 arrivals rose 10.5% year on year to 190,404.2
- International arrivals over the nine months were almost flat at 163,533, up 0.4%.2
- Visitors spent $4.71 billion on Maui in the first nine months of 2026, up 7.2%, and the average visitor spent $336 per day, up 12.8%.2
Note: These are preliminary figures from the Hawaii Department of Business, Economic Development and Tourism (DBEDT) and may change in later releases.
How many tourists visited Maui in 2025?
- Maui received 2.53 million tourists in 2025, 7.6% more than in 2024.1
- Of these, 2.30 million arrived on domestic flights and 235,634 on international flights.1
Note: These are final figures from the Hawaii Department of Business, Economic Development and Tourism (DBEDT) 2025 Annual Visitor Research Report.
| Visitor Arrivals in 2025 | |
|---|---|
| Month | Number of Visits |
| January | 203,663 |
| February | 200,353 |
| March | 237,498 |
| April | 207,986 |
| May | 192,392 |
| June | 223,145 |
| July | 237,610 |
| August | 213,639 |
| September | 172,327 |
| October | 189,658 |
| November | 209,314 |
| December | 243,887 |
How many people visited Maui in 2024?
Maui welcomed 2.35 million visitors in 2024: 2.14 million domestic travelers and 214,787 international tourists.5
How many tourists are in Maui on any given day?
- On an average day in 2025, about 54,500 visitors were on Maui, up 6.7% from 51,100 in 2024.1
- That is about half as many as on Oʻahu, which averaged 107,479 visitors a day in 2025.1
- From January to September 2026, the daily average fell 4.9% to about 51,300: arrivals rose, but visitors stayed 7.0 days on average, down from 7.8 days a year earlier.2
Note: The 2026 figures are preliminary and may change in later DBEDT releases.
How much do tourists spend in Maui every year?
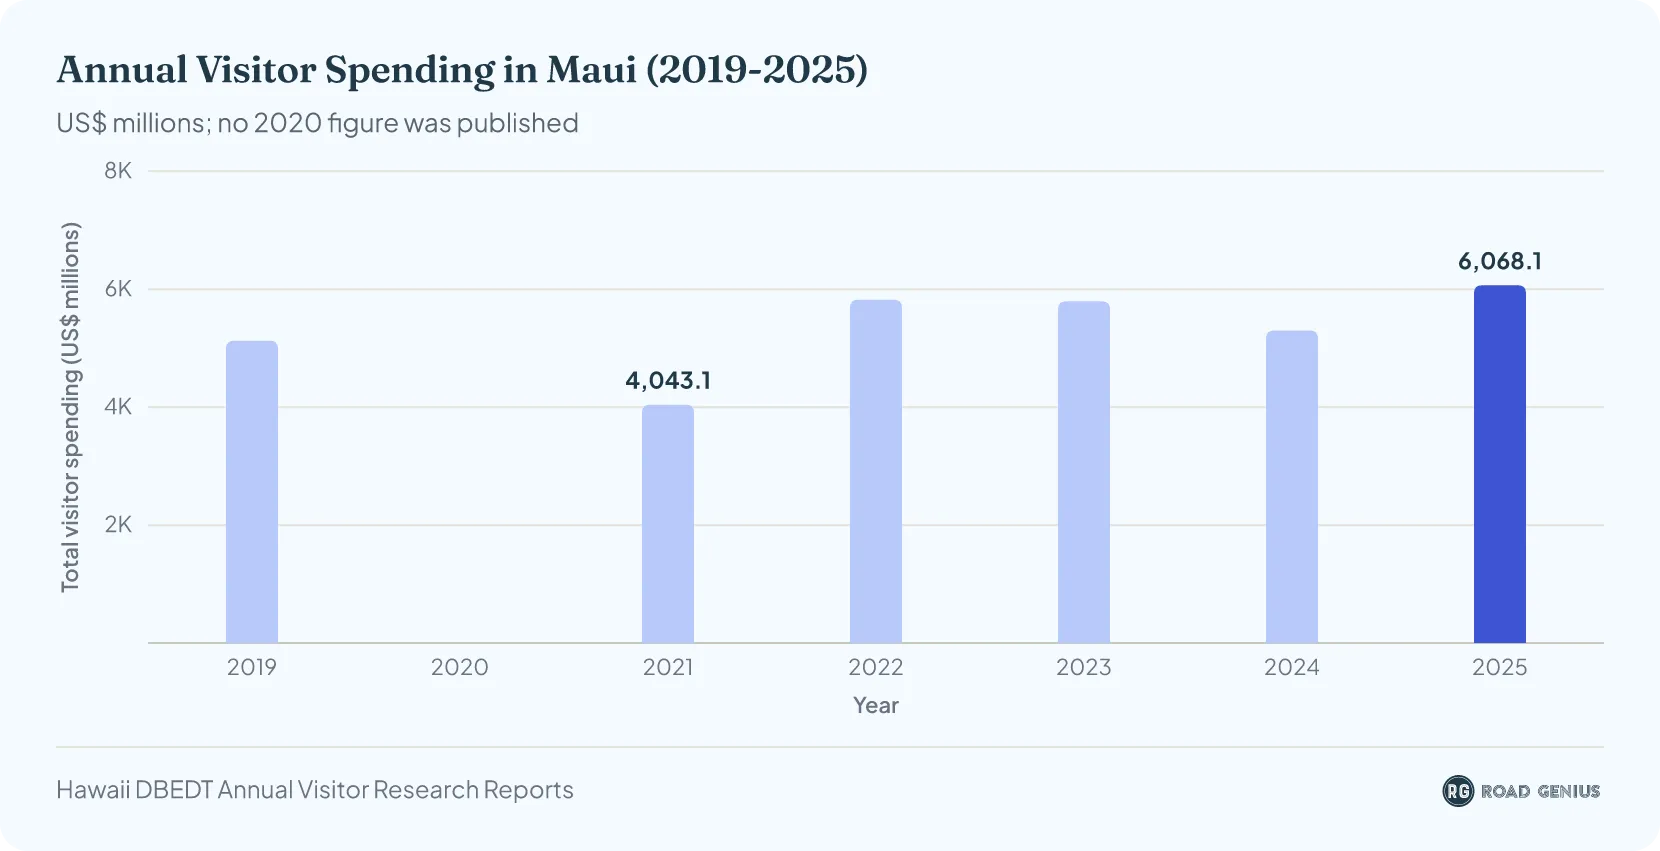
Visitors spent $6.07 billion on Maui in 2025, up 14.5% on 2024.1
- In 2019, visitor spending on Maui came to $5.13 billion.3
- Figures for 2020 were not published.3
- Spending reached $4.04 billion in 2021, then jumped 44% to $5.82 billion in 2022.4
- Visitors spent $5.80 billion in 2023, about 13.0% more than in 2019.5
- In 2024, total visitor spending dropped by 8.5% to $5.30 billion.5
How much does it cost to visit Maui?
- Visitors to Maui spent an average of $305 per person per day in 20251, covering lodging, food, transportation, and activities. At that rate, a one-week trip costs about $2,135 per person. In the first nine months of 2026, visitors spent $336 a day and about $2,341 per trip.2
Which countries send the most visitors to Maui?
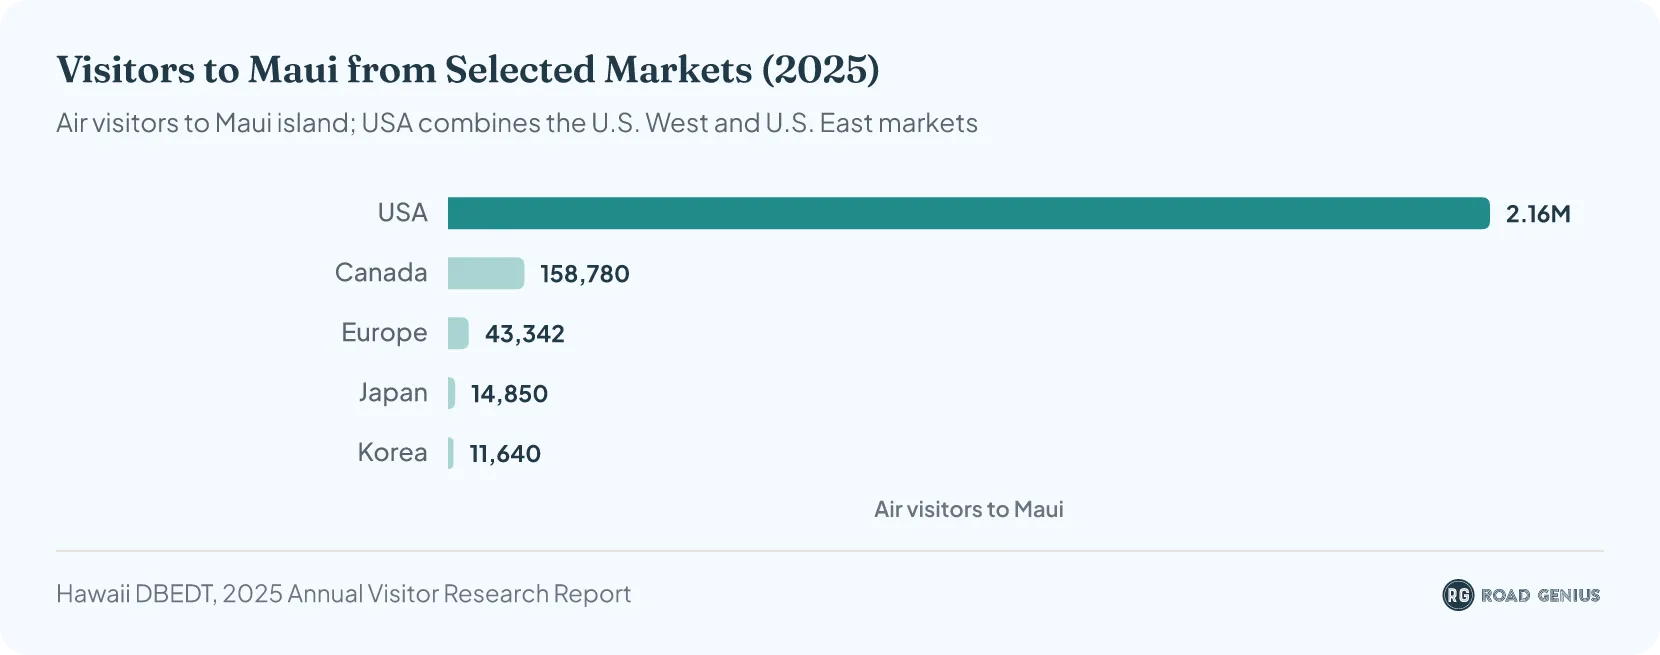
In 2025, most of Maui's visitors came from the USA, followed by Canada, with Europe, Japan and Korea well behind.
How long do visitors stay in Maui, and where do they stay?
Has Maui tourism recovered since the 2023 Lahaina wildfire?
Partly. Visitor numbers fell from 2.92 million in 20224 to 2.50 million in 2023 and 2.35 million in 20245, then rose to 2.53 million in 2025.1 That is still about 17% below the 3.06 million visitors of 2019.3 Spending has recovered faster: visitors spent $6.07 billion in 20251, above the 2019 level of $5.13 billion.3 In 2026, arrivals are running 6.4% ahead of 2025 after nine months.2
What did the 2023 wildfire cost Maui businesses?
- The wildfire cost Maui businesses about $2.7 million a day in lost revenue and affected more than 800 businesses and 7,000 employees. Counting both business closures and reduced visitor spending, losses were estimated at $11 million a day.6
- Airlines canceled 88 transpacific flights in August, and daily arrivals at Kahului Airport fell from 7,000 to 2,000, a drop of more than 70%.6
- The loss of renter-occupied homes in Lahaina wiped out an estimated $2 million a month in rental income, and weekly unemployment claims jumped from 130 to more than 4,400 in the weeks after the fire.6
What are the busiest and quietest months in Maui?
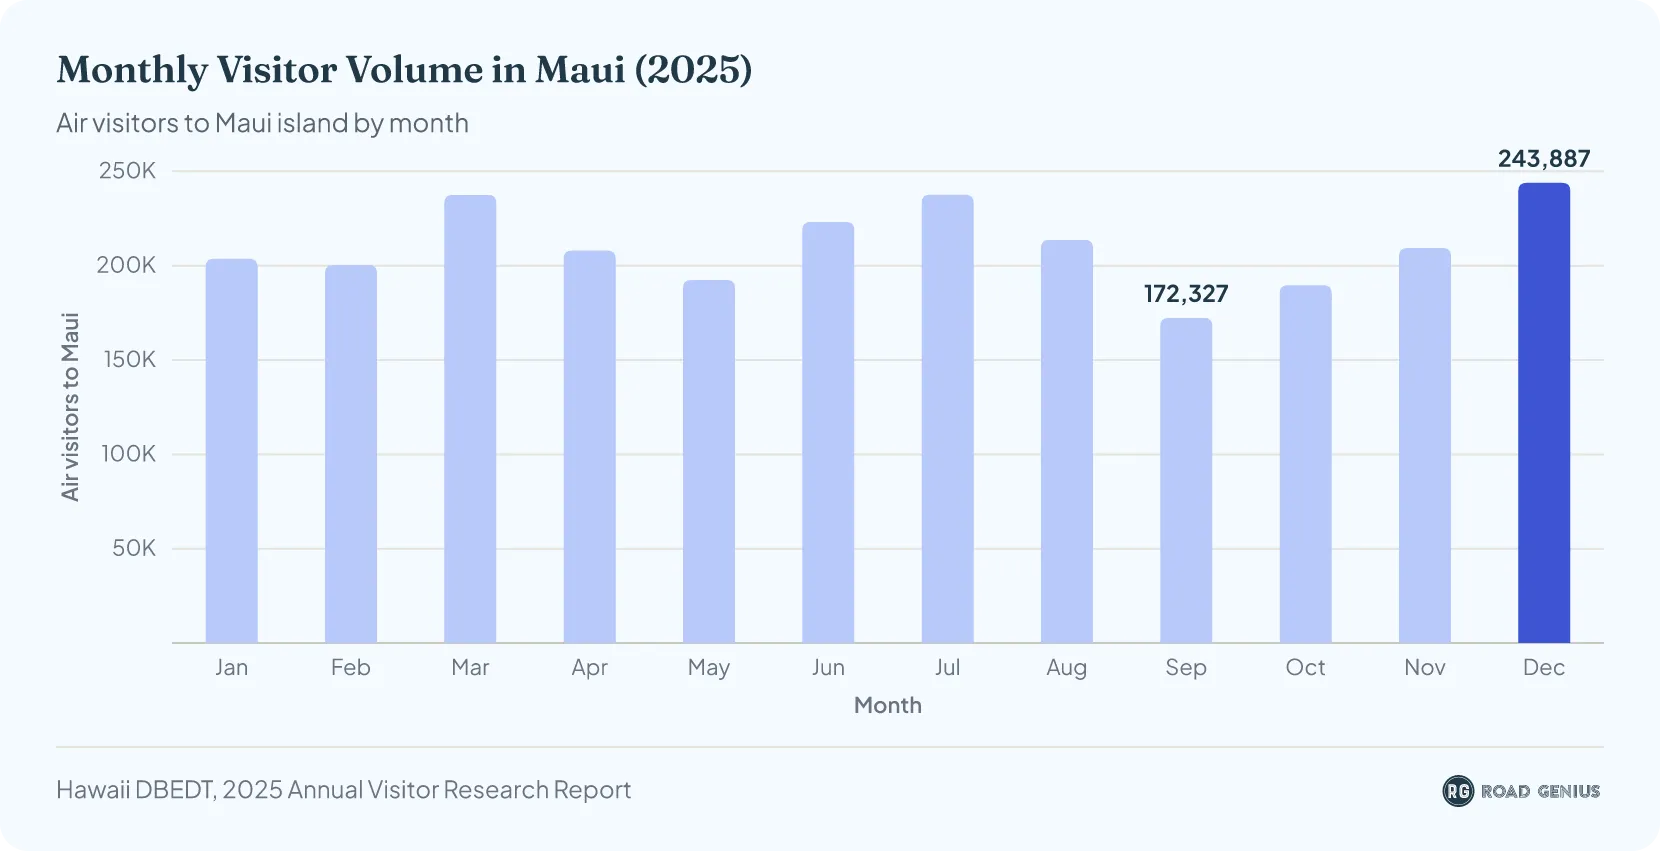
- December was the busiest month in 2025, with 243,887 visitors, followed by July with 237,610.1
- March (237,498) and June (223,145) came next.1
- August rounded out the top five with 213,639 visitors.1
- The quietest month was September, with 172,327 visitors, followed by October (189,658) and May (192,392).7
When is the best time to visit Maui?
The best time to visit Maui for fewer crowds is September and October or May. These were the three quietest months in the 2025 visitor figures above, the weather is still pleasant, and accommodation and activities usually cost less than in the peak seasons.
- Spring (April–May): Warm, comfortable weather makes this a good time for beaches, waterfalls, and hiking trails. May is the quieter of the two months.
- Fall (September–November): Mild temperatures and calmer conditions suit snorkeling and scenic drives. September and October are the quietest months of the year, while November is busier.
- Summer (June–August): Sunny days and warm ocean water are ideal for swimming and water sports, but this is also the busiest and most expensive season.
- Winter (December–March): Cooler and rainier, particularly in the north and east, but popular for whale watching and cultural festivals.
Why do people visit Maui?
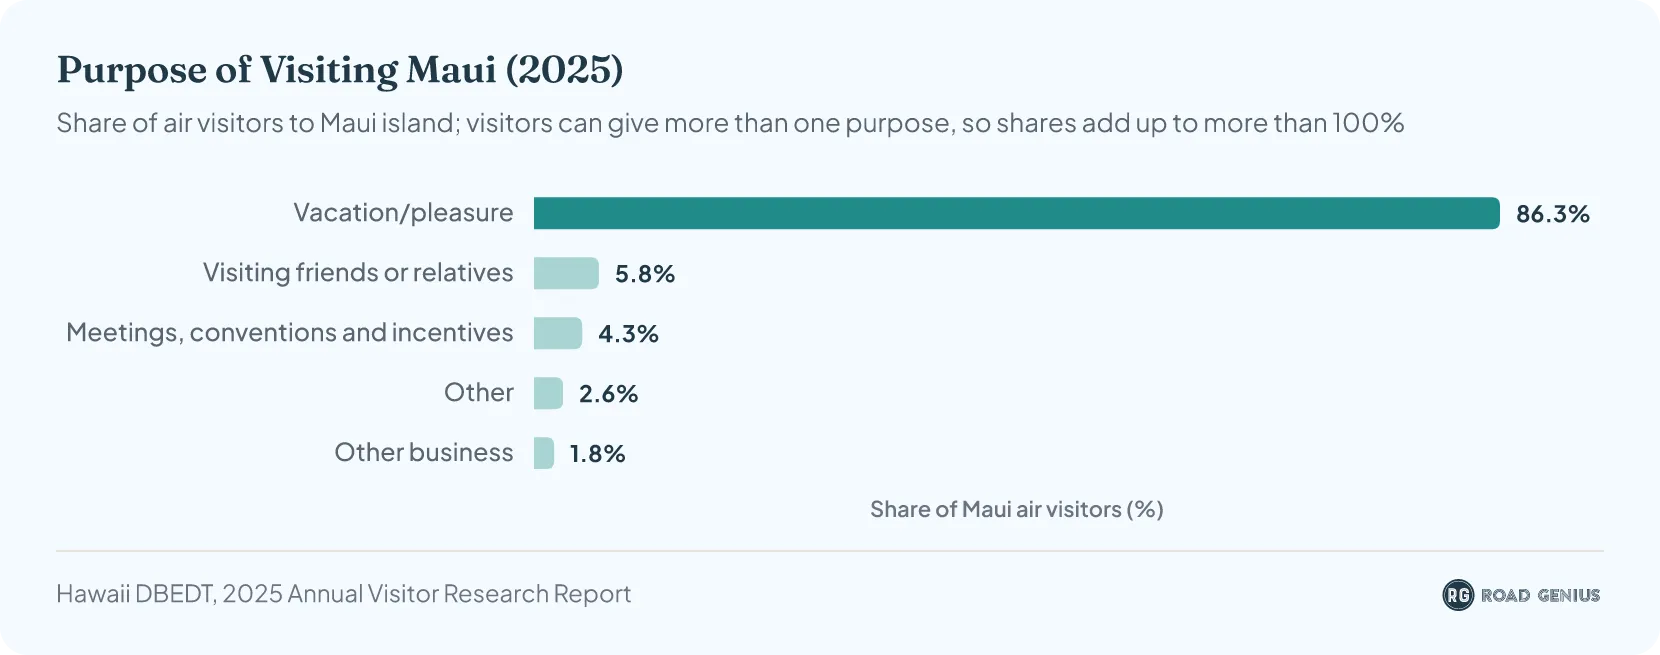
Most people come to Maui on vacation.
- In 2025, 86.3% of visitors came for vacation or pleasure.1
- Others came to visit friends and relatives (5.8%), attend meetings and conventions (4.3%) or travel for business (1.8%).1
- About 2.6% came for other reasons.1 Visitors can give more than one reason, so the shares add up to slightly more than 100%.
Car Rental in Maui and Hawaii
How many domestic and international tourists visit Maui?
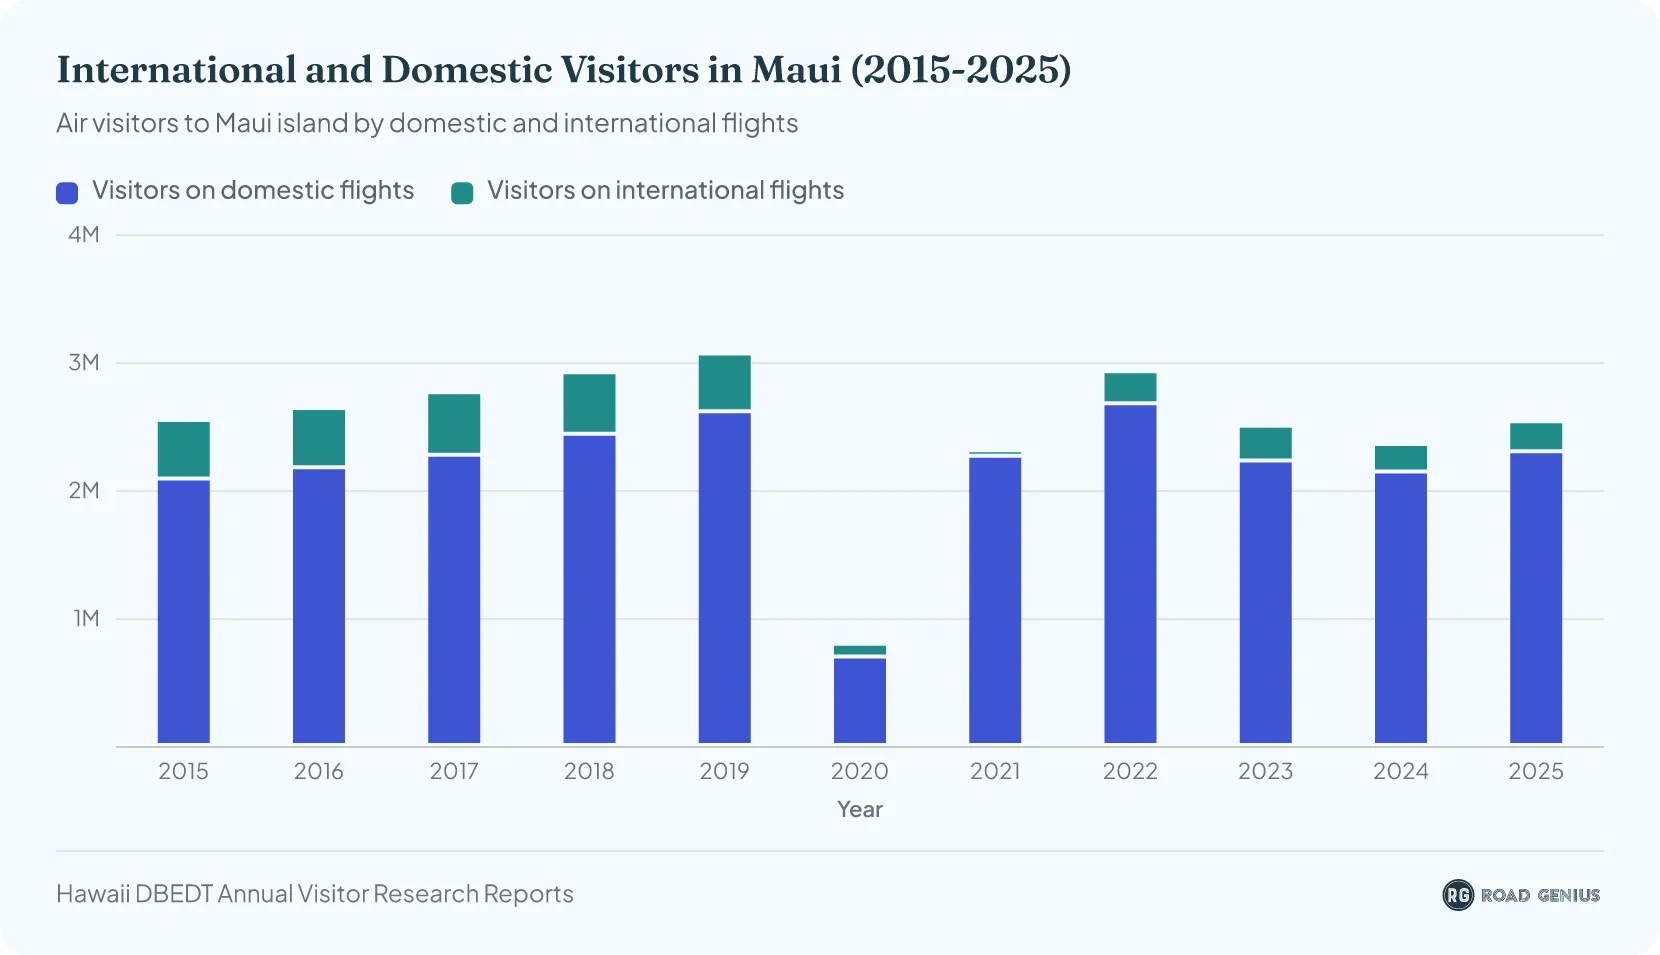
In 2025, 2.30 million of Maui's visitors were domestic travelers, 91% of the total, while 235,634 were international visitors.1
- In 2019, Maui welcomed 3.06 million domestic and international visitors.3
- When the pandemic struck in 2020, that number plunged to 792,602.3
- Maui received 2.30 million tourists in 2021, even as a new COVID variant emerged. Domestic arrivals bounced back to 2.26 million, but international arrivals stayed low at 41,805.4
- Visitor numbers climbed to 2.92 million in 2022,4 then fell to 2.50 million in 2023 after the Lahaina wildfire.5
- Arrivals slipped to 2.35 million in 20245 before rising to 2.53 million in 2025.1
How does Maui compare with the other Hawaiian islands?
Maui was Hawaii's second most visited island in 2025 after Oʻahu, and its visitors spent more per trip than on any of the other major islands.1
- Oʻahu: 5.67 million visitors spent $9.35 billion, about $1,650 per trip, staying 6.9 days on average.1
- Maui: 2.53 million visitors spent $6.07 billion, about $2,397 per trip, staying 7.9 days on average.1
- Hawaiʻi Island: 1.72 million visitors spent $3.20 billion, about $1,853 per trip, staying 7.5 days on average.1
- Kauaʻi: 1.41 million visitors spent $2.94 billion, about $2,091 per trip, staying 7.4 days on average.1
- Most of Maui's US visitors come from the western states: 1.42 million arrived from the US West in 2025, against 748,349 from the US East.1
More Statistics
- California Tourism Statistics
- Dallas Tourism Statistics
- Los Angeles Tourism Statistics
- Nashville Tourism Statistics
- New Jersey Tourism Statistics
- Niagara Falls Tourism Statistics
- Pennsylvania Tourism Statistics
- Seattle Tourism Statistics
- Universal Orlando Tourism Statistics
- US Open Tourism Statistics
- Washington DC Tourism Statistics
- Yellowstone National Park Tourism Statistics
How popular is Maui as a tourist destination?
What are the top attractions in Maui?
Haleakalā National Park recorded 853,711 recreation visits in 2025, up 16.6% from 732,477 in 2024.10
- Snorkeling and Diving: Explore Molokini Crater’s clear waters and marine life, and Turtle Town for Hawaiian green sea turtles.
- Scenic Drives: The Road to Hana winds past stops such as Waiʻanapanapa State Park and the Seven Sacred Pools.
- Hiking and Nature: Watch the sunrise and hike varied trails in Haleakalā National Park, or explore the lush valley and historic sites of Iao Valley State Park.
- Cultural Experiences: Enjoy traditional Hawaiian culture at a luau, learn about Maui’s history at the Bailey House Museum in Wailuku, or browse the art galleries of upcountry Makawao.
- Wildlife Watching: From December to April, whale-watching tours offer sightings of migrating humpback whales.
- Adventure Activities: Take a surfing lesson, go ziplining, or book an ATV tour.
- Relaxation and Leisure: Unwind on Kaanapali or Wailea Beach, or book a spa treatment at one of the luxury resorts.
- Unique Experiences: Visit Ali’i Kula Lavender Farm, tour the Hali’imaile Pineapple Plantation, or wander laid-back Paia Town.
References
- 2025 Annual Visitor Research Report (Hawaii DBEDT) · files.hawaii.gov ↑ b c d e f g h i j k l m n o p q r s t u v w x y z a2 b2 c2 d2 e2
- September 2026 Visitor Statistics, with 2026 year-to-date totals (Hawaii DBEDT, preliminary) · files.hawaii.gov ↑ b c d e f g h i
- 2020 Annual Visitor Research Report (Hawaii DBEDT) · files.hawaii.gov ↑ b c d e f g h
- 2022 Annual Visitor Research Report (Hawaii DBEDT) · files.hawaii.gov ↑ b c d e
- 2024 Annual Visitor Research Report (Hawaii DBEDT) · files.hawaii.gov ↑ b c d e f g h
- Maui Wildfire Impacts Economic Recovery (Hawaii DBEDT news release, 6 September 2023) · governor.hawaii.gov ↑ b c
- 2025 Annual Visitor Research Report — data tables (Hawaii DBEDT) · files.hawaii.gov ↑
- The Best Islands in the United States: 2026 Readers’ Choice Awards — Condé Nast Traveler · cntraveler.com ↑
- The Best Islands in the U.S.: 2023 Readers’ Choice Awards — Condé Nast Traveler (archived copy) · cntraveler.com ↑
- Haleakalā National Park monthly recreation visits, 2024–2025 — NPS Visitor Use Statistics · irma.nps.gov ↑
