

 Popular Countries
 24/7 Support
Published
Oregon is considered to be a leading U.S. tourism destination, with its popularity driven by a wide range of natural landscapes, including the Pacific coastline, volcanic mountains and high desert areas. It is particularly associated with nature-focused travel.
How many people visit Oregon each year?
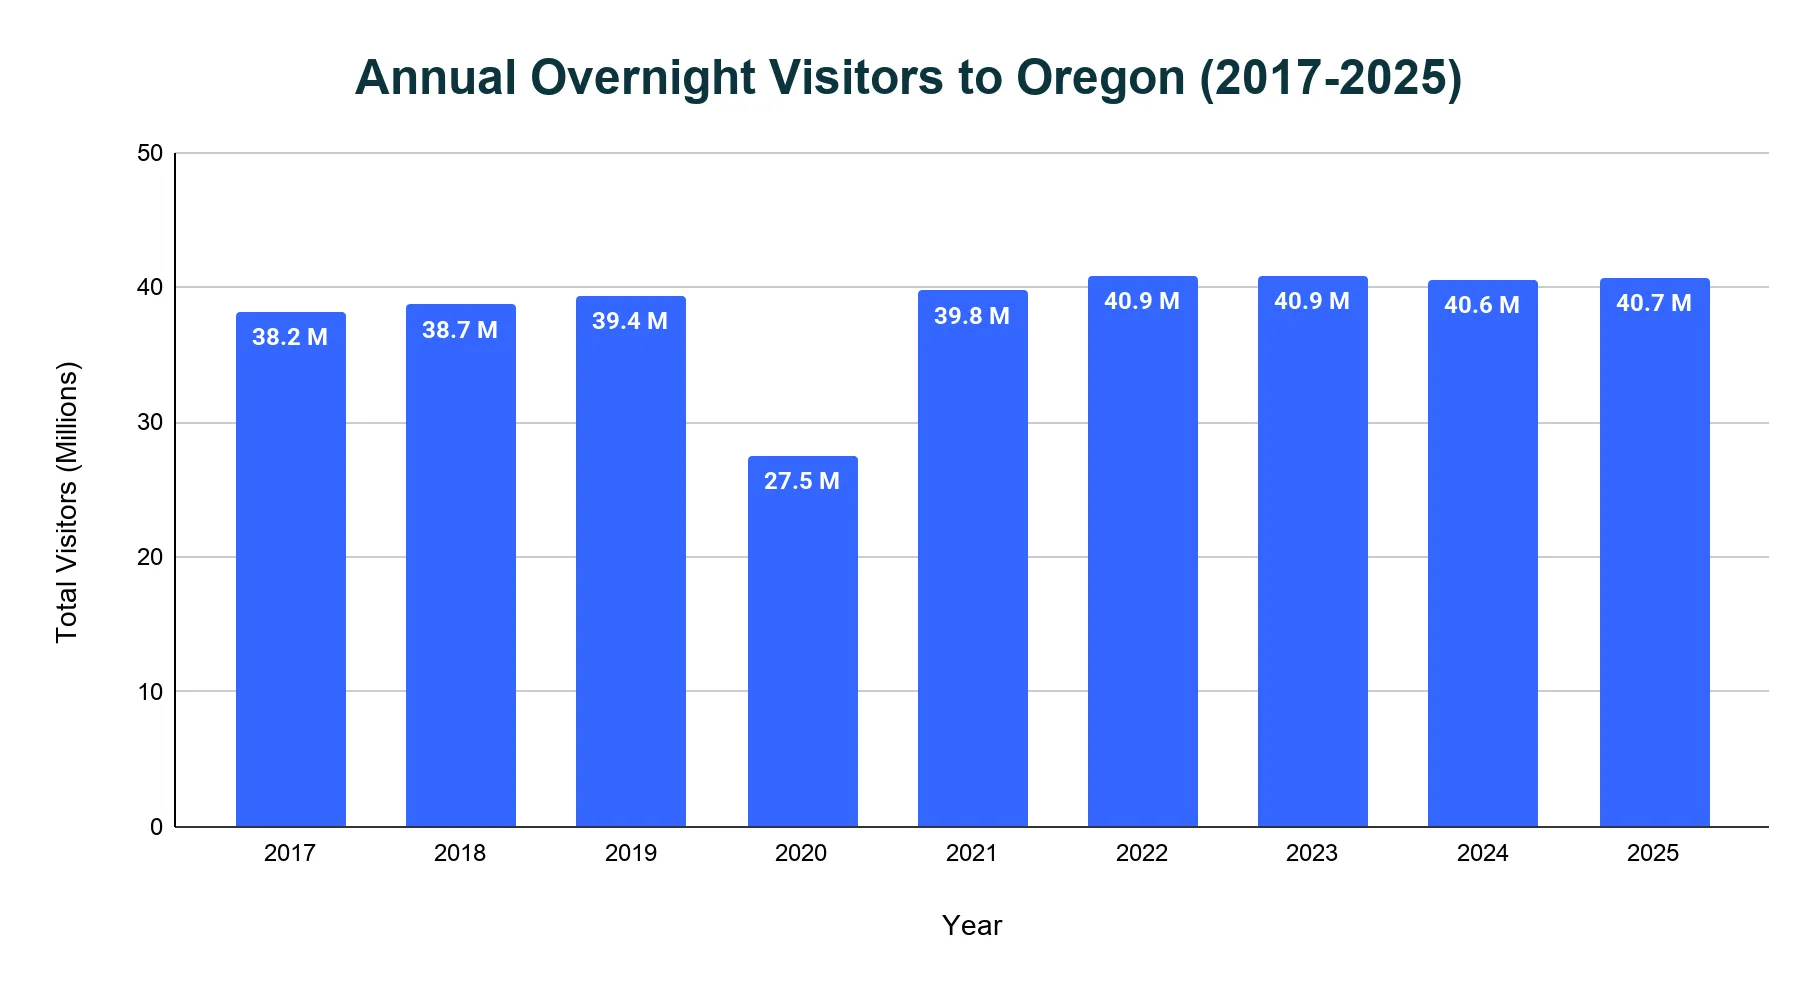
Oregon has drawn more than 40 million overnight visitors annually in recent years, with tourism rebounding strongly after the pandemic.
- The state welcomed 40.7 million overnight visitors in 2025, reflecting continued high demand.
- In 2019, before the pandemic, Oregon saw 39.4 million overnight visitors.
- That number dropped to 27.5 million in 2020 due to global travel restrictions, a 30% decline from 2019.
- Recovery was swift, with 39.8 million overnight visitors recorded in 2021, already surpassing pre-pandemic numbers.
- By 2022 and 2023, overnight visitors climbed to 40.9 million, marking a full recovery and modest growth beyond 2019 levels.
- Overnight visitor volume reduced to 40.6 million in 2024, but still remained above the 2019 level.
How many people visited Oregon in 2025?
- Oregon welcomed 40.7 million overnight visitors in 2025, maintaining strong visitation levels following the post-pandemic recovery.
- This represented a 0.25% increase over the previous year, while showing a 3.3% increase over the pre-pandemic year 2019.
How many people visited Oregon in 2024?
- Oregon welcomed 40.6 million overnight visitors in 2024, maintaining the state's position as a major tourism destination.
- This represents a slight decline of approximately 0.7% compared to the previous year, and a 3% increase over the 39.4 million visitors in 2019.
How much do visitors spend in Oregon each year?
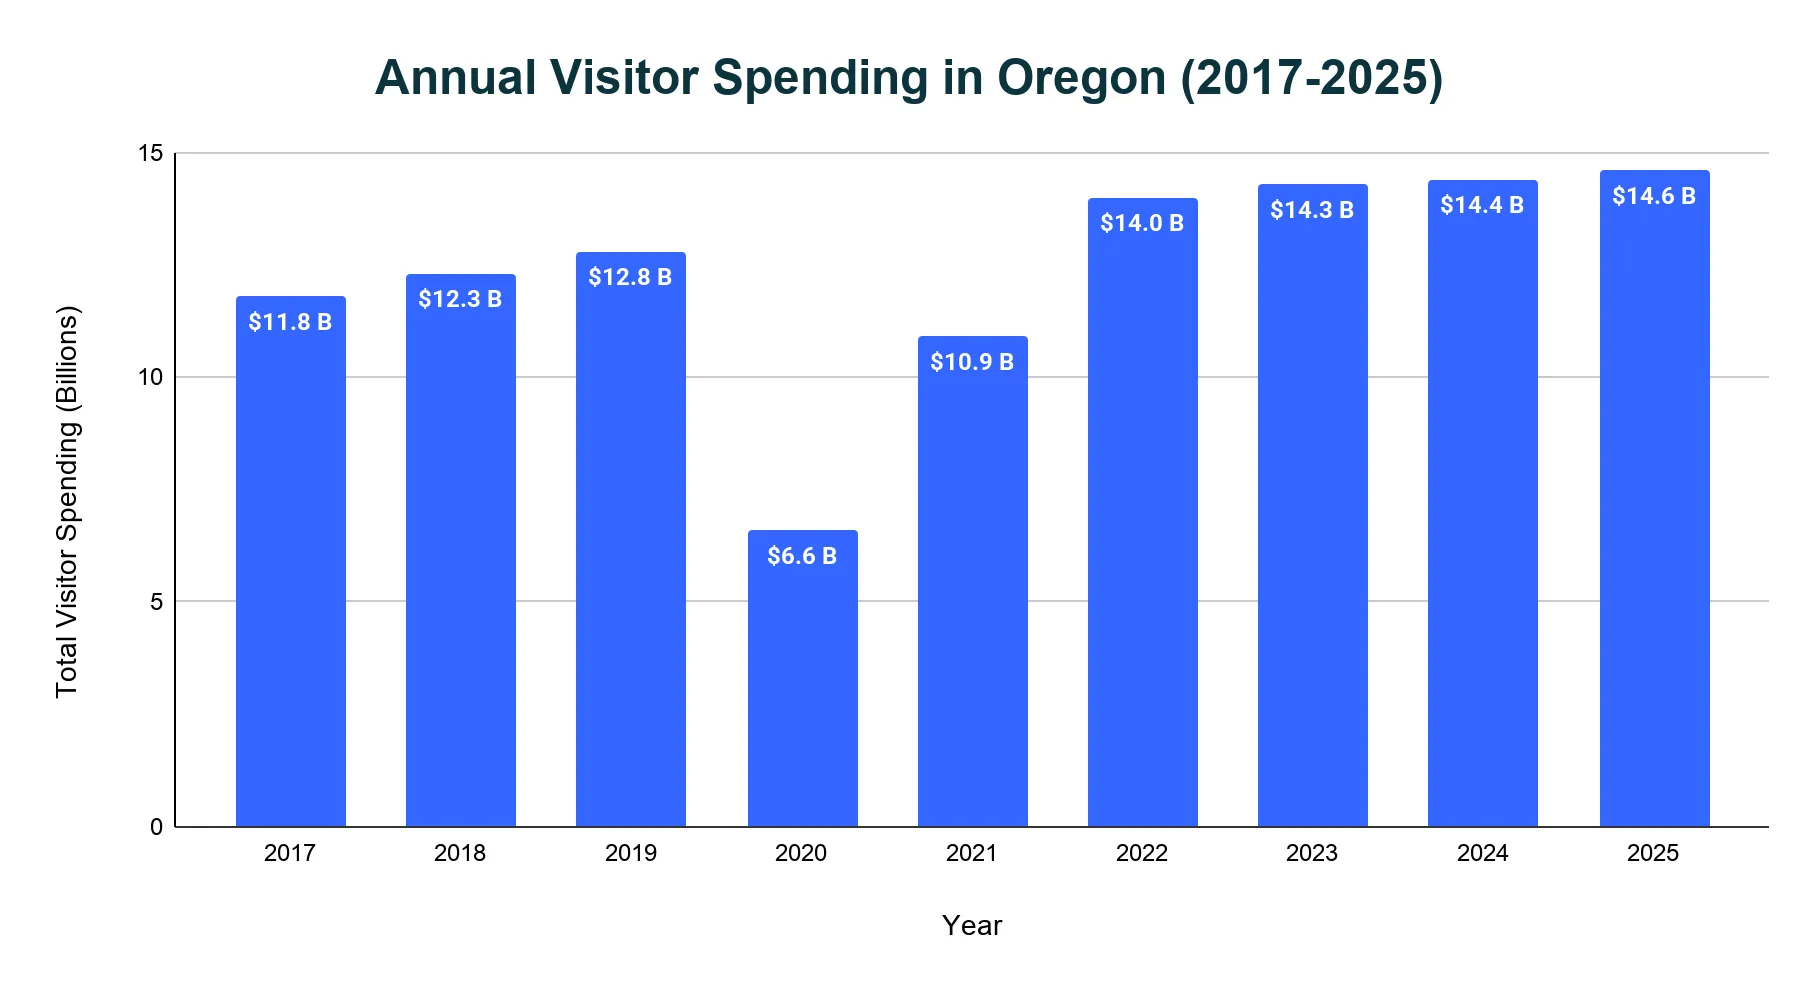
Tourism represents a major economic driver for Oregon, generating over $14 billion in direct spending annually and supporting essential state and local services.
- Direct travel spending reached $14.6 billion in 2025, representing a 1.4% increase from $14.4 billion in 2024.
- In 2023, direct visitor spending totaled $14.3 billion, though this represented only a nominal growth and actually declined when adjusted for inflation.
- Pre-pandemic spending stood at $12.8 billion in 2019.
- The pandemic caused spending to plummet to $6.6 billion in 2020, a catastrophic 48.4% decline.
- Recovery was rapid, with spending surging 28.4% in 2022 to reach $14 billion, surpassing pre-pandemic levels.
How much did visitors spend in 2025?
- Direct travel spending reached $14.6 billion in 2025, a nominal increase of 1.4% from 2024.
- This also represented a 14.1% increase from 2019.
How much did visitors spend in 2024?
- Total direct spending reached approximately $14.4 billion in 2024, a 0.7% increase from $14.3 billion in 2023.
- Compared to the pre-pandemic baseline, 2024 spending was 12.5% higher than the 2019 level.
Visitor Spending Breakdown
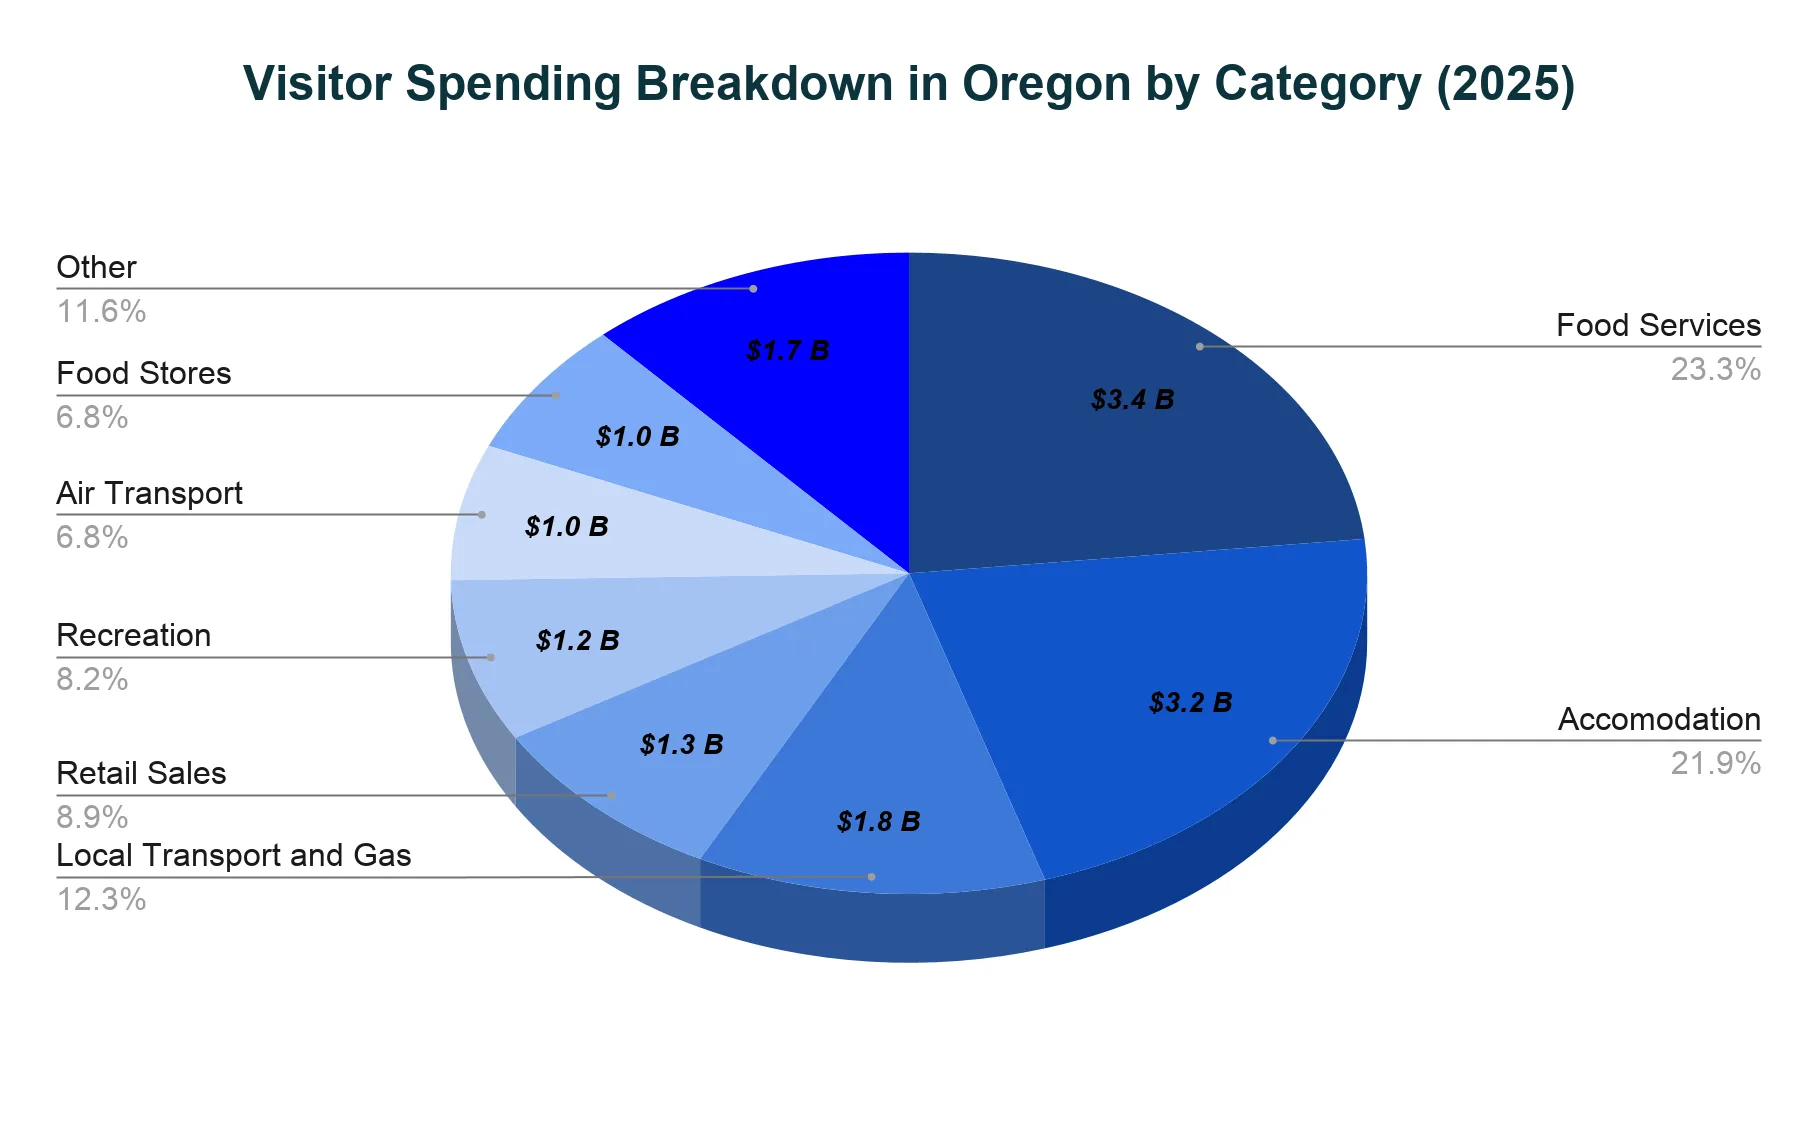
- Oregon visitors spent $3.4 billion on food services in 2025, accounting for 23.3% of total spending.
- Accommodation followed with $3.2 billion, representing 21.9%.
- Local transport and gas totaled $1.8 billion, or 12.3% of spending.
- Retail accounted for $1.3 billion (8.9%).
- Spending on recreation totaled $1.2 billion (8.2%).
- Visitors spent $1 billion each on food stores and air transport.
How much do visitors spend across different regions of Oregon?
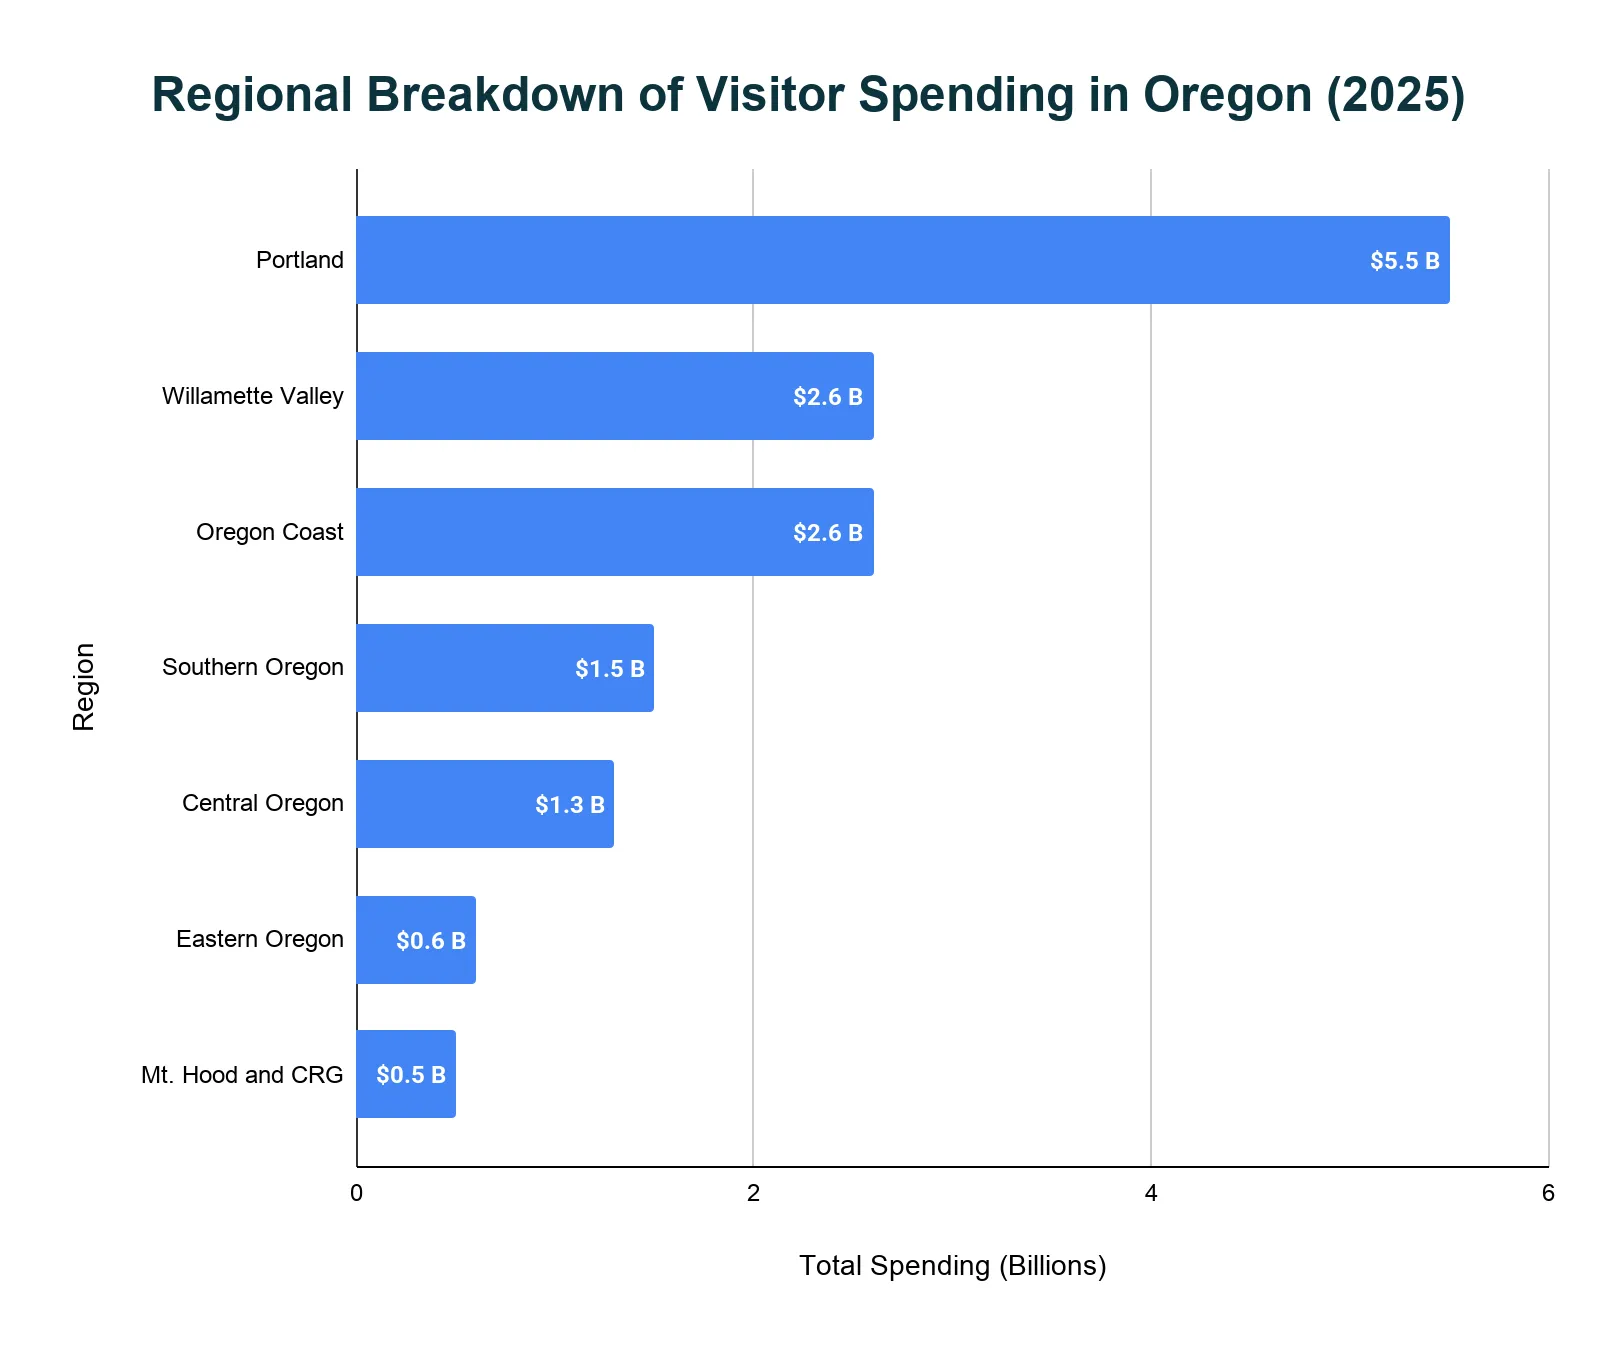
- In 2025, visitor spending was highest in the Portland region at $5.5 billion.
- It was followed by Willamette and Oregon Coast, each at $2.6 billion.
- At the lower end, Eastern Oregon and Mount Hood & Columbia River Gorge had the lowest at $0.6 billion and $0.5 billion respectively.
Who spends the most time in Oregon?
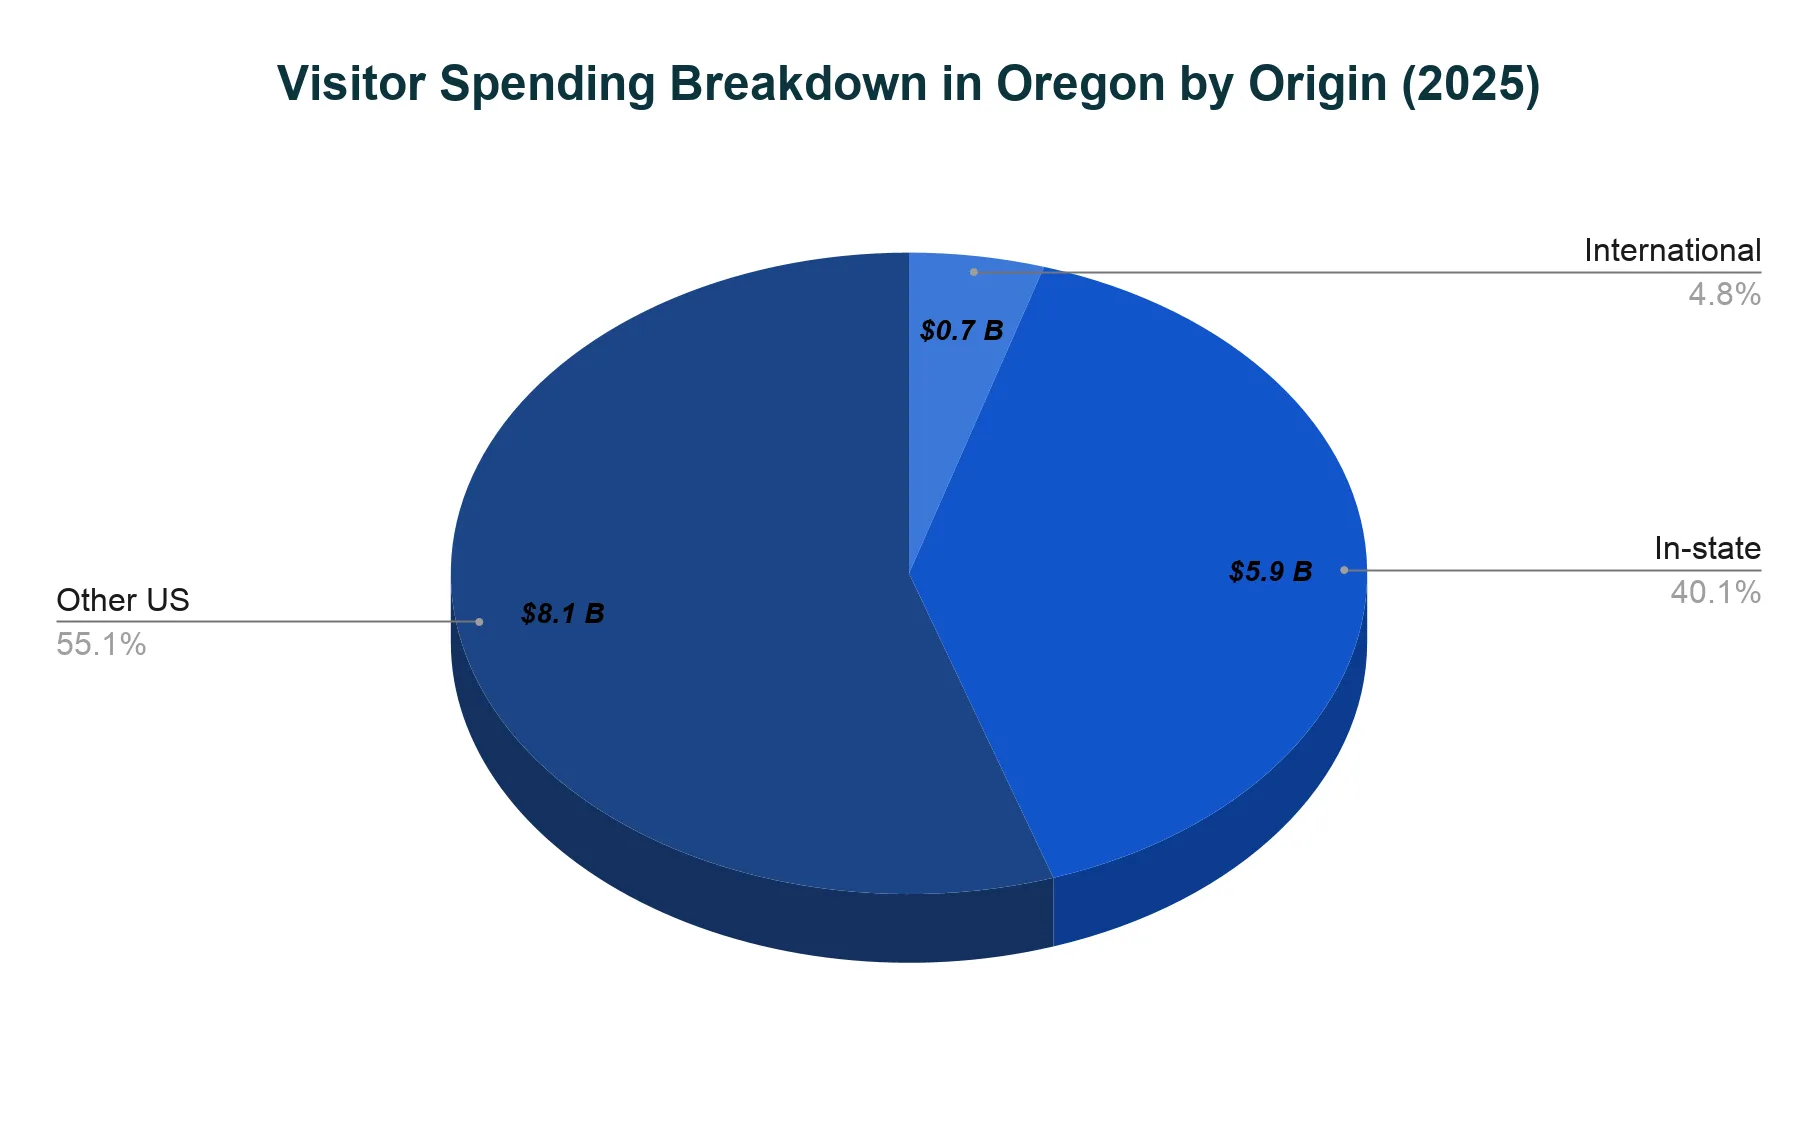
The post-pandemic period has seen a dramatic shift in Oregon's visitor composition, with domestic travel now accounting for an unprecedented share of the tourism economy.
- Domestic visitors accounted for 95.2% of all tourism spending in Oregon in 2025, with out-of-state U.S. travelers contributing $8.1 billion (55.1%) and Oregon residents adding $5.9 billion (40.1%).
- International visitors represented just under 5% of spending in 2025 with approximately $0.7 billion, a dramatic decline from the historical norm of 12% before the pandemic.
Which countries visit Oregon the most?
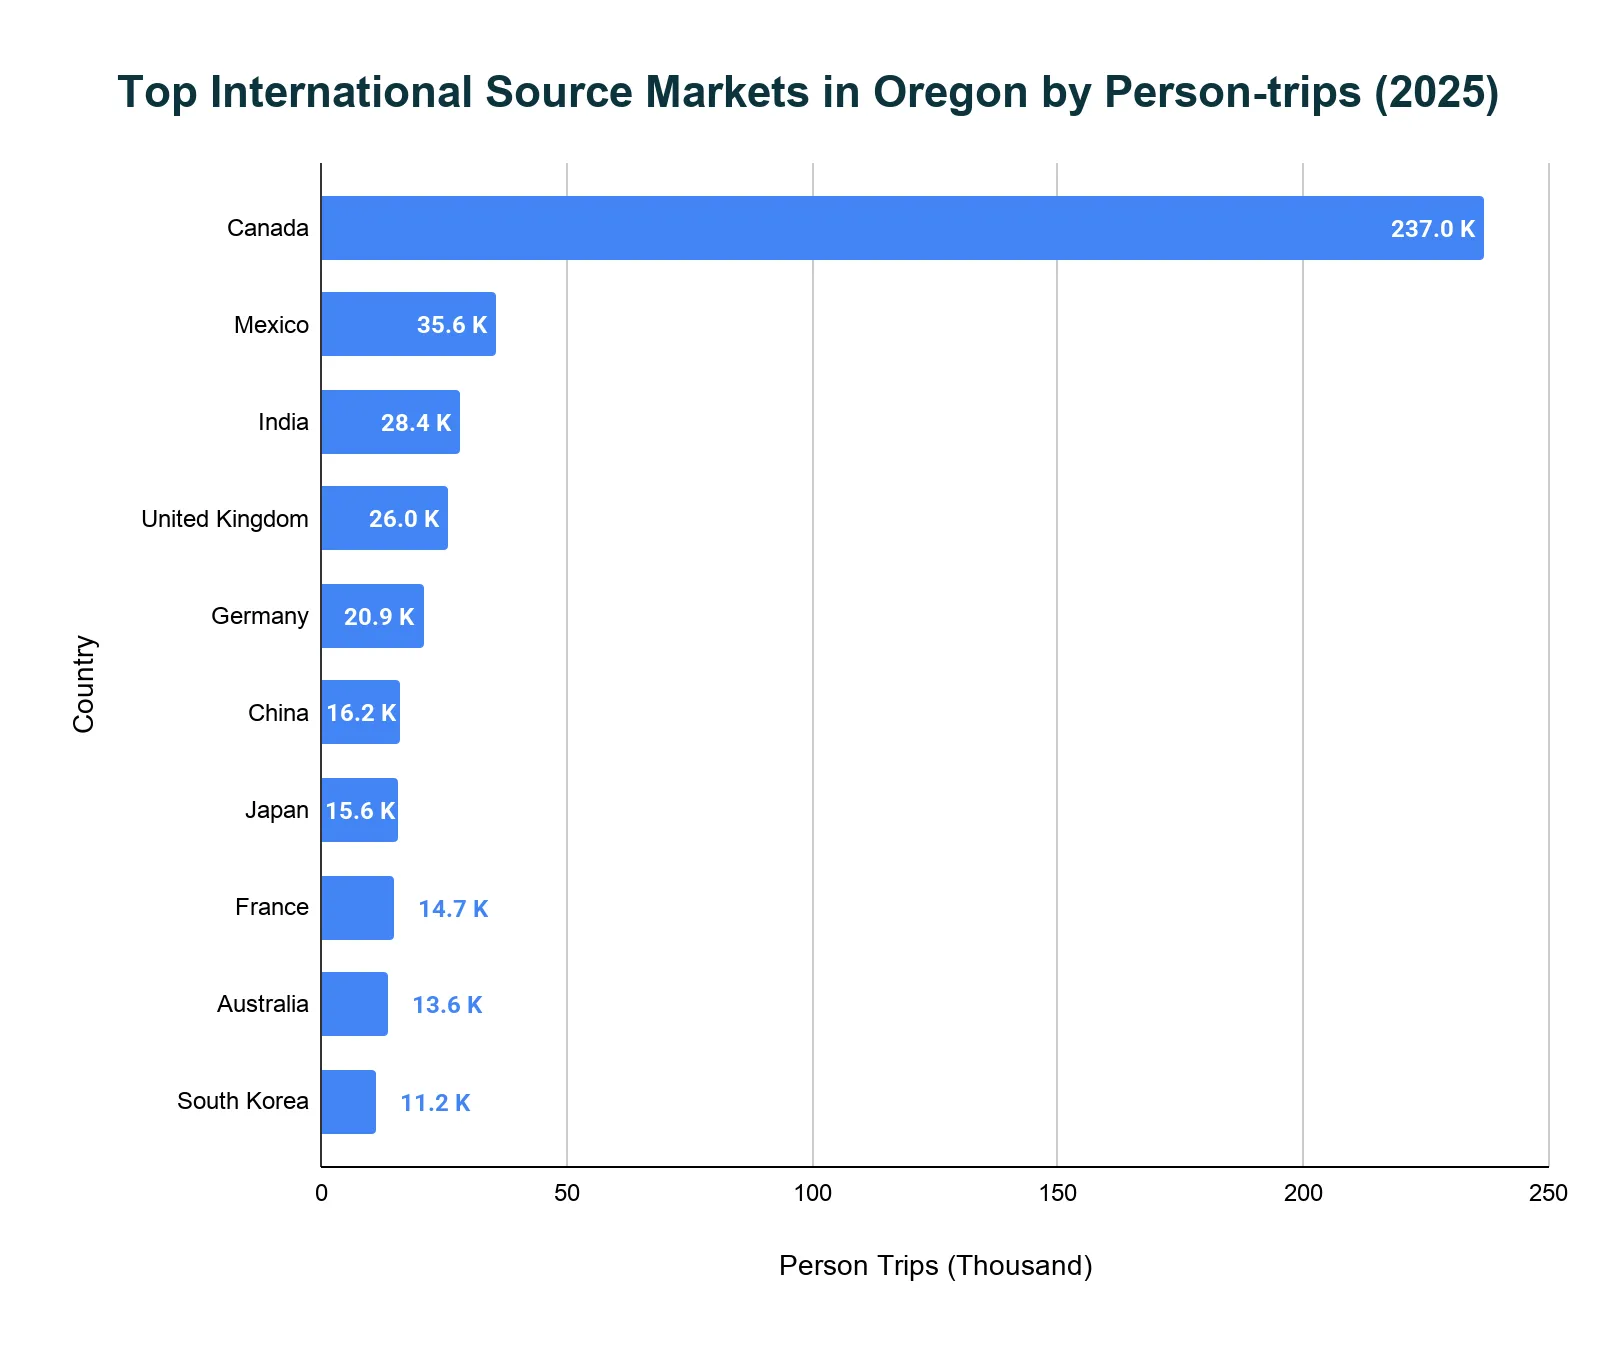
- Canada generated 236,984 person-trips to Oregon in 2025, making it by far the most important international source market.
- Mexico recorded 35,642 person-trips to Oregon, ranking as the second-largest international market by volume.
- India generated 28,425 person-trips, the United Kingdom recorded 25,951 person-trips, and Germany accounted for 20,891 person-trips to Oregon.
- Primary domestic air-travel markets for Oregon airports include major Western U.S. hubs such as Los Angeles, San Francisco Bay Area, Phoenix, Denver, and San Diego.
How long do tourists stay in Oregon?
- The typical trip duration is 5.4 days, or 4.7 nights, according to 2021-2022 visitor data.
- Trip length varies by destination within the state. For example, visitors to the more regional destination of Grants Pass in Southern Oregon stay an average of 2.7 days.
When is the best time to visit Oregon?
Oregon functions as a true four-season destination, with the optimal time to visit depending on specific activities and interests, though distinct seasonal patterns exist.
- Summer (June-August): This is peak tourist season, with warm, sunny weather ideal for coastal visits and high-altitude hiking. It is the most crowded and expensive period, with lodging rates increasing 50-65% in popular areas. Summer is best for accessing snow-free trails and enjoying outdoor activities statewide.
- Fall (September-October): The ideal shoulder season, offering pleasant weather and fewer crowds than summer. It is the peak season for wine tourism, coinciding with the grape harvest in the Willamette Valley. Accommodation costs drop considerably, while weather remains favorable.
- Winter (December-March): The premier season for snow sports at the Mount Hood and Mount Bachelor ski resorts. Coastal areas offer storm-watching and gray whale migration viewing (late December-January). It is the most budget-friendly time for non-ski areas, with the lowest lodging rates.
- Spring (March-May): An excellent shoulder season, with fewer crowds and blooming landscapes. It’s the best time to view waterfalls at their most powerful as a result of snowmelt in the Columbia River Gorge. Weather can be unpredictable, with rain showers interspersed with sunny days.
Related Travel Statistics
- Boston Tourism Statistics
- Kauai Tourism Statistics
- Louisiana Tourism Statistics
- Massachusetts Tourism Statistics
- Memphis Tourism Statistics
- Miami Tourism Statistics
- Mount Rushmore Tourism Statistics
- New Orleans Tourism Statistics
- New York Tourism Statistics
- Texas Tourism Statistics
- Universal Studios Hollywood Tourism Statistics
- Utah Tourism Statistics
What are the main attractions in Oregon?
- Columbia River Gorge National Scenic Area: This vast, 80-mile-long river canyon attracts more than 2.5 million visitors annually who come for its spectacular views and recreational opportunities.
- Multnomah Falls: Located within the Columbia River Gorge, this is the most visited natural recreation site in the Pacific Northwest. Multiple sources, including the U.S. Forest Service, report that more than 2 million people visit the 620-foot waterfall each year. Other sources place the number closer to 1.3 million.
- Valley of the Rogue State Recreation Area: This state park is one of the most visited in Oregon, drawing approximately 2 million visitors annually.
- Yaquina Bay State Recreation Site: Located on the coast, this popular park received over 1.5 million visitors annually.
- Harris Beach State Recreation Area: This coastal park in Brookings is consistently one of the state's most popular destinations. It attracts more than 1.5 million visitors annually.
Economic Impacts of Tourism In Oregon (2025)
- Direct Travel-generated Earnings: $5 billion (5% YOY increase).
- Direct travel-generated Employment: 122,920 jobs (1.4% YOY increase).
- State & Local Tax Revenue: $741 million (Local tax revenue increased 2.1%, while state tax revenue increased 3%).
- Travel Industry GDP: $7.6 billion (approximately 2% of the total Oregon GDP).
References
- Overnight Visitor Volume in Oregon State · travelstats.com
- Economic Impact of Travel in Oregon · industry.traveloregon.com
- Best Time to Visit Oregon · laotravellinks.com
- Top attractions of Oregon · oregonlive.com

