

 Popular Countries
 24/7 Support
Published Apr 29, 2025
Road trips have long been a defining part of American travel culture, with millions hitting the open road each year.
How Many Road Trips are Taken Each Year in the United States?
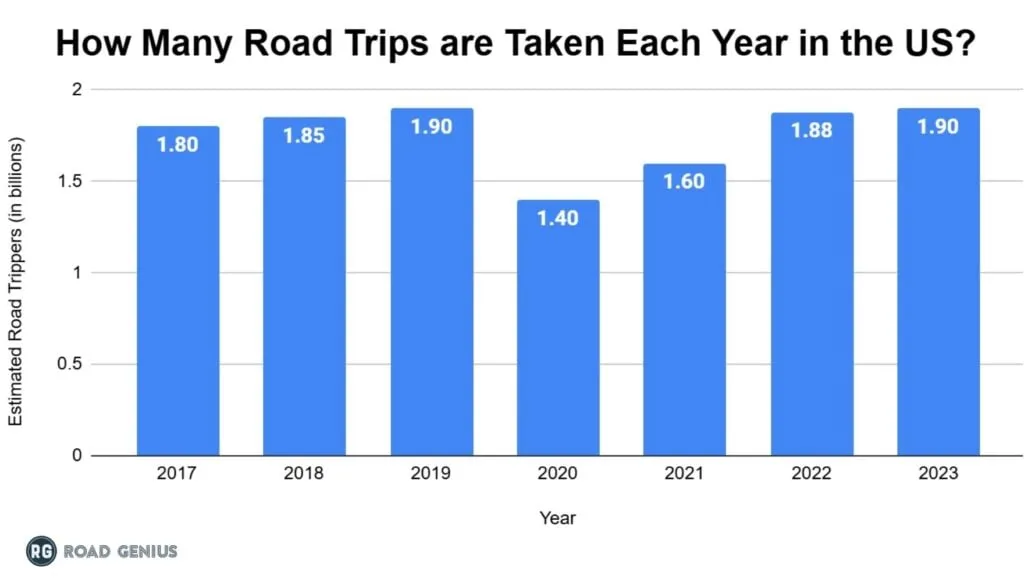
Road trips are one of the most popular travel choices in the U.S., with an estimated 1.95 billion road trips taken in 2024.
- In 2019, the total number of road trips taken reached 1.9 billion, reflecting a rise in domestic travel trends.
- 2020 saw a decline to 1.4 billion due to COVID-19 travel restrictions. A strong recovery followed, with 1.88 billion road trips in 2022.
- 2023 set a record with over 1.90 billion road trips taken and 2024 is expected to surpass previous records, indicating continued growth in road tourism.
Note: Year-over-year growth rates are approximate estimates based on U.S. Travel Association data and an assumed annual growth rate of 1-3%
Which State Has the Most Road Trips taken in the US?
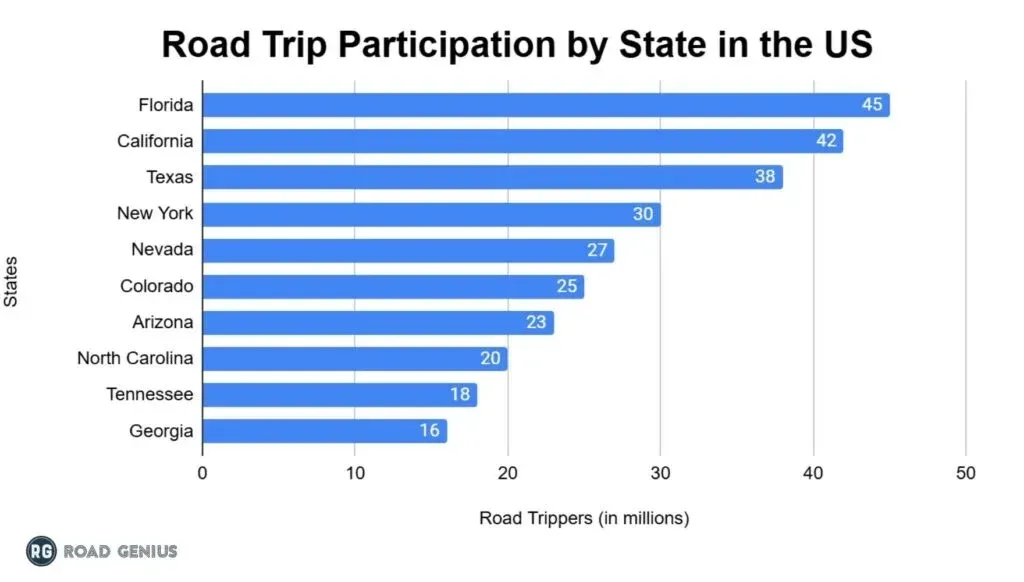
Florida ranks as the top U.S. state for road trips taken, attracting approximately 45 million road trips in 2024.
- California (42 million) and Texas (38 million) follow, with travelers choosing scenic coastal and inland routes.
- New York (30 million) and Nevada (27 million) also attract adventurers seeking long-haul journeys.
US Road Trip Demographics: Who Are the Road Trippers?
Age Group
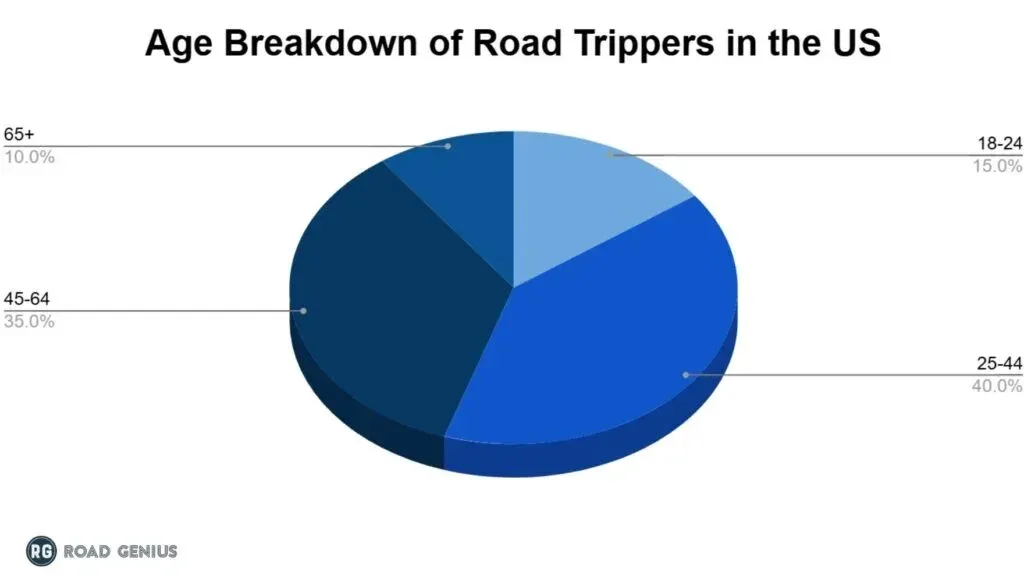
Road trips are most popular among people aged 25-44, who represent 40% of road trippers in the U.S. in 2024.
- The second-largest age group is 45-64, accounting for 35% of road trippers.
- People aged 18-24 represent 15% of all road trippers, making them the third-largest age group.
- The 65+ age group is the least likely to take road trips, representing just 10% of all road trippers.
Travel Preferences
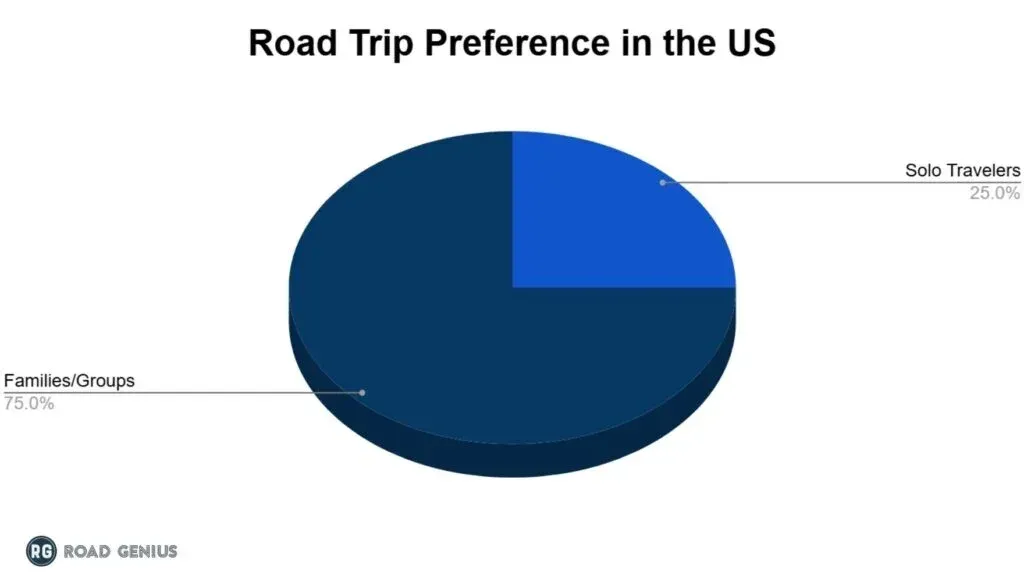
Families and groups are the most common road trip participants, comprising 75% of all travelers.
- Solo travelers represent 25%, highlighting the growing trend of independent road travel.
Income Demographics
Middle-income earners ($50,000 – $99,000 annually) make up the largest share (45%) of road trippers.
- Low-income earners (<$49,000) are the second-largest group, accounting for 30%, often utilizing budget-friendly camping and free campsite options.
- High-income earners ($100,000+) represent 25% of road travelers, often opting for premium caravan parks and motorhomes.
| Road Tripper Demographics by Income Level in the US | |
|---|---|
| Income Level | Percentage of Road Trippers (%) |
| Low Income (<$49K) | 30% |
| Middle Income ($50K-$99K) | 45% |
| High Income ($100K+) | 25% |
Costs & Budgeting for US Road Trip
How Much Does It Cost to Travel Around the US by Road?
Average Daily Cost Breakdown for Road Trips (2024)
- Fuel cost averages around: $40-$70 per day. Consider also the cost of renting a car for the road trip averaging $53-$65 per day, depending on city.
- Accommodation: $100-$200 per night (hotels) / $20-$50 per night (camping)
- Food: $30-$80 per day (restaurant dining vs. self-catering)
- Activities & Attractions: $20-$100 per day
How Much Do People Spend While Road Tripping in the US?
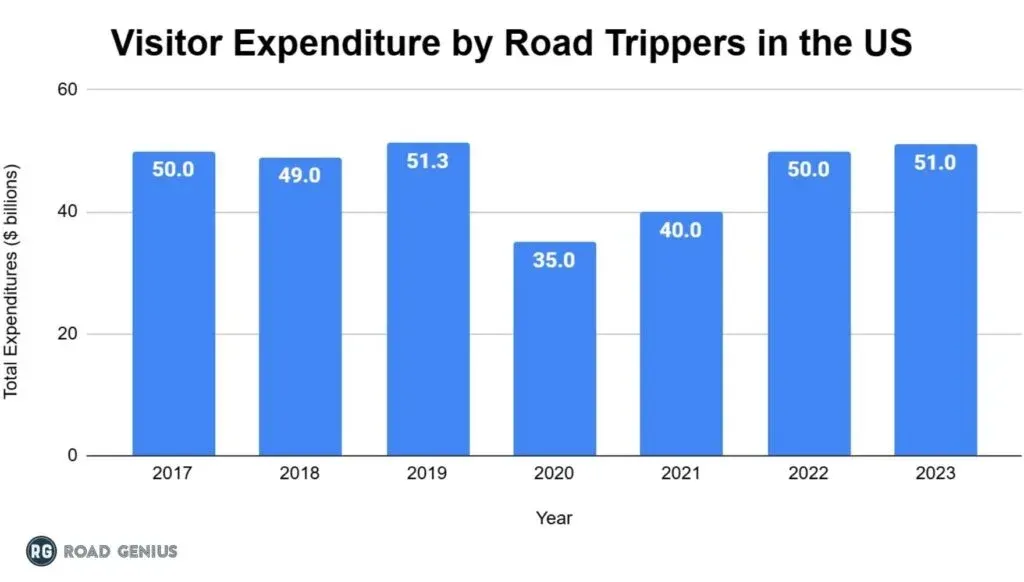
Over $52 billion is projected to be spent by road trippers in the U.S. in 2024.
- In 2019, spending on road trips peaked at $51.3 billion, marking a pre-pandemic high.
- However, in 2020, spending dropped to $35 billion due to COVID-19 travel restrictions.
- Road trip spending recovered by approximately 33% in 2021 to about $46.6 billion (from $35 billion in 2020) and continued to grow, reaching $50 billion in 2022 and $51 billion in 2023.
- In 2024, spending is expected to rise further to $52 billion, reflecting inflation adjustments and increased road trip participation.
Where Do People Go on Road Trips in the U.S.?
Route 66, stretching from Chicago to Santa Monica, is the most popular road trip route, attracting over 5 million road trips annually. This iconic highway is famous for its historic landmarks, classic diners, and nostalgic American road trip experience.
- The Pacific Coast Highway (California) follows closely, with 4.5 million road trips taken, offering breathtaking coastal views, cliffside highways, and scenic stops from San Francisco to Los Angeles.
- New England’s Fall Foliage Route sees 3.8 million road trips taken each year, popular for its autumn leaves and picturesque small towns in states like Vermont and Massachusetts.
- The Blue Ridge Parkway, which spans 469 miles through Virginia and North Carolina, attracts 3.5 million road trips annually.
- The Florida Keys Overseas Highway, with its clear ocean views and island-hopping experience, attracts approximately 3.2 million road trips annually.
| Most Popular Road Trip Destination in the US | ||
|---|---|---|
| Rank | Road Trip Route | Number of Visitors (millions) |
| 1 | Route 66 (Chicago to Santa Monica) | 5.1 |
| 2 | Pacific Coast Highway (California) | 4.5 |
| 3 | New England Fall Foliage Route | 3.8 |
| 4 | Blue Ridge Parkway | 3.5 |
| 5 | Florida Keys Overseas Highway | 3.2 |
More Statistics
- Fuel Cost Statistics in the US
- Car Ownership Statistics in the US
- Montrose Regional Airport (MTJ) Statistics
- Newark Airport (EWR) Statistics
- Salt Lake City International Airport Statistics
- Washington DC Tourism Statistics
Future of Road Trips in the U.S. (2025 & Beyond)
Emerging Road Trip Trends
- Electric Vehicles (EVs): Growth in EV charging infrastructure is making long-distance EV road trips more viable.
Learn More About Electric Vehicle Sales Globally.
- Sustainable Travel: More travelers are seeking eco-friendly accommodations and carbon offset programs.
- AI-Powered Road Trip Planning: Apps are becoming more advanced with personalized recommendations for road trip routes.
- Work & Travel Hybrid: More remote workers are combining travel with long-term road trips.
Forecast for Road Trips & Tourism
- U.S. domestic travel spending is expected to rise 3-4% annually through 2028.
- Road trips will remain one of the most cost-effective and flexible travel options.
References
- U.S. Travel Association — annual road trip statistics and domestic travel trends · ustravel.org
- Visit The USA — top road trip destinations and state-specific trends · visittheusa.com
- AAA Newsroom — annual road trip spending and budgeting statistics · newsroom.aaa.com
- US Census Bureau — Available Vehicles in American Households · census.gov
- Bureau of Transportation Statistics — LAS Performance Data and Route Information · bts.gov
- NPS — Annual Bear Attacks, Park Reports, Demographics and Trends · nps.gov

